
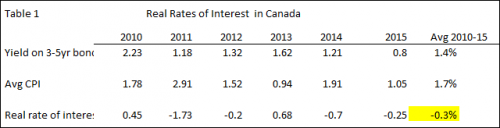
Bonds & Interest Rates
In his December 8th speech, the Governor of the Bank of Canada, Stephen Poloz introduced the possibility of negative interests as a policy tool. He was adamant that the Bank was not embarking upon this policy, rather it was exploring the implications of using such an unconventional policy instrument in times of economic shock or major dislocations. It was his view that “it’s prudent to be prepared for every eventuality.” (1)
Yet, his discussion went beyond just academic musings and into the practical realm of how negative interest rates would impact the Canadian financial markets. In 2009, the Bank looked at the application of negative interest rates, but rejected it as a possible tool. What has changed since that time that caused the Bank to come out in favor of such an unprecedented policy move?

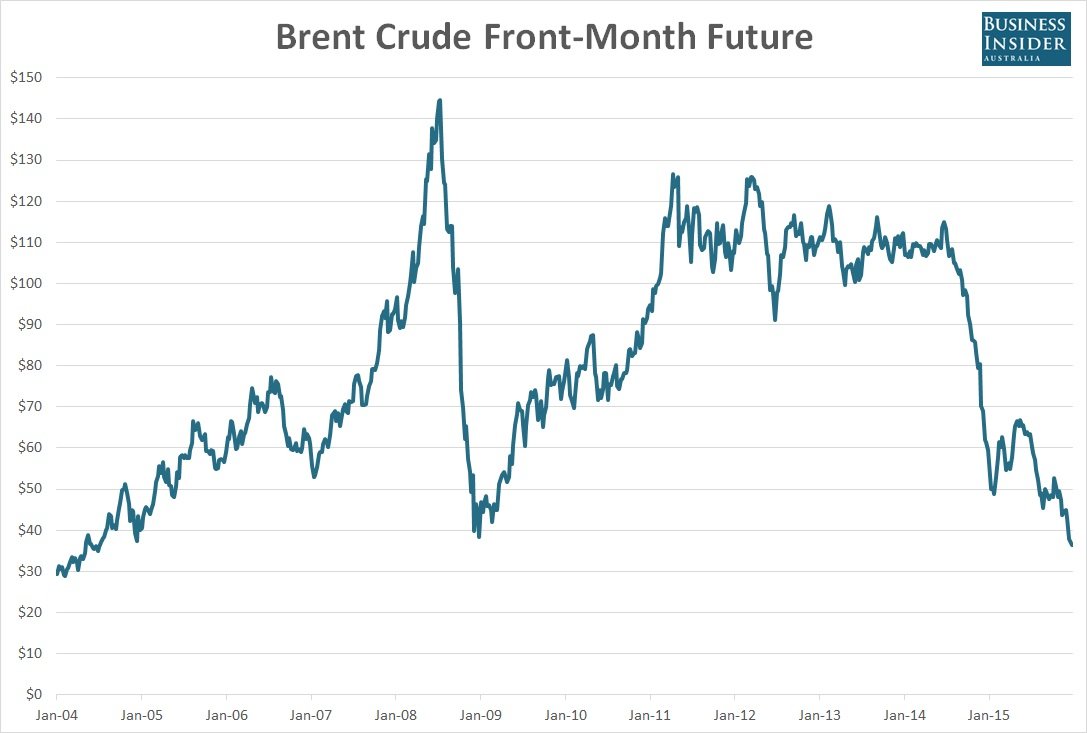
It has been a terrible year for crude oil. Despite a tentative bounce overnight, Brent crude has fallen by more than 36% in 2015, leaving the global benchmark price down more than 68% from mid-2014.
It now sits at levels last seen 11 years ago, and, if the options market is anything to go by, speculators and oil producers themselves don’t expect the price to recover anytime soon.

 For this week’s column, I’m getting so many questions from readers, I decided it would be best to answer the most important ones. So let’s get started!
Q: Larry, you were right as rain about gold again this year. It crashed and came close to one of your targets at the end of November. Is the bottom in yet?
A: It could be, but it’s really too soon to say. By that I mean we have no proof of a bottom. Yes, gold has tested major support at the $1,048 level and it did so at the right time, cyclically speaking. So that’s good.
But, gold has not yet climbed enough above overhead resistance to issue a buy signal that would confirm the low. If it fails to do so, then gold could easily move lower into early January.
The specific support and resistance levels and buy and sell signals for gold are of course reserved for members of my services. But for now, generally speaking, keep an eye on the first initial level of major resistance at the $1,095 level and support at $1,036. A close above or below either one of those figures (nearest futures) will determine the next big move.
For silver, you want to watch $15.46 on the upside and $13.75 on the downside. Yes, that’s a big range, but in between those two figures for silver is effectively no-man’s land. Other than for short-term futures traders, there is nothing to do in silver at this time (same for gold).
Q: Why isn’t inflation a big problem now? I just don’t get it and there are still so many experts out there saying it’s coming.
A: As I’ve said all along, printing money by itself is not inflationary if the majority of investors and consumers don’t want to spend or borrow money. That’s been the case for years as consumers, investors and businesses — the private sector — all retrench …
Either by their own volition, or where it’s been forced upon them by governments via financial repression of higher taxes, confiscations, capital controls, and more. Which has been the case in many countries in Europe.
There are many more reasons, too many to discuss in a short column. Two biggies though are A) Global debt is now well over $200 trillion, so printing $5- or even $10- or $20 trillion is hardly going to make a dent …
And B) Banks are reluctant to lend. In fact, most of the money printed by the Fed has been reinvested by banks back with the Fed in what are called “excess reserves” … which are bank reserves that banks don’t need to keep on hand.
The European Central Bank (ECB), unlike the Federal Reserve in the U.S., is actually charging banks that place excess reserves back with the ECB in the form of negative interest rates. The theory there is that if the banks get charged for not lending, then penalize them and they will start lending.
But it’s not working, at all. That shows you just how intense the deflation is, and the money hoarding is.
Q: Where do your war cycles stand?
A: Precisely as forecast, they continue to ramp up big time. You can see it all over the world, in Syria, with ISIS, in Asia between China and Japan, in social unrest in Europe, in increasing terrorism and more.
The war cycles point up all the way into 2021, so fasten your seatbelts.
Q: You’ve been forecasting that the U.S. stock market will take a moonshot to as high as 31,000 — over the next few years. Is that forecast still on target?
A: Absolutely. There is no doubt in my mind we will see the Dow move to at least 31,000 and possibly much higher. And not despite turmoil in the world, but because of it. The Dow and other blue-chip type stocks can and often do act just like gold, as a safe haven for capital and as an inflation hedge.
But the Dow has not yet completely broken out to the upside. A sharp, swift correction is still way overdue. When that comes, I will be giving the signal to back up the truck for stocks. But not until then.
Q: You really nailed oil on the head Larry, predicting it would fall well below $40. Has oil bottomed now?
A: No, but I think a bottom is very close. My models show it coming the first week of January, so stay tuned. I should have some very important comments coming about oil, right after the holidays.
Q: Has the mining sector bottomed? You saved my entire life savings by getting me out of the way back in 2011. Thank you!
A: You’re most welcome. The carnage in the mining sector is one for the record books, losses of 90% on average for most publicly-traded mining companies.
The bottom is not in yet, but it could be right around the corner. So stay tuned!
That’s it for now, stay tuned — my models are showing that this month and next will be pivotal for almost all markets, leading to major trends unfolding and a slew of new profit opportunities.
Best wishes,
Larry
 Sometimes one big event dominates the landscape, like last week when the Fed raised interest rates. Other times a bunch of less-universally-significant-things add up to a meaningful story. And the story that follows here is, of course (given the venue), ominous.
First up is the much-discussed US$9 trillion that developing countries borrowed back when the dollar was weak and their currencies were relatively strong. Pundits have been warning that with the dollar soaring this debt was largely underwater and therefore a threat. But as far as anyone could tell it wasn’t blowing anything up.
Then on Friday a big Mexican construction company defaulted..…continue reading HERE

 Existing homes sales plunged 10.5% this month which the NAR attributes to an initiative called “Know Before You Owe“.
Economists, apparently unaware of “Know Before You Owe”, came up with a consensus estimate of 5.320 million sales, SAAR ( seasonally adjusted annualized rate), the same as last month.
New closing rules appear to have depressed sales of existing homes in November which fell 10.5 percent to a much lower-than-expected annualized rate of 4.760 million. The year-on-year rate, for the first time since September last year, is suddenly in the negative column, at minus 3.8 percent. The National Association of Realtors, which compiles the report, attributes the weakness to the “Know Before You Owe” initiative which is lengthening closing times and which likely makes November an outlier. The NAR suspects that the sales delays in November are likely to give a boost to December’s totals.
Weakness in the month is centered in single-family sales, down 12.1 percent to a 4.150 million rate. Condos rose 1.7 percent to a 610,000 rate.
All regions show declines for total sales with the Northeast, at a modest plus 1.5 percent, the only one to show a year-on-year gain.
Low supply is a problem in the market, at 2.040 million vs 2.110 million in October. Relative to sales, supply is at 5.1 months which, because of November’s sales weakness, is up slightly from prior months. For a balanced market, supply is generally pegged at 6.0 months.
Price data are positive, showing some traction with the median up 0.5 percent in the month to $220,300. Year-on-year, the median is up 6.3 percent which is right in line with the trends in this morning’s FHFA report.
For volatility, this report is usually tame compared to the new home sales report. Judging strength right now is difficult but a fair judgment is that growth in the housing sector is probably moderate and a plus for the economy. New homes sales are out tomorrow and are expected to show a gain.
What’s the Excuse for Last Month?
Interestingly, “Know Before You Owe” came into play in October 3.
Why did the NAR pass up a golden opportunity to use that excuse last month when existing home sales dipped?
Disturbing Last Month
From Bloomberg last month: The number of homes on the market, at 2.14 million, is actually below the 2.24 million this time last year, an unwanted surprise that the National Association of Realtors, which compiles the existing home sales report, calls “disturbing”.
No Longer Disturbing This Month
Now that the plunge has deepened, it’s no longer disturbing, it’s because of “Know Before You Owe”.
I have a simple question: If “Know Before You Owe” took place effective October 3, and that’s really what’s to blame, then, why wasn’t there a huge plunge last month instead of a “disturbing” surprise?
New Rules
Since not even the NAR seems to understand the implications, let’s take a step back with a peek at Know Before You Owe Mortgages as seen by PBS.
There are two big changes. One, the forms you get right after you make a mortgage application and the form you get right before closing is going to be simplified.
The terms are supposed to be easier to understand. You’re supposed to understand if you have an adjustable rate, and the rate will go higher after a certain number of years.
You’re not supposed to be surprised if, you know, 10 years from now you have some sort of balloon payment on a mortgage or anything like that. So, that’s the first change.
The second change is before – before closing, you’re supposed to get these documents at least three business days before closing.
And that’s designed so you have time to understand what you’re getting into before you sign on the dotted line.
Now, it seems to make sense, but if you make any changes within that three-day window – so if you decide you want to switch, say, a fixed-rate mortgage to an adjustable-rate mortgage, that resets the three days.
As for people who are trying to, you know, closely time home closings, resetting that three-day window can lead to some headaches.
So what’s going to happen over the next few months is we’ll see whether or not home closings are happening on time or whether, you know, some of these mortgage lenders or real estate agents weren’t actually ready and we see a lot of closing delays.
Before vs. After
The forms are simpler and easier to understand. Those wishing to compare the before and after forms can do so at the Consumer Finance Protection Bureau.
If there were first month glitches, why didn’t they turn up a month ago?
What I Said Last Month
Let’ turn to my report from a month ago for more details about recent trends.
Please consider Existing Home Sales Decline, NAR Calls Report “Disturbing”; First Time Buyers Decline Third Year; Housing Clearly Weakening.
If there was an “outlier“, perhaps it was the September gain, not the August and October declines.
And even though September sales data bounced, prices didn’t. The median price declined 2.9% in September.
Bloomberg concluded “This report, which wraps up a busy and mostly positive week for housing data, is a big plus for the housing outlook, suggesting that demand for existing homes may be catching up with demand for new homes.“
I responded: “That last statement by Econoday is amusing. For starters, new home sales are not all that strong, and it is new home sales that contribute most to GDP and family formations.“
As a followup, please note my November 18 article Housing Starts Plunge 11% to 7-Month Low: Single-Family Down 2.4%, Multi-Family Down 25%
October wiped away all of September’s good news and then some. 1.060 million starts was far below Econoday Consensus Estimate of 1.162 million SAAR and also well below the lowest estimate of 1.125 million.
Bloomberg pointed out hidden strength including “important good news” on October permits.
Spotlight on Permits
- September month permits were down 5%
- October permits rose only 4.1%.
- September starts were revised lower from 1.206 million to 1.191 million (a 15,000 -1.24% negative revision).
In aggregate, that hardly looks like “important good news“.
First Time Buyers Decline Third Year
The National Association of Realtors (NAR) notes First-time Buyers Fall Again in NAR Annual Buyer and Seller Survey.
“The share of first-time buyers declined for the third consecutive year and remained at its lowest point in nearly three decades as the overall strengthening pace of home sales over the past year was driven more by repeat buyers with dual incomes.“
Housing Clearly Weakening
On average, starts are weakening, permits are weakening, new home sales are weakening, price data is weakening, and existing home sales are weakening.
First time buyers, a strong indication of family formation, is at a three-decades low, and the NAR is “disturbed” about trends.
Simply put, housing is weakening, albeit in a volatile way, making it a bit harder to spot the change in underlying trends.
Synopsis
The disclosure forms are easier. They are also down in number, from four to two. The rule change took place on October 3.
Somehow that rule change had a huge impact in November but only a small (and not even mentioned) impact in October. That’s possible, but color me skeptical.
By November, one would have thought lenders would be bright enough to go over the rules with borrowers in advance to avoid closing delays.
Next month could be telling, one way or another.


-
I know Mike is a very solid investor and respect his opinions very much. So if he says pay attention to this or that - I will.
~ Dale G.
-
I've started managing my own investments so view Michael's site as a one-stop shop from which to get information and perspectives.
~ Dave E.
-
Michael offers easy reading, honest, common sense information that anyone can use in a practical manner.
~ der_al.
-
A sane voice in a scrambled investment world.
~ Ed R.
Inside Edge Pro Contributors

Greg Weldon

Josef Schachter

Tyler Bollhorn

Ryan Irvine

Paul Beattie

Martin Straith

Patrick Ceresna

Mark Leibovit

James Thorne

Victor Adair