
Stocks & Equities
APRIL 14, 2016, 6:35 AM
Briefly: In our opinion, speculative short positions are favored (with stop-loss at 2,100, and profit target at 1,950, S&P 500 index).
Our intraday outlook is bearish, and our short-term outlook is bearish. Our medium-term outlook remains bearish, as the S&P 500 index extends its lower highs, lower lows sequence:
Intraday outlook (next 24 hours): bearish
Short-term outlook (next 1-2 weeks): bearish
Medium-term outlook (next 1-3 months): bearish
Long-term outlook (next year): neutral
The U.S. stock market indexes gained between 1.1% and 1.3% on Wednesday, extending their short-term uptrend, as investors’ sentiment improved ahead of quarterly corporate earnings releases, among others. The S&P 500 index broke above its recent consolidation along the level of 2,050. The nearest important level of resistance is at around 2,080, marked by the late December high. The next resistance level is at 2,100-2,120. On the other hand, support level is at 2,030-2,040, marked by recent consolidation, and the next level of support is at 2,000-2,020, marked by previous level of resistance. The index continues to trade within a descending medium-term trading channel, as the daily chart shows:

…..read more analysis and get bigger charts HERE
also:
Jim Rogers on Currencies, Agriculture and Government Incentives

Strange. Most investors I talk to think the world is doing just fine. They say the U.S. economy is growing and the gains in employment have been nothing short of spectacular.
They say Europe is not collapsing as so many experts have feared. And that Mario Draghi’s pedal-to-the-metal euro printing is working.
They even claim Britain is doing fine, France will escape its troubles and inflation is coming back.
About the only part of the world they’re negative on is China, claiming that if there’s one single threat to global growth, it’s the Middle Kingdom and nothing else.
Well, I’ve got news for them. This is precisely what the markets want you to believe. They have an uncanny way of first separating you from your money, then washing it all down the drain.
When the markets are acting like this, making almost everyone feel everything is just dandy, or will turn out dandy — risk levels are actually at their highest. Investors are lulled to sleep. They’re complacent. They’ve dropped their guard.
And the next thing that happens? Those investors lose their money, big time.
Look. Markets do not change their major trends all that often. At most, a market may change its major trend once every three years. More commonly, they change trends every five years. And even that is rare. Most major trends persist for at least seven years.
Instead, what happens is this. You get a major trend unfolding on cue, with its cycles. Then you get a pause, a sideways consolidation period, often wrought with pullbacks.
The money that is made during the trending part of the move is often given back during the non-trending, sideways portion. Especially by trigger-happy, impatient investors and traders.
It seems they just can’t stand the fact that all markets need to occasionally take a breather. That all markets need to shake out the earlier investors — so new investors can come in. Or so short-sellers can take profits and cover their positions (in bull markets).

Markets are, yes, living, breathing beasts whose main function is to outwit you. And one of the ways markets do that is to stage what seem like long, sideways periods of tight trading ranges and pullbacks — or rallies in bear markets — that frustrate the heck out of you and force you into making mistakes at the worst possible times — just before the major trends come back to the forefront.
As they are right now. For instance …
A. There is no evidence whatsoever that gold is going to blast off now to $1,400 and higher, as so many pundits would have you believe.
Simply look at my latest neural net forecast model for gold and you’ll see what I mean.
Yes, gold is rallying in the very short term. But the rally is merely short-term noise in the market, designed to throw you off course.
The major intermediate-term trend is lower, into late May. And then the major long-term trend will re-emerge, which is a bull market, and the next leg higher.
So what should you be doing now in gold? You should be looking to buy the decline into May, or if you’re a speculator, you should be shorting gold, looking to make some money as gold slides into a late May cycle low.
Could this model be wrong? Sure it could. But everything I monitor, not just my neural net models, also tells me that gold must pullback — probably to below $1,200 — before the next bull leg higher unfolds.
Ditto for silver, platinum, palladium and for mining shares.
So if you want to be part of the majority that will get eaten up by gold trying to trap you on the wrong side of the market with its meager, very short-term rallies like we’re seeing right now, be my guest: I’ll sell you all the gold you want.
B. Then there’s the dollar right now, another perfect example of a fake-out move that’s going to hurt a lot of analysts, traders and investors. Its recent decline has many of them convinced the dollar is dying again and that other currencies, especially the Japanese yen, are rising to be king of the mountain.

All because the dollar has staged a minor pullback!
You can see it here on this chart I have for you. Actually, it’s a bit of a test, for you to see how much perspective has to do with things.
Most pundits are looking at the decline in the dollar on the extreme right side of this chart.
They see the decline and they shout from the rooftops “The dollar is dead. The dollar is going over an abyss. Death to the dollar!”
And then they come up with all kinds of conspiracy arguments and ridiculous fundamental explanations why the dollar must collapse (and along with it, the USA).
But now, you tell me. Look at the dollar since August 2011 and what do you see? A rather strong, steady uptrend that broke through the top of an uptrend channel in October 2015 …
Then consolidated near the highs with some swings back and forth … and is now merely pulling back to re-test the upper support line of a rising trend channel.
Sorry all you dollar bashers: My 5-year-old son can interpret this chart better than you can.

Now let’s take the analysis a few giant steps forward and run my AI neural net on the dollar, calculating billions of price data points to discern hidden cycles and make a high probability forecast into the future.
Here is the chart. And what does it tell you?
That the dollar is on the cusp of a new, and powerful leg higher, one that could start any day.
That’s just two markets that serve my point: Markets are never what they seem they are, not on the surface. And if you let those surface impressions fool you, not only will you most likely lose treasure troves of money …
You’ll miss out on the really big moves when they do come.
Best wishes,
Larry
P.S. To help you get ready to take full advantage of the bull market of a lifetime, I want to send you a complete Dow 31,000 Preparedness Kit — five distinct free reports! The first free report spells out step-by-step what you must do now to position yourself for amazing profits (and protection) over the next two years. Click here to download now!

Larry Edelson, one of the world’s foremost experts on gold and precious metals, is the editor of Real Wealth Report and Supercycle Trader.
Larry has called the ups and downs in the gold market time and again. As a result, he is often called upon by the media for his investing views. Larry has been featured on Bloomberg, Reuters and CNBC as well as The New York Times and New York Sun.

 Originally posted at MarctoMarket.com
The weekend meeting between many OPEC and non-OPEC producers has helped spur the recent gains in the price of oil. We are concerned that market may be getting ahead of itself.
First, the freeze in output that had previously been agreed to by Russia, Saudi Arabia, and a few other countries was conditional on participation by Iran. We have consistently been suspicious of this condition. Iran has sacrificed or at least delayed its nuclear development in exchange for the lifting of the embargo. If it were to agree to limit its output, it would have made the concessions for nothing. This cannot be politically acceptable.
Our reading is that Saudi Arabia was cognizant of this, but providing the condition did a couple of things for it. It deflected the blame for low oil prices away from it and toward its rival Iran. It also pushed a wedge between Iran and Russia.
Second, for many producers, a freeze is not really a concession. Many producers are operating near capacity. They have stepped up output to make up for the lower price. This is a rational strategy under some conditions.
Third, there was an unintended disruption in supply in Iraq and Nigeria which is being resolved. Iraqi output reportedly rose 2% in March. Reports indicate that Saudi Arabia and Russia also increased their output ahead of the tentative freeze agreement in February and afterward. This too seems to be a rational strategy under certain conditions.
Fourth, some OPEC countries are looking to expand capacity. Kuwait, for example, reportedly will soon seek assistance to access undersea oil reserves for the first time. Projections suggest it would boost capacity by 5% or more.
Hear Jim Puplava’s Big Picture: Oil – The Bottom, The Recovery, The Shock
Earlier today, OPEC projected a greater decline in non-OPEC output than it did last month. It now assumes that non-OPEC output would fall by 730k barrels a day this year. This is about a 5% larger drop than projected in March. In addition to the decline in US output, it is also anticipating a further drop in Chinese output as some fields mature. OPEC is also expecting a larger drop in UK output. There are reportedly many fields in Russia that are also maturing and cuts in investment are preventing their replacement.
Separately, we note that China imported a record amount of oil in Q1 2016. Over the past few years, China has built substantial refining capacity, drawn by the wide margins. There are some indications that as often is the case in China, it quickly developed over-capacity, which squeezes margins as its exports its surplus.
We suspect that many observers do not fully appreciate the tension between Saudi Arabia and Iran. The two OPEC countries are aggressively competing on a number of fronts, including but not limited to market share. Reports suggest each has taken action to undermine the other, including frustrating shipping efforts.
Also, we see many observers citing old breakeven levels for US shale producers. As far as we can tell, there is near constant technological improvement, and this has lowered the breakeven of some of the largest US producers toward $40 a barrel from $60 a barrel.
A freeze in output would take place at elevated levels. The EIA estimates that surplus is about 1.4 mln barrels a day this year. This is down from 1.59 mln from the previous estimate. The excess output next year is projected at 410k barrels, down from 640k. Our reading of the literature suggests many observers have underestimated the resilience of US output and how quickly it may return.
US crude inventories are still rising at about a 10% year-over-year rate. This is down from around 29% in the middle of last December, the peak in the cycle.
Open interest in the June light sweet crude oil futures contract has shifted to June from May. Yesterday the June contract rose through the March high near $43.20. Prices bottomed on the June contract on January 20 near $30.80. There has been a five-leg advance off the low. Today’s flat consolidation does not mean much, and there is potential toward $45. Beware of buy the rumor sell the fact.
Related podcast: Don Coxe Says Low Oil Prices Will Persist As Long As the Saudis Are Frightened of Iran

 Legendary investor, Jim Rogers on capital markets, US dollar positions, global currencies, the possible relationship between the US dollar and Chinese renminbi, the growth of the renminbi, and how some currencies would benefit from a rate hike.
The 36 minute interview shifts to the agricultural industry, including some comments on the organic food sector. The TPP and free trade agreements and the knowledge-based economy wrap things up.
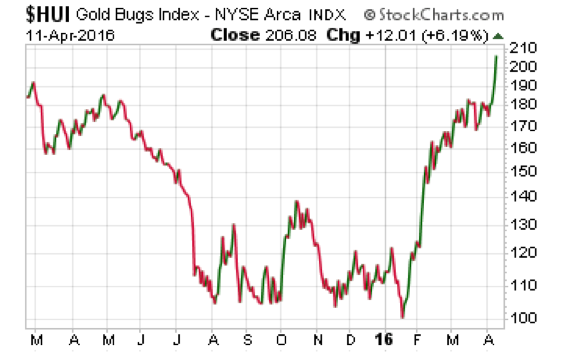
Spring has sprung for precious metals mining stocks.The HUI gold stocks index surged 6.2% on Monday to close at a 14-month high. The HUI chart shows a strong base was built from last summer through this January, and from that base a new bull market has begun. (For the April 13th chart look HERE – M/T Ed)
Industry major Barrick Gold (ABX) has seen its share price more than double year to date, leading precious metals mining equities as a group to become by far the top performing sector of 2016. As the bull market matures, we can expect leadership to switch from the majors to the mid-tier producers, then on down to the junior explorers.
Eventually, the stocks will get ahead of their underlying fundamentals, as is always the case in momentum-driven markets. Investors will then find greater value and stability in the physical metals. Physical precious metals will at some point take center stage and outperform the miners.
For now, the miners are taking the lead and blazing a path higher for the metals markets.Gold mining stocks often serve as a leading indicator for gold prices.
Of course, on any given day, the share prices of miners can move based on business or market peculiarities that are wholly unrelated to spot gold. But when gold equities trend upward in a significant way, as they have so far this year, we can infer that some big-money investors are betting on a big recovery in gold prices. It’s the gold price, after all, that is the biggest factor in most miners’ prospects for realizing profits.
But it would be a huge mistake for investors to treat gold/silver mining, streaming, and exploration companies as if they were proxies for the metals themselves. Physical precious metals are an entirely separate asset class. A gold or silver coin can’t go bankrupt. A mining company can go bust for any number of reasons – poor management, an environmental disaster, a credit crisis, etc. Money Metals columnist David Smith has detailed all the risks for our readers.
Historically, investors in mining companies have suffered through extreme booms and busts with little on net to show for the punishment they’ve endured.In fact, gold stocks have vastly underperformed gold spot prices over the past couple decades. Gold prices trade more than three times higher today than they did 20 years ago. Yet the HUI, despite its recent run up, actually trades slightly lower today than it did back in April 1996.
Let’s consider a recent 10-year period. From 2006 through the end of 2015 (10 full calendar years), gold gained 104%.Gold prices finished 2015 well below their 2011 highs.But if you bought in 2006, you still made money. If you bought a basket of gold stocks, in 2006, you lost money – most of it, in fact. From 2006 through 2015, the HUI shed a whopping 60% of its value. Ouch!
Those who bought gold stocks as a proxy for gold learned a tough lesson. During favorable up cycles for gold mining equities, they can potentially deliver outsized gains compared to gold itself. But during unfavorable periods, the downside for the stocks is much more severe than it is for the bullion.
Only the metal itself has a long-term track record of maintaining purchasing power.
Only precious metals in physical form are money.
Only gold, silver, and other hard assets serve as hedges against the risks inherent in the financial system.
That’s not to say that mining stocks don’t have a place in a diversified investment portfolio. They can certainly deliver big returns when market conditions are favorable.Some of the majors, such as Barrick, Goldcorp (GG), and Newmont (NEM), even pay small dividends.
But do you buy into mining stocks now, after a lot of these names have already doubled off their lows, given the sector’s track record of producing more disappointment than profits? It’s a question you as an investor will have to answer for yourself, taking into consideration your own objectives and risk tolerance.
If you’re looking for an undervalued investment that has similar upside potential as mining stocks but less downside risk, plus all the attributes of a tangible attributes of a hard asset, then consider physical silver.
The silver market appears to be gaining momentum, but spot prices remain well below their highs from last year.The gold:silver price ratio remains elevated at 79:1. As recently as 2011, gold sold for 32 times the price of silver, and historically it has often sold for 16 times or even as low as 10 times the silver price.
What will cause the spread between gold and silver to narrow? Most likely a big move upward in silver prices.The silver market opened this morning just above $16.00/oz, surpassing its high mark for the year.After being compressed for many months within a trading range, the silver market now sits like a coiled spring on the verge of breaking out.

Opportunities to buy major breakouts into new bull markets don’t come along often. If you regret missing the big rally this year in the miners, now’s your chance to catch the better part of what could be an equally impressive follow-up bull run in silver.

-
I know Mike is a very solid investor and respect his opinions very much. So if he says pay attention to this or that - I will.
~ Dale G.
-
I've started managing my own investments so view Michael's site as a one-stop shop from which to get information and perspectives.
~ Dave E.
-
Michael offers easy reading, honest, common sense information that anyone can use in a practical manner.
~ der_al.
-
A sane voice in a scrambled investment world.
~ Ed R.
Inside Edge Pro Contributors

Greg Weldon

Josef Schachter

Tyler Bollhorn

Ryan Irvine

Paul Beattie

Martin Straith

Patrick Ceresna

Mark Leibovit

James Thorne

Victor Adair