
Gold & Precious Metals

Signs Of The Times:
“Red Hot Housing” “U.S. Housing Giant Has Awakened”
– Financial Post, March 16
“Slovenia’s dollar-denominated benchmark bonds declined, pushing yields to the highest level this year as bailout risks increase.”
– Bloomberg, March 22
Now let’s see. “Dollar-denominated” Slovenian bonds means they are due and payable in U.S. funds. It seems that those taxpayers owe a stream of dollars. Does the buck start here?
“Unprecedented downgrades on two of Brazil’s biggest state banks are highlighting the risks faced by a government that is betting on a subsidized surge to reverse the slowest growth in a decade.”
– Bloomberg, March 22
“Bernanke Says Fed Policy Benefits World Economy”
– Bloomberg, March 25
“Lumber Enters Its Own ‘Super Cycle'”
– Financial Post, March 27
*****
Perspective
There is a noticeable contrast between discouraging news reports from Europe and enthusiasms in financial assets. The former seems to be defying massive “stimulation” and, of course, the latter is the result of massive stimulation. Markets have their own way of allocating the credit. That’s one of the problems with interventionist economics. The market decides where that action will be as well has how long it will run.
It also decides when to get impetuous. This is being matched by policymakers in aggressively buying bonds of doubtful quality. This is in the face of endless supply from essentially insolvent governments.
Yes, the housing market has been strong, but this is part of the first business expansion out of a Classic Crash. And there are mounting signs that the global expansion is getting tired.
Stock Markets
Stock market action has been very engaging in accomplishing momentum and sentiment numbers usually seen at important highs. Our theme has been that a big rounding top is building. This will end the bull market that began as the panic ended in March 2009.
On that bottom our Gold/Commodities Index turned down on February 20th and anticipated the beginning of the bull on March 10th. This indicator has turned up, which was a warning and last week it rose above the previous high. With that, financial markets could top within a couple of weeks.
Backing this up was the impetuous run in the Dow of 10 consecutive days. In the fourth year of a bull market this can lead the high by a few weeks.
This counts out to around this week.
There could be some volatility with the turn.
Monday’s action recorded a number of Negative Outside Reversals. These included the senior NYSE indexes, Transports, Forestry, Real Estate and the VIX. Financials such as Banks (BKX), Brokers (XBD), Junk (JNK) and Municipals (MUB) reversed.
And over in the opposite direction, the long bond (TLT) and the dollar (USD) reversed – up. Of special interest the Spanish Ten-Year also did the big reversal to rising yields. Such reversals may not end a move, but after such strong thrust they are a sign of instability. We would continue to sell the rallies.
Credit Markets
We have been using the Spanish Ten-Year note as a proxy for the “better” side of the Euro bond market. The decline in yield started at 7.50% set in last summer’s distress that most of Europe was insolvent.
Europe is still insolvent, but with “insider” buying the Spanish has declined. The low was 4.70% on March 12 and the initial rise was to 5.04%.
Yesterday the yield had increased to 5.08%, setting a near-term uptrend.
This represents the more widely traded Euro bonds. Lesser issues have not done as well. As reported above, the yield for Slovenia bonds has reached a new high for the year.
Over in another sector, the Emerging Market Bond Fund (EMB) took out key support two weeks ago. It has set new lows for the move this week. As with Slovenia, Emerging Debt yields are making new highs for the year.
Recklessness in credit spreads at this time of year can hit the wall on the seasonal turn to widening often recorded in late spring. Last year on the way to disaster, the Spanish bond yield broke out of a key low in early April. That break out was at 5.35 percent.
While the crowd is still “reaching for yield”, we would continue to get out.
Commodities
The highs reached with last summer’s drought have been followed by a long dreary decline. The high on the GKX was 533 and a double bottom seems to have been set at 433 in late February and early March. Then a crop report trashed corn, soybeans and wheat. The index (GKX) was down 4.25% to support at 433.
Base metal prices (GYX) rallied from 360 in November to a double top at 404 in early January and early February. Despite considerable enthusiasm metals could not break to new highs for the year. Indeed, could not get to the 427 high of 2012.
A developing rally became vulnerable to Cyprus concerns, and the decline is finding support at 360. There is still some time for seasonal firming, but it would be minor.
Base metal mining stocks (SPTMN) have a tendency to lead important changes in metal prices. Stocks rallied from 895 in November to 1050 at the end of December. It tried to hold support at 875, but vulnerable to Cyprus dropped to 860 – a new low for the move. A relief rally is possible and it should be sold.
The big high was 1600 in February 2011. That was the speculative surge indicated by our Momentum Peak Forecaster. It was calling for a cyclical peak in base metals at that time. At 875 now, if the SPTMN takes out the 780 level it would confirm a cyclical bear market.
Crude oil prices reached resistance at 94 and backed off to 91.87. Then it became responsive to Middle East and Cyprus concerns and in four days jumped to almost 97. There is resistance at the 98 level.
We noted a few weeks ago that crude, as with base metals, was moderately oversold on the Daily and neutral on the Weekly. It is not yet overbought, daily, and we are moving into a favourable season that could run into May.
Currencies
The US dollar continues to be the great arbiter of gloom or zoom.
The DX ran into resistance at the 83 level and backed off a little. The excitement about Cyprus rallied it from 82.1 to 83.2, from where a consolidation is due.
This could continue for a few weeks but we are keeping in mind that each setback to overly ambitious policymakers will turn the dollar up.
It is worth emphasizing that the report about the Slovenia bond included that it is payable in US funds.
Precious Metals
We like to title this sector as “Gold and Silver” at important tops. Then at important lows head the sector up with “Precious Metals”. Recently, these metals may have been condemned with expletives deleted.
With an eye to the way financial history works, they will soon be heading to “Precious”.
The main reason is that in a post-bubble contraction the gold sector goes up as most orthodox investments go down. For decades gold bugs have considered that the Fed will be non-stop in its dollar depreciation and gold stocks will soar, almost without interruption. This does not work in a world of post-bubble credit deflation.
Some years ago we would review that in such a contraction gold could go up in dollar terms as the dollar was firmer. This was roundly condemned.
However, since September golds have been clearly acting opposite to the action in orthodox investments (OI). This suggests that on the next leg down for “OI” the precious metal sector could go up, as was the case generally through the 1930s.
Once this is developed enough there could be times when gold could rally as the US dollar is firm. It has to do with frightened money going to the most liquid items. Treasury bills in the senior currency and gold. Ross has the chart prepared for when that action starts.
In the meantime we would continue to buy on the down days.
Over the past couple of months we have not said much about the gold/silver ratio (GSR). After its RSI got oversold the ratio has been in a narrow trading range.
However, with the Cyprus raid on depositors the ratio has become volatile. This often leads important changes in the credit markets and when it does go up it anticipates trouble.
With last summer’s panic in Euro debt, the GSR rose above the key level of 56 in that fateful May. The high as the panic was at its worst was 59.6. This indicator is usually reliable and it popped up to 56.6 yesterday morning. Rising above this level would signal another phase of overall liquidity concerns.
Doing it in May would have a sense of de je vu, again.
*****
Bob will be speaking to the Annual Spring Meeting of the Committee for Monetary Research & Education in New York, May 23, 2013. Following is a link that shows the preliminary meeting agenda:
Link to January 12, 2013 ‘Bob and Phil Show’ on TalkDigitalNetwork.com:
http://talkdigitalnetwork.com/2013/03/wheat-gets-shredded/
BOB HOYE, INSTITUTIONAL ADVISORS
E-MAIL bhoye.institutionaladvisors@telus.net
WEBSITE: www.institutionaladvisors.com

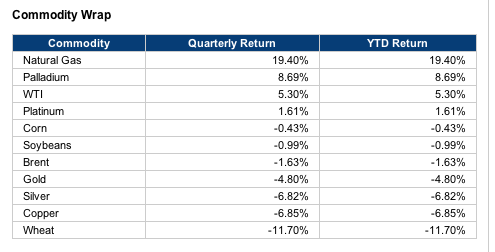
We examine the latest developments in commodity markets.
Commodities saw notably divergent performance during the first quarter of the year. Natural gas, palladium and WTI performed particularly well, while gold, silver, copper, and wheat tumbled. Stocks, as measured by the S&P 500, advanced an impressive 9.7 percent in the period.
Macroeconomic Highlights
The quarter was a strong one from the perspective of investor appetite for risk. Catapulted by the resolution of the U.S. “fiscal cliff” at the start of the year, stocks climbed steadily throughout the period. Though the “sequester,” or $85 billion worth of automatic government spending cuts, went into effect, it did little to derail the rally. With political intransigence no longer an issue, investors were able to focus on the emerging strength in the U.S. economy.
The data have been unquestionably bullish. Housing indicators for sales, construction and prices are at the highest levels since 2008 or 2009, while the unemployment rate is similarly at the lowest level in four years.
At the same time, the Federal Reserve has maintained its ultra-loose monetary policies, pledging to continue its $85 billion worth of monthly bond purchases until the unemployment rate falls even further.
But while the U.S. has been a bright spot in the global economy, elsewhere, things aren’t as rosy. China’s growth remains rather tepid, with expectations that the Asian giant will grow somewhere in the range of 7.5 to 8 percent this year. That has dampened demand growth for commodities such as copper, oil and soybeans and is likely why prices suffered thus far this year.
Europe is also a drag. The banking crisis in Cyprus is just the latest indication that the eurozone is not out of the woods when it comes to its debt problems. While far from the record levels set in 2011, Italian and Spanish bond yields are relatively high near 5 percent, suggesting that markets remain concerned about the debt burden in those countries.
…….read page 2,3,4,5 or Full Article
With a scary bank crisis in Cyprus driving the headlines a couple of weeks ago, gold could barely muster a rally. Notice in the chart below that the high of the move failed to clear a minor peak at 1619.70. Had it done so, we would have given bulls a fighting chance, since it would have created a bullish “impulse leg” with the potential to power quotes as much as $120 higher in just a few weeks. Instead, buyers showed themselves to be gutless, allowing the April contract to relapse down to within inches of the lower trendline. It could hold, but we doubt it.
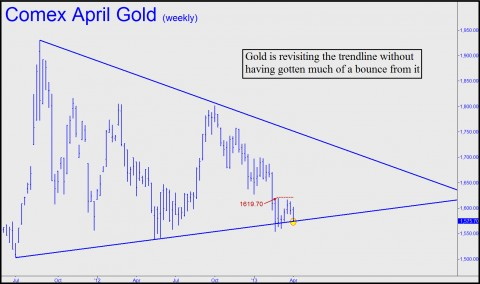
Still worse is that a breakdown is likely to send the futures down to at least 1553.50, a Hidden Pivot support identified here a couple of weeks ago when the futures were trading above 1600. If that “hidden” support should fail as well, look out below, since the next stop would be a more important one at 1487.00 that was flagged at the same time. That would represent a 5.5% fall from current levels, which would hardly be disastrous. But it would also turn a trendline that has provided support since July of 2011 into resistance, opening a path to significantly lower prices into autumn.
Three Scenarios
Because the trendline is so clear, it seems all but certain to be tested. It comes in at around 1570 this week, and you should expect it to be breached. Once that has occurred, things could play out in a few different ways. Most bullish of them would be a sharp rebound that vaults the 1619.70 peak by mid-April. That’s what we should expect to happen if the smart money is planning to shake out the weak sisters in order to run gold steeply higher without being burdened by nervous profit taking. But if gold proves unable to get serious loft within a week or two, be prepared for a downdraft to 1487.00. Another possibility is a tedious game of footsies on and around the trendline. Beware, however, if settlement occurs below the trendline for two consecutive weeks, since that would imply distribution.
Because the long-term trend in gold is bullish, we should be willing to give it the benefit of the doubt under any circumstances. Technically speaking, it would take an “impulsive” rally on the hourly chart to turn us bullish again. At present, that would imply a swift thrust hitting 1612.90 within three or four days of any fleeting dip below the trendline. We’d lay three-to-one odds against it at the moment, but stranger things have happened.

-
I know Mike is a very solid investor and respect his opinions very much. So if he says pay attention to this or that - I will.
~ Dale G.
-
I've started managing my own investments so view Michael's site as a one-stop shop from which to get information and perspectives.
~ Dave E.
-
Michael offers easy reading, honest, common sense information that anyone can use in a practical manner.
~ der_al.
-
A sane voice in a scrambled investment world.
~ Ed R.
Inside Edge Pro Contributors

Greg Weldon

Josef Schachter

Tyler Bollhorn

Ryan Irvine

Paul Beattie

Martin Straith

Patrick Ceresna

Mark Leibovit

James Thorne

Victor Adair