May 17th- 2013- Article by David Banister, Chief Strategist www.TheMarketTrendForecast.com
I used to half joke with some of my investing friends that the best time to buy stocks is during or right after a crash. Think 1987, 2000-2002, 2008-09, and now perhaps Gold Miners?? Well, before we get too far ahead of ourselves, lets examine evidence of a “Crash”: I like to use crowd behavioral, empirical, and technical evidence in combination.
1. In a recent money managers poll, virtually nobody was bullish on Gold or Gold stocks, and over 80% of those polled were bullish on the SP 500 and US stocks.
2. The percentage of Dumb Money traders (non-reportable traders) in the futures markets with short positions on Gold is at all time highs, they tend to be very long at the highs and very short at the lows.
3. The insider buying ratio of Gold Mining stocks to sellers is running over 10 to 1, the highest since October 2008 when Gold bottomed out at $685 per ounce from $1030 highs. Quoting Ted Dixon, CEO of Ink Research, “such a high level of buying interest among officers and directors within their own businesses in the resource sector has correctly foreshadowed a recovery in share prices in the past: That high point of nearly five years ago came about six weeks before the Venture market bottomed on Dec. 5, 2008…While the excitement that surrounded mining stocks as recently as two years ago has waned, experienced value investors recognize that such periods of investor neglect often give rise to the best deals” Source: Theglobeandmail.com
4. The ratio of the HUI Gold Bugs Index to the SP 500 is at multi year lows and in near crash mode on the charts. The RSI Index (Relative strength) on the weekly charts is at 10 year lows at -13.71, which is off the charts low!!
5. Most trading message boards I view at Stocktwits and others are universally bearish on Gold and Gold stocks.
6. Gold is in a wave B or Wave 5 down re-testing the 1322 lows which we have discussed here for weeks as very likely if 1470 was not taken out on the upside… this is a normal sentiment pattern and re-test.
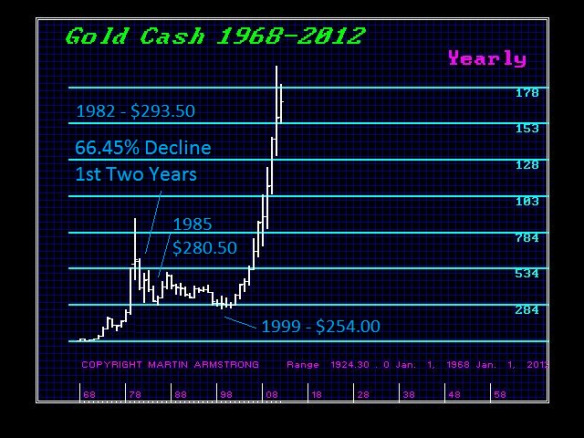
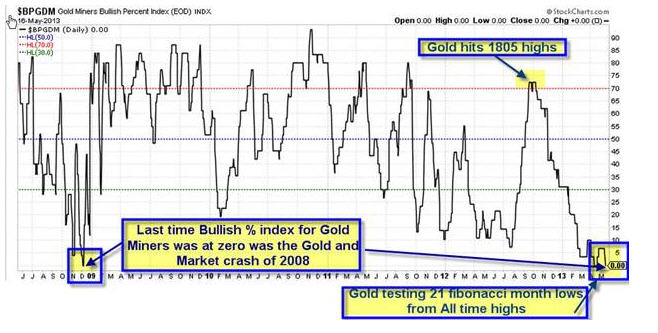
7. Gold has been in a 21 Fibonacci month correction pattern off a 34 Fibonacci month rally from 686-1923. In August of 2011 I penned articles from 1805 right up to 1900 warning of a massive wave 3 top forming. Everyone was bullish, now it’s the complete opposite.
8. Currency debasement continues around the world with negative real interest rates. This is bullish for Gold once this correction has run its course.
9. Hulbert Digest Gold Sentiment index is at an all time low (gold newsletters at -35 sentiment readings!!)
10. Gold -Silver put to call ratios are at all time highs
I could go on and on with headlines and such, but you get the idea. This is the same type of sentiment I wrote about on the stock market on Feb 25th 2009, here is that article... and nobody on the planet was bullish.
Below is a chart showing the Bullish % index for Gold Miners, as you can see the last time we were at 0% was late 2008 when Gold had bottomed out and insiders were also buying like crazy like now:
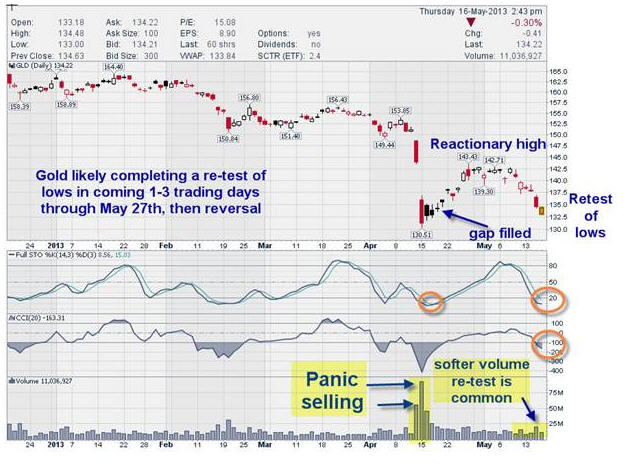
The GLD ETF chart also shows a likely re-test or slightly lower of the 1322 futures lows of April, when Insider buying hit 10 year record levels:
Obviously Gold could end up going a lot lower than we think, and the Gold Mining stocks could sink further yet. But for those with a 3-6 month horizon, we expect the 21-24 month Gold correction to complete by no later than October 2013. During the next several months the opportunities to buy some miners on the cheap will potentially make some investors a lot of money in the coming few years.
Join us at www.markettrendforecast.com for occasional free reports or sign up for our daily updates on the SP 500 and Precious Metals.
By David Banister