
Gold & Precious Metals

One of the most important pieces of data last week was Friday’s U.S. non-farm payrolls report. U.S. employers added 195,000 new jobs to their payrolls last month, exceeding expectations of 165,000, the Labor Department said on Friday, cementing expectations the Fed will start winding down its $85 billion monthly bond purchases.
It was a very bearish factor for gold which resulted in its fast decline. The yellow metal dropped to $1,208 per ounce on Friday.
“We’re predicting gold will continue to drop year after year roughly by $100 on average each year,” Michael Haigh, managing director at Societe Generale, told reporters at a briefing in Singapore. Haigh sees gold prices hovering around $1,200 toward the end of the year and falling further to an average of $1,150 in 2014. He also said that as prices fell below $1,200, some gold miners would start hedging, adding to the bearish momentum.
Is he right? Will gold revisit its June 28 low at $1,180.71 per ounce and then decline below this level? Will it trigger further declines in mining stocks? Let’s check what happened and what did not happen during the last several days and find out where the precious metals market is likely to move next.
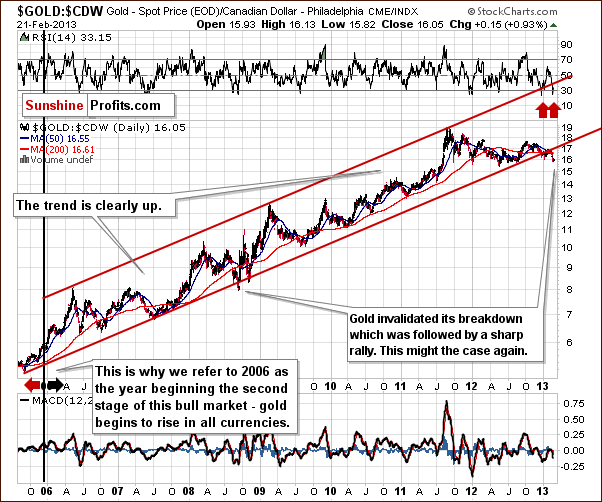
At the beginning let’s take a look at the long-term gold chart and check the current situation in gold (charts courtesy by http://stockcharts.com.).
Click on image or HERE for larger view

In recent days, the price of gold has been trading sideways below an important resistance line, the first Fibonacci retracement level, verifying the breakdown. With a verified breakdown and the declining trend channel in place, we still have a bearish outlook. The most important support level for gold is slightly below $1,100 where two major support lines intersect. These are the very long-term support lines and, at the same time, the 50% Fibonacci retracement level for the entire bull market.
Despite Friday’s data and a bearish outlook, Monday and Tuesday sessions were quite good for gold bulls and the yellow metal climbed up to over $1,260 per ounce. Today (at least at the moment these words are written) we also see a positive sentiment. Has gold already bottomed?
At times, gold stocks can tell a lot about the situation on the entire precious metals market. Let’s take a look at the gold stocks index – the HUI.
Click on image or HERE for larger view

In this week’s very long-term HUI index chart, we can see that not much changed last week and declines remain in place. The downtrend will continue as long as the index is below the 250 level. At this time, we should pay attention to Monday’s and Tuesday’s declines, which pushed the index below 220. From this point of view we may consider that the final bottom will probably form close to or slightly above the 2008 low as indicated by our red ellipse (which also includes the 61.8% Fibonacci retracement level).
Once we know the current situation in the most followed commodity stock indices, let’s take a look at the gold-stocks-to-gold ratio, which is one of the more interesting ratios there are on the precious metals market. After all, gold stocks used to lead gold both higher and lower for years.
The ratio moved lower last week, which has bearish implications.
As we wrote in our essay on gold, stocks and the dollar on June 26,2013:
“ the trading channel and the next horizontal support intersect at a point much lower than where this ratio is today. (…)The ratio might move to its target level – the 2000 low – close to the 0.135 level, which is a quite clear forecast as far as direction of the next move is concerned.”
From this perspective the downtrend remains in place here and we haven’t seen any significant bullish indications.
Our final chart today is the short-term GDX ETF, which confirms the bearish outlook.
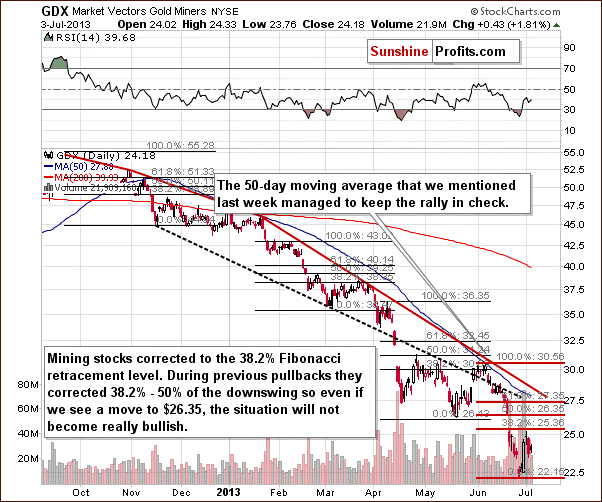
In this chart, we see that the pullback at the end of June was only to the first Fibonacci retracement level. Prices are quite close to this level now and at times approached the 50% level. With this tendency in place, a bigger move lower is still probable even though we could see some very-short-term strength first. As long as GDX remains below $26.35, the downtrend will remain in place. Perhaps the next move to the downside will be the final one.
Summing up, the recent move higher in gold has not been validated yet, and the outlook remains bearish. The charts of gold suggest that the recent rally is nothing more than a pullback. Gold stocks declined despite a rally in gold and the general stock market. These declines in mining stocks are bearish signs for the entire precious metals market for the coming weeks. Naturally, gold and gold stocks don’t have to move as low as described on the above charts – there is a specific price level at which it might be a good idea to open a long position in gold even before these downside targets are reached.

 The New York Times had the definitive take on the vicious sell off in gold. To summarize one of their articles:
Two years ago gold bugs ran wild as the price of gold rose nearly six times. But since cresting two years ago it has steadily declined, almost by half, putting the gold bugs in flight. The most recent advisory from a leading Wall Street firm suggests that the price will continue to drift downward, and may ultimately settle 40% below current levels.
The rout says a lot about consumer confidence in the worldwide recovery. The sharply reduced rates of inflation combined with resurgence of other, more economically productive investments, such as stocks, real estate and bank savings have combined to eliminate gold’s allure.
Although the American economy has reduced its rapid rate of recovery, it is still on a firm expansionary course. The fear that dominated two years ago has largely vanished, replaced by a recovery that has turned the gold speculators’ dreams into a nightmare.
This analysis provides a good representation of the current conventional wisdom. The only twist here is that the article from which this summary is derived appeared in the August 29, 1976 edition of The New York Times. At that time gold was preparing to embark on a historic rally that would push it up more than 700% a little over three years later. Is it possible that history is about to repeat itself?
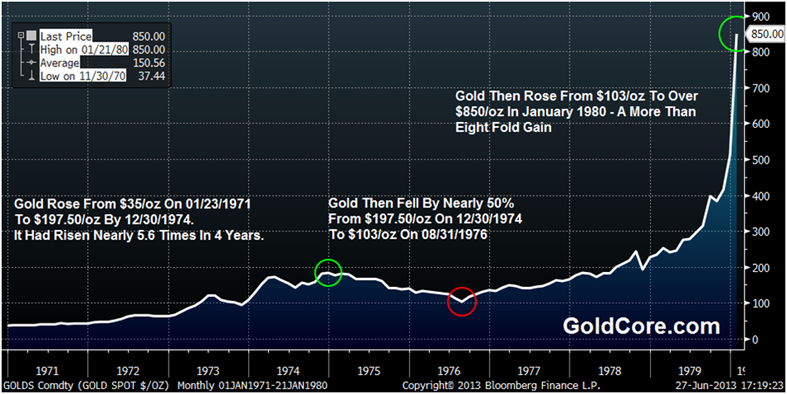
At the time The Times article was written, gold had fallen to $103 per ounce, a decline of nearly 50% from the roughly $200 it had sold for in the closing days of 1974. The $200 price had capped a furious three-year rally that began in August of 1971 when President Nixon “temporarily” closed the gold window and allowed gold to float freely. Prior to that decision gold had been fixed at $35 per ounce for nearly two generations. That initial three year 450% rally had validated the forecasts of the “gold bugs” who had predicted a rapid rise in gold prices should the dollar’s link to gold be severed. The accuracy of these formerly marginalized analysts proved to be a bitter pill for the mainstream voices in Washington and Wall Street who, for reasons of power, politics and profit, were anxious to confine the “barbarous relic” to the dustbin of history. Incredulous as it may seem now, with gold still priced at $35 per ounce, official forecasts of both the Secretary of the Treasury and the Chairman of the Federal Reserve were that demonetizing gold would undermine its value, and that its price would actually fall as a result.
Of course government experts could not have been more wrong. Once uncoupled from the dollar, gold’s initial ascent in the early 1970s was fueled by the highest inflation in generations and the deteriorating health of the U.S. economy that had been ravaged by the “guns and butter” policies of the 1960s. But the American economy stabilized during the mid-years of the 1970s and both inflation and unemployment fell. When gold reversed course in 1975 the voices of traditional power elite could not contain their glee. When the gold price approached $100 per ounce, a nearly 50% decline, the obituaries came fast and furious. Everyone assumed that the gold mania would never return.
Although the writer of The Times piece did not yet know it, the bottom for gold had been established four days before his article was published. Few realized at the time that the real economic pain of the 1970s had (to paraphrase The Carpenters 1970s hit) “Only Just Begun.” When inflation and recession came back with a vengeance in the late 1970s, gold took off (to quote another 1970s gem), like a skyrocket in flight. By January 1980, gold topped out at $850 an ounce. The second leg of the rally proved to be bigger than the first.
The parallel between the 1970s and the current period are even more striking when you look closely at the numbers. For example, from 1971 to 1974 gold prices rose by 458% from $35 to $195.25, which was then followed by a two-year correction of nearly 50%. This reduced total gains to just under 200%. The current bull market that began back in 2000 took a bit longer to evolve, but the percentage gains are very similar. (We should allow for a more compressed time frame in the 1970s because of the sudden untethering of gold after decades of restraint.) From its 1999 low to its 2011 peak, gold rose by about 650% from $253 to $1,895 per ounce, followed by a two year correction of approximately 37%, down to around $1,190 per ounce. The pullback has reduced the total rally to about 370%. The mainstream is saying now, as they did then, that the pullback has invalidated fears that rising U. S. budget deficits, overly accommodative monetary policy, and a weakening economy will combine to bring down the dollar and ignite inflation. But 1976 was not the end of the game. In all likelihood, 2013 will not be either.
The biggest difference between then and now is that until 1975 ordinary Americans were barred by law from buying and owning gold. About the only route available to participate in the earlier stage of the precious metal rally was by hording silver dimes, quarters and half dollars minted prior to 1965. My father indulged in this process himself by sifting through his change, the cash registers of any merchant who would allow him (exchanging new non-silver coins and bills for silver), and by sifting out silver coins from rolls he bought from banks. It was a time-consuming process, and most of his friends and family members thought he was crazy. After all, he had $10,000 worth of pocket change earning no interest. But the $10,000 face value worth of those coins he collected had a melt value of over $350,000 when silver hit its peak.
By the mid-1970s none of the problems that initially led to the recession in the early years of the decade had been solved. Contrary to the claims of the “experts” things got much worse in the years ahead. It took the much deeper recession of the late 1970s and early 1980s, which at the time was the worst economic down-turn since the great Depression, to finally purge the economy of all the excesses. The lower marginal tax rates and cuts in regulation implemented by President Reagan and tight money under Volcker helped get the economy back on track and create investment opportunities that drew money away from gold. As a result gold fell hard during the early 1980s. But even after the declines, gold maintained levels for the next 20 years that were three to four times as high as the 1976 lows.
Although the economy improved in the 1980s, the cure was not complete. Government spending, budget and trade deficits continued to take a heavy toll. The U.S. was transformed from the world’s largest creditor to its largest debtor. When the time came to face the music in 2001, the Fed kept the party going by opening the monetary spigots. Then when decades of monetary excess finally came to a head in 2008, the Fed open up its monetary spigots even wider, flooding the economy with even more cheap money.
Unfortunately just like 1976, a true economic recovery is not just around the corner. More likely we are in the eye of an economic storm that will blow much harder than the stagflation winds of the Jimmy Carter years. And once again the establishment is using the decline it the price of gold to validate its misguided policies and discredit its critics. But none of the problems that led me and other modern day gold bugs to buy gold ten years ago have been solved. In fact, monetary and fiscal policies have actually made them much worse. The sad truth is that as bad as things were back in 1976, they are much worse now. Whether as a nation we will be able to rise to the occasion, and actually finish the job that Ronald Reagan and Paul Volcker started remains to be seen. But I am confident that the price of gold will rise much higher, and that its final ascent will be that much more spectacular the longer we continue on our current policy path. Don’t believe the mainstream. Just as before, they will likely be wrong again.
About the Author
Peter Schiff is CEO of Euro Pacific Precious Metal and an internationally recognized economist specializing in the foreign equity, currency and gold markets. Schiff made his name as president and chief global strategist of Euro Pacific Capital. He frequently delivers lectures at major economic and investment conferences, and is quoted often in the print media. His broadcast credits include regular guest appearances on CNBC, Fox Business, CNN, MSNBC, and Fox News Channel, as well as hosting his own weekly radio show, Wall Street Unspun. He is also the author of the bestselling books: “Crash Proof,” “The Little Book of Bull Moves in Bear Markets,” and the recently released: “Crash Proof 2.0: How to Profit from the Economic Collapse.”
‘Bear Raid’ with SPDR Gold Sales
After all the fall in the gold price was hard and fast due entirely to the bear raid in the U.S. This started in mid-April after the sales from the SPDR gold ETF had begun more than a month ahead of that. The signal for the bear raid was given when Goldman Sachs issued a recommendation to their clients to go ‘short’ of gold. The fall was very dramatic and shook the gold world to its roots. The volumes of physical gold that were sold were enormous. Even the Central Bank Gold Agreement limitations on gold sales (when they occurred, pre-2009) were held at 4 – 500 tonnes a year. These sales took place over three months, with the 500 tonne bear raid happening in one week.
- COMEX warehouse reductions [200 tonnes]
- Banks plus hedge funds sales [at over 300 tonnes]
- Plus the heavy sales of gold from the SPDR gold ETF [at over 500 tonnes]
We estimate total U.S. gold sales at over 1,000 tonnes over the last four months. This saw prices fall from the upper $1,600 to $1,200 recently. This gold was bought up primarily by countries east of Greece through to China.
Reaction
It would be extremely naïve of any investor to believe that the current gold prices are now set in stone. As the low prices in the $1,200 region were reached, physical demand was very high, globally, but particularly from Asia. These have petered out as low prices have persisted, but buyers are now in the wings waiting for a ‘floor’ price to be established first.
But the fall in the gold price changed the entire dynamics of the gold market.
Before we give you these figures we will explain just how we have to distort the numbers to make them fit the impact of falling supply. To this end, we have gone against the obvious impact of lower prices and reduced demand in sectors where we know demand is bound to rise. Here’s our thinking behind the squeezing of demand into prospective supply. We do this to highlight how a tremendous price rise is needed to resuscitate newly-mined gold volumes and to distill evaporated recycled gold.
Supply
Newly-mined Gold
The falling gold price is hitting the mining equity sector extremely hard at the moment, but this will reinforce our view that the fall in the gold price is temporary.
The decision by Newcrest Mining Ltd. (NCM), Australia’s biggest producer, to write down the value of its mines by as much as A$6 billion ($5.5 billion), will lead to the biggest one-time charge in gold mining history. Rivals such as Barrick Gold Corp. (ABX), the biggest producer, and Newmont Mining Corp. (NEM) are expected to be next.
The unfortunate ‘Junior’ sector of gold mining is being savaged, with projects cancelled, mines going bust, but those able to survive for the rest of this year falling in price to levels that we believe will be absolute bargains in the months and years to come. Once the reality of the price falls feeds through to supply and demand numbers, we see share prices recovering very strongly. But today’s reality was well expressed by Nick Holland, CEO of Gold Fields, in South Africa.
He said, “There’s going to be significant rationalizing in the gold industry. You can’t keep mines producing if they’re losing money. Gold Fields South Deep mine in South Africa is one of the few mines that could survive at the current gold price of 1,230 an ounce. The mine’s size [57 million ounces of gold at 3 kilometers and deeper] and the fact that it’s largely mechanized, meaning it’s less reliant on labor demanding pay rises, will help keep costs low.”
But he was definitive when he said that,
“Bullion must rise to $1,500 an ounce for the gold mining industry to be sustainable. The industry is not sustainable at $1,230 an ounce, which is where the gold price is at the moment [now falling through $1,200]. We’re going to need at least $1,500 an ounce to sustain this industry in any reasonable form.”
To illustrate what we mean, we note that 25% of gold mining companies are ‘underwater’ at $1,400. We expect this number to rise to over 50% at $1,200? Those who do survive will follow Newcrest and the rest of the large companies and cut their reserves and raise their grades to levels that make the mines profitable at these prices. The implication is that the supply of newly-mined gold could actually halve to 1,400 tonnes per annum? But for the sake of conservatism we only drop supply by 800 tonnes to 2,000 tonnes.
Recycled Gold
The balance of supply comes from sellers of gold, whose sales are evaporating at prices below $1,500. At 1,700 tonnes, scrap sales projected with prices around $1,650, we again underestimate the impact of $1,200 prices and give an optimistic figure of 1,000 tonnes going forward annually. This should leave total annual supply of gold at 2,400 from the projected 4,500 tonnes? But optimistically we hold it at 3,000 tonnes.
What are these? We base our figures on the World Gold Council’s estimated figures for 2013 and adjust them in the light of the above events.
Demand
Jewelry: On the demand side, for the sake of this exercise, let’s ignore the reality that jewelry demand would soar at these low prices, $1,200 or less per ounce and actually reduce jewelry demand to 1,500 tonnes, down from the projected demand at $1,650 an ounce of 1,900 tonnes. The reality is that we expect several hundred tonnes more jewelry demand at prices of $1,200 an ounce.
Technology: Let’s leave the price insensitive Technology demand unchanged at 430 tonnes.
Official sector: Likewise “official sector” demand we leave at slightly lower levels of down from our projected level of 600 tonnes at 500 tonnes.
Total bar & coin: Which has risen strongly this year to date, we reduce (wrongly) to 800 tonnes down from the projected 1300 tonnes.
Gold ETF demand: We reduce to zero down from the projected 425 tonnes.
Thus total demand for the next year unrealistically, pessimistic –allowing for ‘over-the-counter stock flows—at 3,050 tonnes. As you can see we have to cut demandunrealistically low to match the likely fall in supply to permit gold prices to stay anywhere near today’s levels.

Hopefully, this is very useful to you subscribers because it paints a graphic picture of current gold market fundamentals. We’ve heard from many expert analysts, whose reputation we respect, but we see them as being very wrong-footed on their views that they see a multi-year bear market for gold. We see them as making a mistake on two areas:
1. Demand/supply numbers will prevent this from happening as it implies a huge shrinkage in both.
2. The price fall has been entirely a U.S. sales phenomenon, which is finite. Either the U.S. will remain out of the market going forward or will have to add to the demand figures we have described above. If they add, then gold price estimates will have to be raised significantly.
As investors, you must ask yourselves: At what price can demand be made to reduce to the levels we portray above and at what price will recycled gold supplies rise to cap the gold price and satisfy demand?
So when Nick Holland says prices of $1,500 are needed to sustain the gold mining industry, we think he is right. Please note that he is referring not just to cash costs per ounce produced, but cash costs, plus exploration costs, plus development costs, plus sufficient profit to distribute to shareholders to keep them investing. Cash costs at $1,200 are not the costs that make gold mining sustainable. $1,500 is far closer to the mark of real costs per ounce.
Consequently, when supplies are likely to drop to a level that even the most pessimistic demand levels are not met, we have to be close to a turn in the gold price. We attach an historic gold price chart going back to the early seventies to show the stark reality of what can happen after gold prices were held at unrealistically low levels (thanks to GoldCore.com).
Hold your gold in such a way that governments and banks can’t seize it!
Enquire @ admin@StockbridgeMgMt.com
Get it First. Subscribe @
——————–
3 – Month Trial : $99 – SPECIAL (limited time offer!)
1 – Year: $349 (less than $7 a week!)
All 1-year subscribers will receive a complimentary 2005 one-ounce silver eagle.
6 – Months: $189 (less than $8 a week)
All major forms of payment accepted. Contact us to pay using a non-listed payment method.
Call Toll Free: 1-866-447-8219
Traders stampeded out of gold, emerging markets and bonds this month, setting record monthly outflows in June. Ever since the Federal Reserve hinted in May that signs of a stronger economy could allow for a slowdown of stimulus, markets have protested the news.
Gold has been hit hard by the tapering talk and resultant rising interest rates and liquidity drain, falling below $1,200 at the end of June for the first time since August 2010. We’re also seeing India, the world’s biggest gold buyer, trying to stifle gold demand. As the government seeks to reduce its record current account deficit, it has hiked import tariffs on gold to 8% and introduced new constraints on rural lending against gold jewelry and coins. Ross Norman, CEO of bullion broker Sharps Pixley, said, “It’s almost as if the finance ministry is waging war on the gold sector, which would suggest that they feel they have lost control of the economy to some extent. In that environment, you would want to own gold more than ever.”
Other factors fueling the liquidation were the raising of margin requirements on gold by the CME Group, the largest operator of futures exchanges in the U.S., and global liquidity concerns in the U.S. and China. When the country with the largest GDP in the world and the country with the largest population on Earth have liquidity concerns, traders run from stocks, bonds and gold and head to cash. Even though gold traders have pulled out of their financial investments, there has been a surge in physical gold buying and central bankers have maintained their positions.
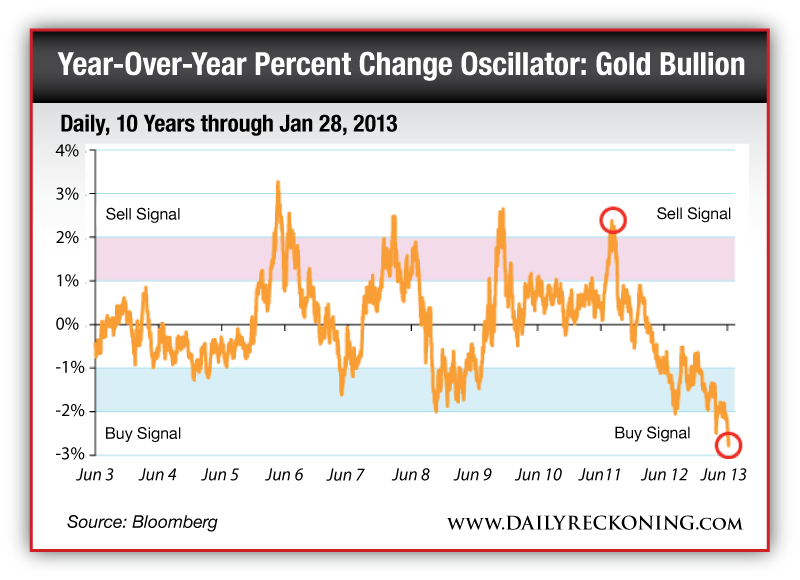
We maintain that gold is in extremely oversold territory and mathematically due for a reversal toward the mean. Yet when gold prices plummet, fear takes over and some investors forget the fundamental reasons to own gold: Gold is a portfolio diversifier and a store of value. It is a finite resource with increasing global demand. I co-authored a book on gold five years ago based on a lifetime of experience with the metal. My advice hasn’t changed since then. When it comes to gold, moderation is key. Don’t try to get rich with gold, because the corresponding risk is simply too high. Limit your exposure to gold as an asset class to 10% of your portfolio — no more than 5% in bullion and 5% in equities. Rebalance each year to keep that level of exposure and use volatility to your advantage.
There seems to be an inherent emotional bias against gold by many in the financial media and among money managers, especially after gold corrects. Billions of dollars lost in gold make for sensational headlines, yet two darling technology stocks have also taken it on the chin. I find it interesting that the naysayers aren’t talking about the fact that Facebook and Apple have caused more destruction in market capitalization over the past year than the biggest gold ETF. The chart below puts the magnitude of decline in context.

Why is it that gold still struggles for acceptance as a permanent asset class? I, too, enjoy catching up with Facebook friends on my iPad, but I have more faith that millions of people in Asia and the Middle East will continue to adore the precious metal long after the novelty of Facebook and iPads wears off.
In many parts of the world, this deep cultural affinity for gold is expressed through the giving of gold coins and jewelry for momentous occasions. Gold will soon be entering its historical period of seasonal strength with Ramadan beginning in July, followed by the Indian Festival of Lights, wedding season and Christmas. We have often published on the impact of this powerful seasonal pattern.

In addition to spooking the gold market, the likelihood of the Fed ending its easing also had investors fleeing fixed income investments. Rising interest rates and falling prices led to June bond fund outflows shattering the previous record set in October 2008. Yet downward revisions of economic data suggested that while the economy may be steadily improving, there aren’t yet signs of spectacular growth. In response, bond yields retreated by the end of last week. We see the exodus as an entry point for investors who may have been nervous about getting into the bond market.
Fed fears reached far and wide as emerging market equities also experienced record outflows this month as the sell-off extended to Latin America, Europe and Asia. Renewed worries over Chinese growth and concerns with tightening financial conditions accelerated the flight from emerging markets. Money that had been made in recently hot markets was pulled out, further drying up liquidity. We continue to see opportunity in emerging markets, where we seek out undervalued dividend-paying companies with growth prospects.
From time to time, in bull and bear markets, prices and fundamentals disconnect. Prices can swing too far on fear and rise too fast on greed. We believe fundamentals remain solid and much of the short-term swings are much ado about nothing. In volatile markets, it is important to trust your investment processes and asset allocation disciplines.
Regards,
Frank Holmes
Ed. Note: As Frank Holmes points out, China loves the Midas metal. They’ve even got gold vending machines, for crying out loud!
But you can actually profit from China’s golden greed…
Our resident resource expert just relayed a shocking story that shows just how far China’s willing to go to get its hands on the yellow metal — and how you can make tons of money because of it. Click here to discover this incredible story and its strong implications for the future of your wealth.
About Frank Holmes
Frank Holmes is chief executive officer and chief investment officer of U.S. Global Investors Inc.

-
I know Mike is a very solid investor and respect his opinions very much. So if he says pay attention to this or that - I will.
~ Dale G.
-
I've started managing my own investments so view Michael's site as a one-stop shop from which to get information and perspectives.
~ Dave E.
-
Michael offers easy reading, honest, common sense information that anyone can use in a practical manner.
~ der_al.
-
A sane voice in a scrambled investment world.
~ Ed R.
Inside Edge Pro Contributors

Greg Weldon

Josef Schachter

Tyler Bollhorn

Ryan Irvine

Paul Beattie

Martin Straith

Patrick Ceresna

Mark Leibovit

James Thorne

Victor Adair