
Gold & Precious Metals
Background
Let me start by stating that I am a gold and silver bull and that the precious metals sector has been very good to me. However, any stock or commodity doesn’t not go up or down in a straight uninterrupted line. There are bear phases in a bull market just as there are bullish rallies in a bear market. Gold prices are in a long term bull market despite being in a bear phase at the moment. With that being our starting point then being short rather than long in the near term, makes sense to me.
As retail investors we should be able to change and implement a new strategy all in one day. This is not so easy to do for the bigger players who hold sizeable stakes in some mining companies, but this should not be a stumbling block for retail investors. We have the advantage of being small enough and therefore nimble enough to recognize change and position ourselves accordingly.
The Gold Chart
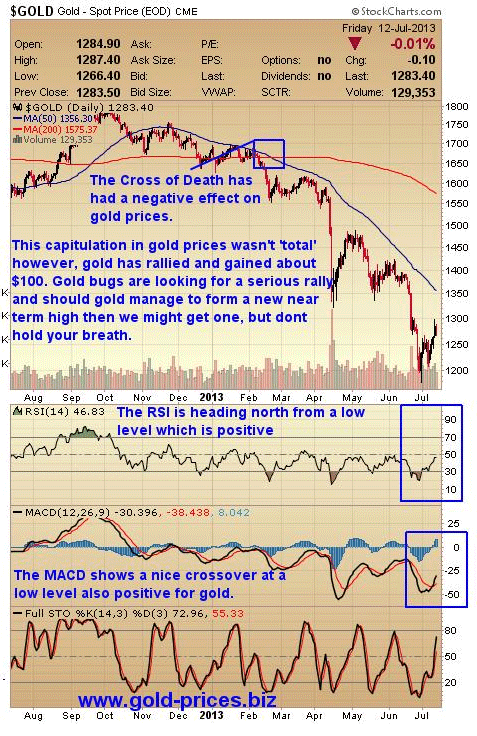
This capitulation in gold prices isn’t ‘total’ in that it feels more like death by a thousand cuts than a total wash out of the weak hands. Gold has rallied and gained about $100/oz recently and should gold manage to form a new near term high; get above $1400/oz then we might get a decent rally, but don’t count on it.
The Illusive Ignition
Last week’s fire side chat by Ben Bernanke changed nothing other than to calm the market participants who feared that the punch bowl was about to be drained. The dollar dropped and gold rallied bringing forth a chorus of ‘that’s the bottom in’ from the Perma-Bulls. The point here is that the employment figures are viewed as good enough to justify no further increase in QE and that deprives gold of the oxygen that it needs to rally.
The demand for physical gold continues unabated; however it is not strong enough to overcome the paper market as defined by the COMEX, at least not just yet. The bears have a tight grip of the paper market and until the selling is truly exhausted any rally in the precious metals sector will be capped.
The argument that gold can’t go any lower because this is what it costs to produce it is a strange one; if it were true then we wouldn’t have any bankruptcies as the price wouldn’t go any lower. When the pendulum swings it doesn’t stop at equilibrium, it tends to overshoot the mark and gold is well capable of doing just that. Mining companies will consider their options such as staff layoffs, a wage freeze, shelve expansion programs, spend some of their cash and reduce dividends, etc., in order to keep mining. The bigger operations would need to be moth balled which is an expense in itself. Gold may not go any lower, but it won’t be due to this sort of reasoning as it is flawed.
A resurgence of bank bail-ins in the southern EU countries could cause a few investors to seek refuge in the precious metals sector as the fear grows that their hard earned cash could be confiscated. However, there are many alternatives to cash which an investor can utilize and as gold does not pose a rosy picture at the moment alternatives will be sort.
There is the possibility of social unrest given the high levels of youth unemployment across the Eurozone but they have tolerated the current situation up to now. Although we have had riots from Istanbul to Stockholm, gold prices didnt head higher, they drifted lower.
A Black Swan Event could boost prices; however, by definition this is an unexpected event and can hardly be depended upon as a reason for gold prices to boom.
Conclusion
We are still in a bear phase of this bull market and so we can profit from it if we trade on what we know and not on what we imagine. If you think this bear phase is set to continue then you could consider deploying some of your ‘opportunity cash’ to your change of view. A well thought out strategy involving put options or a few straight out ‘short’ positions could be well worth your consideration.
Ed Note: Read Bob’s later article – Bounce in Gold Is a Dead Cat – Fade The Rally
In 2013 this strategy has served us well and helped us to build cash pile in readiness for the resumption of this bull market or indeed opportunities out with this market sector. This consolidation period may have further to run so we’ll need a fair amount of patience to get through it. However, as investors we can make money whether gold goes up, down or sideways, all we have to do is take the blinkers off and recognize the current situation for it is and not for what we would like it to be.
Back at the ranch our ‘Stock Trader’ service has closed two profitable trades as shown on our trading record so this new venture is finally off the mark.
Take care.
About Gold-Prices.biz

 89 Yr. old Legend Russell on how bull markets typically end, how the Gold Market hasn’t in his opinion fit the scenario and is more likely “seeing the wind-up of the gold bull market” that will end with “an exciting and frantic “all-in” entrance of the crowd”
“Everybody knows that the US has an almost unsolvable problem with debt. Let’s call it a predicament, since there is no way of solving the debt problem in an acceptable way (I mean in a politically acceptable way). Of course we could declare sovereign bankruptcy — or we could turn to hyperinflation and literally inflate our way out of the debt-trap. But neither would be acceptable or politically possible.
But before the predicted disaster, you can be certain that the coming trouble will be sensed and registered in the price of something. It will show in the price of stocks or gold or bonds or the dollar. In other words, it will show somewhere in price.
What about the bond market — isn’t the bond market now saying, “trouble ahead?” In my opinion, not yet. True, bonds have taken a beating in recent months, but I don’t call the decline in bonds, so far, a red-flag prediction of disaster … And the stock market continues to rise, probably based on the current ocean of liquidity.
How about gold? Ah, gold may be about to raise the red alarm-flag. But not quite yet. As a personal opinion, I believe gold has now put in a major bottom. Wait — what about price? Ah, there you’ve got me. Even if a bottom has been put in, we have not yet seen the “meat.” The price of gold has not yet started to boom. It’s one thing to say that you believe “the bottom is in,” but it’s another thing to see the item surge off its low.
I believe the bottom has been put in, and if, indeed, the bottom (the low) has been put in, then there’s no direction for gold to go but UP … I also insisted that my subscribers stick with gold items, and particularly with their actual bullion gold. So that is where I assume my subscribers are now positioned — in the DIAs and in gold of all types and varieties.
I’m not completely satisfied with the DIAs: The P&F chart suggests that we could see a good upside run from here, but I don’t think it would be a long-lasting, extended bull move. I’m still worried about a potential disaster somewhere in our future. You see, I’m afraid that the Greenspan/Bernanke Federal Reserve has set up America for a future disaster.
As for gold, I’m thinking that we may be seeing the wind-up of the gold bull market — or let’s call it the third, speculative phase of the great gold bull market. I know that conventional wisdom insists that the great gold bull market has ended. I’m not so sure — I’m still looking for the all-out final blow-off in gold that will end the great gold bull market.
Bull markets don’t usually end with what looks like a correction — bull markets usually end with an exciting and frantic “all-in” entrance of the crowd. We have not seen that, so far. I think it’s coming. Gold has been bad-mouthed so thoroughly that I think gold could rally back halfway to its old high (above 1900) before the public and the pros would even look at it.
I’m wondering whether this could be the start of the final blow-off phase of the bull market in gold. The sentiment is right. Everybody remains dead-bearish on gold and nobody expects a blow-off to new highs and beyond.
Owners of Gold contracts on the Comex have been taking delivery of the actual gold when their contracts expire. My thinking is that foreign nations have been the ones taking this gold (China, Russia?). While Americans have been fooling around with “cheap paper gold,” foreigners have been helping themselves to cheap actual bullion. Sad but true.”
To subscribe to Richard Russell’s Dow Theory Letters CLICK HERE. Ed Note: I just spoke with Richard’s head office and I am told that Richard still wakes up every morning excited to see what is going on in the markets. That is why his production of writing for his customers is so prolific. Not only does he mail out his extensive Newsletter every 3 weeks, but he sends out a comment every day with his thoughts on the markets action that day. All this for .82 cents a day, or only $300 per year!

Short term strength has provided an opportunity to take profits this week in a wide variety of economic sensitive sectors.
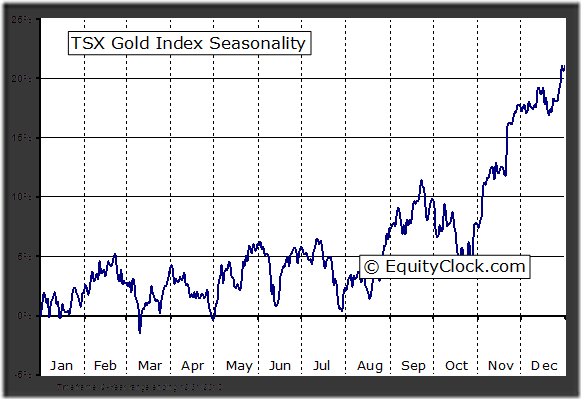
Selected sectors with favourable seasonality in the summer are starting to outperform the S&P 500 Index including gold, biotech and utilities.
Gold gained added $64.90 per ounce (5.35%) last week. Trend changed from down to up on a move above 1,267.00. Gold moved above its 20 day moving average. Strength relative to the S&P 500 Index remains negative, but showing signs of improvement. Technical score increased from 0.0 to 2.0 out of 3.0. Short term momentum indicators are trending up. ‘Tis the season for strength between July 12th and October 9th
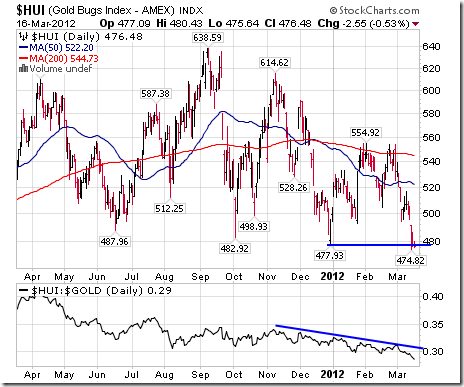
The AMEX Gold Bug Index gained 9.14 points (4.23%) last week. Trend remains down. The Index remains below its 20, 50 and 200 day moving averages. Strength relative to Gold and the S&P 500 Index remains negative. Technical score remains at 0.0 out of 3.0. Short term momentum indicators are trending up.
Silver gained $1.05 per ounce (5.60%) last week. Trend changed from down to up on a move above $20.08. Silver briefly moved above its 20 day moving average, but closed below that level on Friday. Strength relative to Gold and the S&P 500 Index improved from negative to neutral. Technical score improved from 0.0 to 1.5 out of 3.0. Short term momentum indicators are trending up.
Platinum gained $80.50 per ounce (6.07%) last week. Trend remains down. Platinum moved above its 20 day moving average. Strength relative to Gold remains positive and strength relative to the S&P 500 Index improved from negative to neutral.
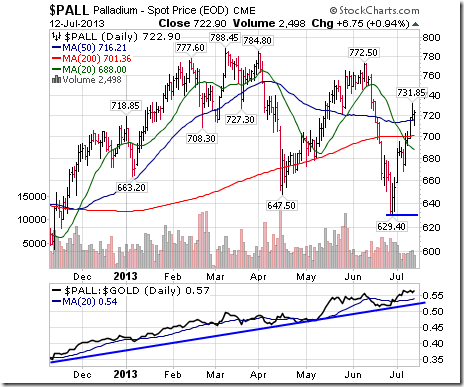
Palladium added $45.35 per ounce (6.69%) last week. Palladium moved above its 20, 50 and 200 day moving averages. Strength relative to Gold remains positive.
The TSX Metals & Mining Index gained 25.43 points (3.71%) last week. Trend changed from down to up on a move above 710.49. The Index moved above its 20 day moving average. Strength relative to the S&P 500 Index is improving, but remains negative. Technical score improved from 0.0 to 2.0 out of 3.0. Short term momentum indicators are trending up.
…..much more commentary and 40 more charts & categories in Don’s great monday report HERE
 A new research report entitled “The Powerful Case for Silver” (pdf format). In it, Peter Schiff explains why the upside potential of silver is greater than the one of gold. Peter Schiff believes that the fundamentals for silver are the strongest they have ever been and that silver is massively undervalued at today’s prices.

-
I know Mike is a very solid investor and respect his opinions very much. So if he says pay attention to this or that - I will.
~ Dale G.
-
I've started managing my own investments so view Michael's site as a one-stop shop from which to get information and perspectives.
~ Dave E.
-
Michael offers easy reading, honest, common sense information that anyone can use in a practical manner.
~ der_al.
-
A sane voice in a scrambled investment world.
~ Ed R.
Inside Edge Pro Contributors

Greg Weldon

Josef Schachter

Tyler Bollhorn

Ryan Irvine

Paul Beattie

Martin Straith

Patrick Ceresna

Mark Leibovit

James Thorne

Victor Adair