
Energy & Commodities
f you’re an oil billionaire, who do you turn to for advice?
Oil billionaires Gordon Getty and T. Boone Pickens have turned to a man named Kurt Wulff…
Kurt is “in his sixth decade of analyzing opportunities in the oil and gas industry,” according to his online bio. He doesn’t seem to be slowing down…
At DailyWealth, we love his work. He actually provides much of his work – for free, after a delay of a couple weeks – on his website www.McDep.com.
A few weeks ago, he wrote up a Norwegian oil company as a “Contrarian Buy.”
| I’m talking about oil and gas producer Statoil.
Kurt pegs Statoil’s fair value at $44 per share – 79% higher than its share price today. Statoil also pays a near-4% dividend. The company has made “a string of new discoveries on top of growing production from past discoveries,” Kurt explains. The story is not limited to the oil off the coast of Norway either: “… other prospects in the U.S. and Canada may contribute 20% of corporate production by about 2020.” Your downside risk is limited, as Statoil has “modest debt” and is based in (and taxed in) “one of the financially strongest countries in the world.” Kurt’s biggest reason for concern at the time of his initial write-up in June was that Statoil’s shares were in a downtrend. But fortunately, that has changed. In DailyWealth, we prefer to see some semblance of an uptrend – as confirmation that our idea is on the right track – before we pile into an investment idea. We like the fact that Kurt Wulff thinks the same way. Shares of Statoil bottomed for this year in June, the same month of his write-up. The shares have been in an uptrend since. The danger of buying into a downtrend has passed… It appears Kurt will get this one right. On a risk-to-reward basis, you can set up a smart trade in Statoil with the odds stacked in your favor. For example, you can set your stop-loss at the June lows (the closing low for 2012), which is only about 10% down from today’s price. Meanwhile, your upside potential – if Kurt is right – is about 79% from here. If you’re a regular DailyWealth reader, you know some of my colleagues have expressed their concerns about oil prices – and the risk that oil prices may fall… But by using a 10% stop-loss, you will be out of the trade if Kurt is wrong. So you have 10% downside and 79% upside. The setup hardly gets better. Check out Kurt Wulff’s work at www.McDep.com. Poke around at his income ideas… learn about his “McDep ratio”… and read his Statoil write-up. I am no expert in oil and gas… But I like Kurt’s work… the uptrend is here… and the risk-to-reward profile here is right. Check it out. Good investing, Steve |
|


As a general rule, the most successful man in life is the man who has the best information
The Earth’s climate has been continuously changing throughout its history. From ice covering large amounts of the globe to interglacial periods where there was ice only at the poles – our climate and biosphere has been in flux for millennia.

geocraft.com
This temporary reprieve from the ice we are now experiencing is called an interglacial period – the respite from the cold locker began 18,000 years ago as the earth started heating up and warming its way out of the Pleistocene Ice Age.

geocraft.com
Approximately every 100,000 years or so our climate warms up temporarily.

These interglacial periods usually last somewhere between 15,000 to 20,000 years before another ice age starts. Presently we’re at year 18,000 of the current warm spell.
Serbian astrophysicist Milutin Milankovitch is best known for developing one of the most significant theories relating to Earths motions and long term climate change.
Milankovitch developed a mathematical theory of climate change based on the seasonal and latitudinal variations in the solar radiation received by the Earth from our Sun – it was the first truly plausible theory for how minor shifts of sunlight could make the entire planet’s temperature swing back and forth from cold to warm.
Milankovitch’s Theory states that as the Earth travels through space around the sun, cyclical variations in three elements of Earth/sun/geometry combine to produce variations in the amount of solar energy that reaches us. These three elements are:
- Variations in the Earth’s orbital eccentricity – the shape of the orbit around the sun, a 100,000 year cycle
- Changes in obliquity or tilt of the earth’s axis – changes in the angle that Earth’s axis makes with the plane of Earth’s orbit, a 41,000 year cycle
- Precession – the change in the direction of the Earth’s axis of rotation, a 19,000 to 23,000 year cycle
These orbital processes are thought to be the most significant drivers of ice ages and, when combined, are known as Milankovitch Cycles.
Other Climate Change Drivers:
- Changes occurring within the sun affects the intensity of sunlight that reaches the Earth’s surface. These changes in intensity can cause either warming – stronger solar intensity – or cooling when solar intensity is weaker.
- Volcanoes often affect our climate by emitting aerosols and carbon dioxide into the atmosphere. Aerosols block sunlight and contribute to short term cooling, but do not stay in the atmosphere long enough to produce long term change. Carbon dioxide (CO2) has a warming effect. For about two-thirds of the last 400 million years, geologic evidence suggests CO2 levels and temperatures were considerably higher than present. Each year 186 billion tons of carbon from CO2 enters the earth’s atmosphere – six billion tons are from human activity, approximately 90 billion tons come from biologic activity in earth’s oceans and another 90 billion tons from such sources as volcanoes and decaying land plants
These climate change “drivers” often trigger additional changes or “feedbacks” within the climate system that can amplify or dampen the climate’s initial response to them:
- The heating or cooling of the Earth’s surface can cause changes in greenhouse gas concentrations – when global temperatures become warmer, CO2 is released from the oceans and when temperatures become cooler, CO2 enters the ocean and contributes to additional cooling.
During at least the last 650,000 years, CO2 levels have tracked the glacial cycles – during warm interglacial periods, CO2 levels have been high and during cool glacial periods, CO2 levels have been low
- The heating or cooling of the Earth’s surface can cause changes in ocean currents. Ocean currents play a significant role in distributing heat around the Earth so changes in these currents can bring about significant changes in climate from region to region
In 1985 the Russian Vostok Antarctic drill team pulled up cores of ice that stretched through a complete glacial cycle. During the cold period of the cycle CO2 levels were much lower than during the warm periods before and after. When plotted on a chart the curves of CO2 levels and temperature tracked one another very closely – methane, an even more potent greenhouse gas, showed a similar rise and fall to that of CO2.
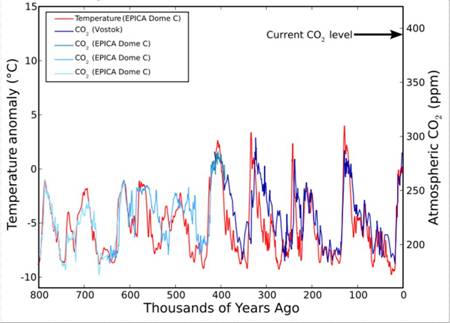
Small rises or falls in temperature – more, or less sunlight – seemed to cause a rise, or fall, in gas levels. Changing atmospheric CO2 and methane levels physically linked the Northern and Southern hemispheres, warming or cooling the planet as a whole. In the 1980s the consensus was that Milankovitch’s Cycles would bring a steady cooling over the next few thousand years.
As studies of past ice ages continued and climate models were improved worries about a near term re-entry into the cold locker died away – the models now said the next ice age would not come within the next ten thousand years.
It’s obvious that the orbital changes, as explained by Milankovitch’s Theory, initiate a powerful feedback loop. The close of a glacial era comes when a shift in sunlight causes a slight rise in temperature – this raises gas levels over the next few hundred years and the resultant greenhouse effect drives the planet’s temperature higher, which drives a further rise in the gas levels and so on.
How Higher Temperatures effect Food Production
The study Climate Trends and Global Crop Production Since 1980 compared yield figures from the Food and Agriculture Organization (FAO) with average temperatures and precipitation in major growing regions.
Results indicated average global yields for several of the crops studied responded negatively to warmer temperatures. From 1981 – 2002, warming reduced the combined production of wheat, corn, and barley – cereal grains that form the foundation of much of the world’s diet – by 40 million metric tons per year.
The authors said the main value of their study was that it demonstrated a clear and simple correlation between temperature increases and crop yields at the global scale.
“Though the impacts are relatively small compared to the technological yield gains over the same period, the results demonstrate that negative impacts are already occurring.” David Lobell, lead researcher
Other researchers who focused on wheat, rice, corn, soybeans, barley and sorghum (these crops account for 55 percent of non-meat calories consumed by humans and contribute more than 70 percent of the world’s animal feed) reported that each had a critical temperature threshold above which yields started plummeting, for example: 29°C for corn and 30°C for soybeans. At the International Rice Research Institute in the Philippines scientists have found that the fertilization of rice seeds falls from 100 per cent at 34 degrees to near zero at 40 degrees.
Crop losses due to plant diseases could decline by as much as 30 percent with warmer and drier conditions.
Demand
By 2050, the world’s population is expected to reach around nine billion – minimum and maximum projections range from 7.4 billion to 10.6 billion.
Unfortunately the Green Revolutions high yield growth is tapering off and in some cases declining. So far this is mostly because of an increase in the price of fertilizers, other chemicals and fossil fuels, but also because the overuse of chemicals has exhausted the soil and irrigation has depleted water aquifers.
Yield
“Future food-production increases will have to come from higher yields. And though I have no doubt yields will keep going up, whether they can go up enough to feed the population monster is another matter. Unless progress with agricultural yields remains very strong, the next century will experience sheer human misery that, on a numerical scale, will exceed the worst of everything that has come before“. Norman Borlaug, father of the Green Revolution
If average global temperatures rise just over one-half degree Centigrade the frost-free growing season in the corn belt would be lengthened by two weeks. But, as the previously mentioned study showed, if temperatures increase beyond a specific threshold, fertilization is effected, thus reducing the plants growing season and reducing yield.
Carbon dioxide does two things for plants – it is an essential compound in photosynthesis and it increases water use efficiency in plants – so a doubling of the pre-industrial carbon-dioxide levels, such as we’ve seen, should increase crop yields significantly right?
Well let’s not jump to conclusions – in laboratory tests yields do increase tremendously, but in real life field conditions other atmospheric gases surrounding the plant diminish the carbon dioxide’s photosynthesis enhancement and yield levels reached in the lab are cut drastically, as much as 75 percent.
All of the positive effects of carbon dioxide increases may be negated by the stress caused by low rainfall and high temperatures. Increased cloud cover – due to higher global temperatures – might limit photosynthesis and result in reduced crop production.
Higher levels of carbon dioxide help some plants tolerate less water and limited amounts of soil nitrogen but does not compensate for reduced levels of phosphorus or potassium.
If global warming raises the temperature just two degrees Centigrade insects numbers will increase becoming a major nuisance – also some insects will be able to extend their range as a result of the warming. Farmers in the US, depending on the crop, can expect a 25 to 100 percent increase in crop losses.
Conclusion
The heating and cooling of the Earth coincides with the activity of the sun – the sun determines the Earth’s temperature. Since man-made carbon dioxide emissions started in the 1850’s, the CO2 level has only risen 11 percent – a very small rise with a nearly negligible effect.
Science says the Earth is going to continue to warm. The warming is not manmade, to continue to spend precious resources fighting a battle you cannot win is a fruitless endeavor. The earth is our home and we need to take care of it best we can, there is no gain needlessly hurting the planet we live on. But let’s not be led astray by false prophets and Pied Pipers singing the wrong tune.
We need to spend money on advancing agricultural research, water infrastructure and supply lines – focus research on growing more food on less land while using less water and get food, supplies, to where it’s needed in an efficient and safe manner.
The truth regarding climate change, and how it effects our food production should be on all our radar screens. Is it on yours?
If not, maybe it should be.
Richard (Rick) Mills
If you’re interested in learning more about the junior resource and bio-med sectors please come and visit us at www.aheadoftheherd.com
Site membership is free. No credit card or personal information is asked for.
Legal Notice / Disclaimer
This document is not and should not be construed as an offer to sell or the solicitation of an offer to purchase or subscribe for any investment.
Richard Mills has based this document on information obtained from sources he believes to be reliable but which has not been independently verified; Richard Mills makes no guarantee, representation or warranty and accepts no responsibility or liability as to its accuracy or completeness. Expressions of opinion are those of Richard Mills only and are subject to change without notice. Richard Mills assumes no warranty, liability or guarantee for the current relevance, correctness or completeness of any information provided within this Report and will not be held liable for the consequence of reliance upon any opinion or statement contained herein or any omission.
Furthermore, I, Richard Mills, assume no liability for any direct or indirect loss or damage or, in particular, for lost profit, which you may incur as a result of the use and existence of the information provided within this Report.
Comparisons are useful in evaluating a company, but in the rare earth market, it’s not as simple as a spreadsheet. With so many variables in the mix, no two projects are exactly alike, and each has its relative strengths and weaknesses. But out of hundreds of juniors digging for rare earths and graphite, how can investors evaluate who is likely to be among the handful to finally sell their minerals to end users? In this exclusive interview with The Critical Metals Report, Technology Metals Research Founding Principal Gareth Hatch examines the supply chain to identify advanced companies with good odds for success. He also shares some telling metrics that help show how companies measure up to their peers.
COMPANIES MENTIONED: ALKANE RESOURCES LTD. – ARAFURA RESOURCES LTD. – AVALON RARE METALS INC. – FLINDERS RESOURCES LTD. – FOCUS GRAPHITE INC. – FRONTIER RARE EARTHS LTD. – GREAT WESTERN MINERALS GROUP LTD. – GREENLAND MINERALS & ENERGY LTD. – HASTINGS RARE METALS LTD. – LYNAS CORP. – MATAMEC EXPLORATIONS INC. – MOLYCORP INC. – NORTHERN GRAPHITE CORPORATION – QUEST RARE MINERALS LTD. –RARE ELEMENT RESOURCES LTD. – TASMAN METALS LTD. – UCORE RARE METALS INC.
The Critical Metals Report: In your Novemberinterview with us, you said you were tracking more than 390 rare earth element (REE) projects, but probably only 8-10 of those would come onstream in the next seven years. Have those numbers changed? Why are the odds so long?
Gareth Hatch: The number of companies exploring for REEs in the past two years has actually crept up to over 440 projects. However, that estimate of the number of companies that will be successful in the next five to seven years may be generous. REEs occur all over the world, but only a handful of high-quality projects have what it takes both in the ground and above it to come to fruition. Couple those physical limitations with the fact that the capital markets are not an infinite source of funds, and you can see why the percentage is so low. It takes lots of money to bring these projects online and it has become pretty difficult in the last year to raise money. That means that some of these projects will wither and die for lack of capital. We are starting to see companies fall off the radar, leaving behind only a website with an error message. We are also seeing some companies changing their name to the next mineral of interest. Many such companies are early-stage prospect generators. They might only be interested in doing some exploration, finding something interesting and then moving on to the next project rather than starting with a world-class, phenomenal mineral resource and then building a company and long-term project around that.
Some prospectors explore with the supply-chain perspective in mind, focused on particular technology metals with the goal of developing a project, somewhere, for those metals. Taking the supply-chain point of view is one of the best ways to determine if a project will be successful, where success is defined as the economic production of metals and compounds, not the finding of a ten-bagger.
TCMR: Do you see end users’ participating in exploration in an attempt to build out a reliable supply chain?
GH: It’s not happening much in this sector, but we are starting to see some end users linking up with some of the more viable or advanced projects through partnerships, joint ventures or investments. That is definitely happening.
TCMR: You produce the TMR Advanced Rare-Earths Project Index that lists 42 projects in 13 countries with NI 43-101- or Joint Ore Reserves Committee (JORC)-compliant mineral resource estimates. Which of these projects are more advanced?
GH: One way to do an immediate first cut is to look at which projects not only have a resource estimate, but which also have an estimated mineral reserve. That’s the portion of the mineral resource that has been analyzed and deemed to be economically viable. Only a handful of companies have done the significant work required to get to that point. Those would include names that everyone will be familiar with, such as Molycorp Inc. (MCP:NYSE). The company’s Mountain Pass project in California is scheduled to come onstream imminently. It has already started some aspects of upgraded production there.
Lynas Corp. (LYC:ASX) has the Mt. Weld Central Lanthanide Deposit in Australia and has experienced political problems and protests at its processing facility in Malaysia, but a series of recent decisions have been made in Lynas’ favor. It is taking a lot of time, but it looks like things are heading in the right direction.
Alkane Resources Ltd. (ALK:ASX) has the Dubbo Zirconia Project in Australia. That might be in production in a couple of years. The company recently announced a memorandum of understanding (MOU) with Japan’s Shin-Etsu Chemical Co. Ltd., a big chemical producer in Japan, to process concentrates. As I understand it, in addition to tolling the material on behalf of Alkane, Shin-Etsu would have an option to purchase the end products. It potentially makes sense for both parties because tolling arrangements realize the value from separated materials without selling the concentrate.
TCMR: Is it easier for companies to obtain money from the capital markets if an agreement of this kind is already in place?
GH: What you ideally want is a binding contract, preferably with specific offtake quantities and values. This is not a binding MOU, but it certainly helps when talking to an institutional investor. If this turns into a more formal agreement, then clearly there will be more value for Alkane there.
TCMR: Which other companies are in advanced stages?
GH: The other two that have reserves are Rare Element Resources Ltd. (RES:TSX; REE:NYSE.A) with a project in Wyoming and Avalon Rare Metals Inc. (AVL:TSX; AVL:NYSE; AVARF:OTCQX) with a project in the Northwest Territories of Canada. Rare Element Resources has the Bear Lodge project with decent grades of material. It is doing further exploration and drilling work on zones that contain higher concentrations of heavy REEs (HREEs).
Avalon, which has the Nechalacho project, is considering the construction of a separation plant in the southern U.S. Its project has had some delays; the company announced in May 2012 that its metallurgical studies would take longer than expected, pushing out the expected start date for production. Avalon took some heat for this, but REE processing is a complex business, and as further studies and analyses are completed, technical challenges will be discovered. Avalon certainly won’t be the last company to encounter this, and the shoe will be on the other foot for some of the other players in this sector soon enough.
The previous five companies all have the economic analyses of their projects completed to such a detail that reserves have been declared. Some others are worth noting. Great Western Minerals Group Ltd. (GWG:TSX.V; GWMGF:OTCQX) has the Steenkampskraal project in South Africa, where it is in the process of constructing mine site facilities. It could be producing next year.
Greenland Minerals & Energy Ltd. (GGG:ASX) has the Kvanefjeld project in Greenland, Frontier Rare Earths Ltd. (FRO:TSX) has the Zandkopsdrift project in South Africa and Arafura Resources Ltd. (ARU:ASX) has the Nolans project in Australia. All three of these companies have completed prefeasibility studies. They’re not quite as far along as the first five companies, but they’re well on their way to completion of the analysis required.
The other company not far off from this level is Quest Rare Minerals Ltd. (QRM:TSX; QRM:NYSE.A). Quest is well on its way to completing a prefeasibility study on its Strange Lake project in Quebec.
TCMR: You mentioned that Rare Element Resources has HREEs. Is the light-versus-heavy ratio going to be important when these companies start producing?
GH: It can be, though I should clarify that most of the work that Rare Element Resources has done to date has focused on the original portion of its project, whose REE distribution skewed to the lights. However, it has recognized the potential value of being able to produce a quantity of heavies from elsewhere within Bear Lodge, so it is investing the time and effort to more closely examine parts of their property that could potentially provide that.
Most (though not all) of the companies closest to production at this point are dominated by light REE (LREE) projects. The mineralogy and the metallurgy required to process HREE minerals is a far more complex proposition. However, the end goal is potentially more worthwhile. I actually prefer to think in terms of “critical rare earths”—neodymium (a LREE), and four HREEs, europium, terbium, dysprosium and yttrium—rather than just lights and heavies.
Numerous companies focused on these critical rare earths are at the preliminary economic assessment (PEA) or scoping study stage, or have only just recently defined their resources. It will be several years before they come on-stream, if they come on-stream, but the materials that they might produce are particularly interesting from a future supply and demand dynamic. If any of them prove to have decent distributions or quantities of those materials, then they could be particularly attractive to the supply chain.
TCMR: Which are the companies with projects at earlier stages of development, which have those critical REEs?
GH: Focusing on Western jurisdictions only, Lynas has another project next door to the Central Lanthanide Deposit at Mt. Weld, the Duncan Deposit, which has a very significant distribution and grade of heavies. Attractive REE distributions are also associated with Tasman Metals Ltd.’s (TSM:TSX.V; TAS:NYSE.A; TASXF:OTCPK; T61:FSE) Norra Kärr project in Sweden’ Matamec Explorations Inc.’s (MAT:TSX.V; MRHEF:OTCQX) Kipawa deposit in Quebec, Ucore Rare Metals Inc.’s (UCU:TSX.V; UURAF:OTCQX) Bokan Mountain deposit in Alaska and Hastings Rare Metals Ltd.’s (HAS:ASX) Hastings project in Australia. There are of course others elsewhere.
The challenge with the heavies is that they typically occur in much lower concentrations than the lights. So processing these minerals economically is potentially a difficult challenge.
TCMR: You also produce a value metrics chart that maps the value of in-situ rare-earth oxides (REOs) per unit of mineral resources against the average value per unit of the finished, separated REOs. How might this chart help an investor make decisions about what projects will be economic in the long run?
GH: The x-axis of the chart represents the average theoretical value of each ton of the deposit contained in the resource estimate, by virtue of the presence of REOs (ignoring recovery rates). It is therefore dominated by the overall grade of total REOs (TREOs). If two deposits had identical minerals and REO distributions, but one was 3% TREO and the other was 6% TREO, we would expect to see an x-axis value for the latter twice the value of the former. I should note that the x-axis value has nothing to do with the overall size or tonnage of the deposit. All other things being equal, projects that have high values on the x-axis are likely to have lower unit costs for the physical processing of ores than those toward the left. You don’t have to move as much material to get the same amount of REOs out, assuming similar recovery rates.
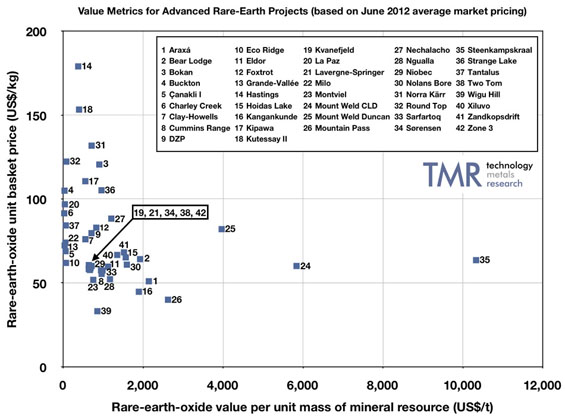
The y- axis of the chart represents the comparative unit value of the suite of finished, separated products from the various deposits, assuming equal recovery rates for each REO. Deposits that contain greater distributions of the more valuable HREEs will have higher basket prices than others. The y- value has nothing to do with grade, nor does it take into account processing costs. Essentially, the higher a project is on the y-, the more likely it is to have greater relative distributions of the more valuable HREEs/critical REEs. If you can get the material out of the ground and if you can do the processing and if you can get through the metallurgical challenges and the separation challenges and you have a finished product, this is an indication, relatively, of what that might be worth.
Unfortunately, there is a roughly inverse relationship between the two metrics. Deposits that have high TREO grades tend to have lower quantities of higher-value HREEs; deposits that contain higher proportions of HREEs tend to have poorer grades. Rich deposits with high grades are dominated by the LREEs cerium and lanthanum. Projects that may buck that trend and have reasonably significant x and yvalues are particularly interesting to look at. It’s just a way of comparing and should not be construed as a quantitative measure of project quality. Not all REE companies are thrilled with me putting their projects on this chart, even though the numbers are based on public-domain information. I acknowledge that many other factors need to be considered, but it can be a helpful tool.
TCMR: So, for example, Great Western’s Steenskampskraal project in South Africa is on the far right hand of the chart, midway up. Stans Energy Corp.’s (HRE:TSX.V) Kuttesay II project in Kyrgyzstan is toward the top but close to the x-axis. What does that imply for these projects?
GH: All things being equal, it means that the unit cost of mining and initial physical processing for the Steenskampskraal project will probably be a lot lower than Kutessay II. This is because there are more REOs per ton of rock in the ground being mined.
The Stans project will have to shift more tons of waste material that it doesn’t want to get the minerals that it does want. However, once it has done that, the unit value of the suite of REOs present at Kutessay II is likely to be higher on a per-kilogram of finished TREO basis than for Steenkampskraal.
Comparisons have their value, but we should remember that each and every project has to be treated on its own merits. If the costs of production plus a reasonable margin are lower than the revenues that a project can reasonably be expected to generate, then it is theoretically possible for any one of these projects on this chart to be successful—assuming that there isn’t oversupply in the market by the time they come to production.
TCMR: You mentioned that processing is a big part of the REE equation. What role does the complexity of separation and processing play in determining whether an REE project will ultimately come to market economically?
GH: I think it’s probably the most critical factor right now. To a large extent, you can live with differences in grade of material. You can probably even live with a project in a remote location. Ultimately, success hinges on the economics of processing, metallurgy and separation. There are two parts to it: There is the initial physical processing—mining, grinding and liberating the minerals from the rock. Then there is the chemical side—the extraction of the REEs from the mineral to produce a mixed REE concentrate and separation of the individual REEs from each other.
If a company stops at the concentrate stage with a mixed REE carbonate, chloride, or some other compound, without going to the next step and separating, it is losing a lot of the potential value. Obviously, a company avoids capital costs by not building a separation facility, but the best value is gained by going all the way to separation. This is what will make or break many of these projects. It’s the reason for the founding of Innovation Metals Corp. last year as a vehicle for providing toll-based separation services to future producers. We are in the planning stages of an independent, centralized critical REE separation facility to be built in Becancour, Quebec—the first of its kind outside of China.
TCMR: You’ve also started a TMR Advanced Graphite Projects Index. Many people are calling graphite the REE of 2012. Graphite is also used in new technology applications, such as hybrid cars and green energy, but is the label applicable if the same processing and supply constraints don’t apply?
GH: It may be the “REEs of 2012” from the retail investor’s point of view—trying to find some hidden gems in the junior-mining sector and seeing a swift appreciation in value before everyone jumps on the bandwagon. There are a few important differences, however. I always try to take the supply-chain perspective. China dominates production in both REEs and graphite, but not to as dominant a scale when it comes to graphite. It’s closer to 70%, rather than the 95% estimated for REEs. However, most of the market is synthetic graphite. That is how demand from a number of applications has been met to date and that is an important factor in the supply-demand equation. That said, so-called large-flake graphite has become particularly attractive for certain applications, such as battery manufacturing. That could increase the demand for natural graphite sources that contain such flake sizes.
We have started to see an increase in the number of companies that have announced graphite projects, similar to the way that REE and uranium projects popped up in recent years. As of July, TMR is tracking 159 graphite projects under development, associated with 82 different companies in 18 different countries outside of China. There is something of a frenzy going on today. If market penetration of electric vehicles takes off, as some say, then that will increase the demand for lithium-ion batteries, which, in turn, could significantly increase demand for graphite—an important component of such batteries.
TCMR: Which companies are advanced enough to help meet future graphite demand?
GH: We shouldn’t forget that non-Chinese graphite producers are out there, such as Asbury Carbons [private] and TIMCAL [private]. No doubt companies like these are gearing themselves up for future demand. A number of natural graphite exploration projects have been quietly under development for some time, only recently coming into the spotlight because of investor interest in “the next big thing.” Some could be of genuine interest to the market because of the presence of larger-flake graphite. Focus Graphite Inc.’s (FMS:TSX.V) Lac Knife project and Northern Graphite Corporation’s (NGC:TSX.V; NGPHF:OTCQX) Bissett Creek project are examples of companies with promising resources at advanced stages of development.
Formerly producing mines like Ontario Graphite’s Kearney mine, or the Kringel mine in Sweden, which actually has four different mining licenses, and is now owned by Flinders Resources Ltd. (FDR:TSX.V)are also worth considering. I visited the Kringel project last month and the company is well on the way to bringing it back online. There is room for a number of new sources of supply of natural graphite. However, as I said before, the level of demand will depend on the rate of market adoption of electric vehicles requiring lithium-ion batteries. Market penetration could increase sharply if battery prices come down, leading to the predicted significant increases in demand for large-flake, natural graphite. On the other hand, if the battery manufacturers are not able to reduce the unit costs of these batteries, then market penetration will be limited. This latter point is very important to bear in mind. A lot of investors that I’ve spoken with seem to be oblivious to this possibility.
The other potential driver that is a bit further off is graphene, a new “wonder” material based on graphite. Graphene is formed from a single layer of graphite, one atom thick, and has some amazing properties. It sometimes sounds a bit like the stuff of science fiction, but it is a real material, and as a materials scientist by training I find the possibilities quite exciting. The challenge has been how to produce it in commercial quantities, so it could be some time before it has a direct impact on the graphite market. But in the long term, it’s something to watch.
TCMR: A lot of graphite companies have come forward recently. As of July, you have 10 projects in three countries that were included in your Graphite Index as having met the minimum criteria for inclusion. How many of these projects could be successful? Which ones have the best chances?
GH: It could be any of those projects. They have all either done enough work to define a resource estimate, or are formerly producing mines and are in the process of finalizing such estimates. So they have the minimum understanding required of what they have in the ground. One of the tricky things about graphite project development is that you don’t actually know what flake size you have until you’ve done a bit of processing.
TCMR: Can you give us an idea on the timing? How many years are we talking about before some of these companies start producing?
GH: Compared to the REE sector, graphite has a much shorter time frame. Environmental impact studies and logistics still have to be addressed, but from a processing point of view, graphite is a much easier proposition than REEs. The most advanced projects on here would be Focus Graphite’s Lac Knife, Northern Graphite’s Bissett Creek and Flinders Resources’ Kringel. Kringel, for example has most of the infrastructure in place and doesn’t have to spend five years figuring out how to process the complex minerals that you’d find with an REE project. This is fairly straightforward. Northern Graphite just completed its bankable feasibility study and could be up and running within a year or two. Flinders is planning to be in production within the next two years; Focus within 2-3 years.
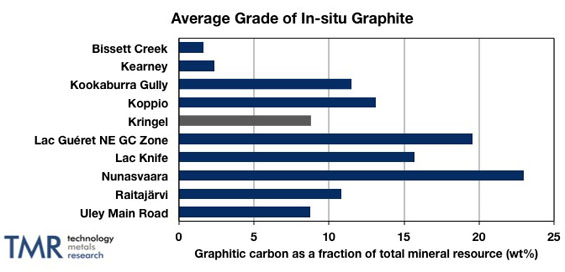
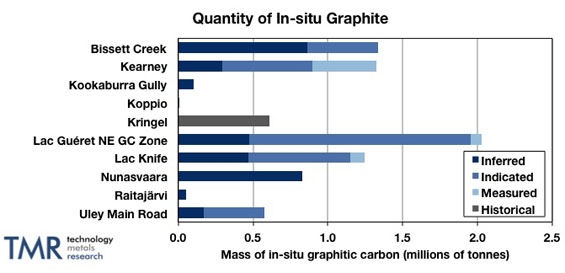
TCMR: You mentioned that the type of graphite matters. You have charts for the average grade and quantity of in-situ graphite for each of the projects. How important is grade in graphite? Is flake size more important in graphite than maybe some of the quality issues in REEs?
GH: Grade is always important from a production cost point of view, but flake size is at least as important. Just as the distribution of REEs in a rare-earth deposit can determine market value, graphite flake size impacts the price. The extra large- or large-flake graphite portion of a deposit is worth a lot more money, just as some of the HREEs are worth a lot more money.
We’ve just published details on the flake-size distribution for each of these projects, for the first time. Unlike the REE space, where everyone knows what terbium, lanthanum and cerium are and you can go to any chemistry lab and test for the presence of these elements, characterizing a graphite deposit in terms of flake size is something of an arbitrary process. Graphite is categorized according to the mesh sieves through which material does or does not pass but there is no standard set of mesh size ranges in use at present. There is also a lack of consistency from one company to another in the definitions of terms such as “large”, “medium” or “fine” to describe categories of flake size. Anyone looking at these projects must be aware of this—you might not be comparing apples to apples when looking at those terms only. Make sure to look at the mesh-size ranges used.
TCMR: What advice would you give our readers about getting into either the REE or graphite market right now?
GH: Always spend some time looking at any of these projects from the supply-chain perspective. Demand for these materials is driven by the needs of companies to get metals and materials to make things, not to quadruple an upstream mining company’s share price. The supply chain doesn’t care who succeeds, for the most part, only that some succeed. A lot of information is out there on all of these projects. Look at the technical side at least as closely as share structure, management team and so on. I find it easier to analyze projects run by Canadian-based companies simply because we get access to a lot more information on resource estimates and technical reports than in some other markets. But either way, take the time to understand the demand drivers. Do your homework so that you understand the sector.
TCMR: That is great advice. I thank you so much for taking the time to talk to us.
GH: Thank you.
Gareth Hatch is a founding principal of Technology Metals Research, LLC. He is interested in helping people understand the challenges associated with the growing demand for rare earth elements (REEs) and other critical and strategic materials. He is also a co-founder of Innovation Metals Corp., a provider of downstream processing and marketing services to the strategic metals industry. For several years, Hatch was director of technology at Dexter Magnetic Technologies. He holds five U.S. patents on a variety of magnetic devices. A two-time graduate of the University of Birmingham in the U.K., Hatch has a Bachelor of Engineering in materials science and technology and a Ph.D. in metallurgy and materials. He is a fellow of the Institute of Materials, Minerals & Mining, a fellow of the Institution of Engineering & Technology, a chartered engineer and a senior member of the Institute of Electrical and Electronics Engineers (IEEE). Hatch is also a member of the Strategic Materials Advisory Council.
Want to read more exclusive Critical Metals Report articles like this? Sign up for our free e-newsletter, and you’ll learn when new articles have been published. To see a list of recent interviews with industry analysts and commentators and learn more about critical metals companies, visit our Critical Metals Report page.
DISCLOSURE:
1) JT Long of The Critical Metals Report conducted this interview. She personally and/or her family own shares of the following companies mentioned in this interview: None.
2) The following companies mentioned in the interview are sponsors of The Critical Metals Report:Northern Graphite Corp., Tasman Metals, Matamec Explorations, Rare Element Resources, Ucore Rare Metals, Quest Rare Minerals, Frontier Rare Earths. Streetwise Reports does not accept stock in exchange for services. Interviews are edited for clarity.
3) Gareth Hatch: I personally and/or my family and/or funds that I manage have a beneficial interest in the following companies mentioned in this interview: Innovation Metals Corp. I personally and/or my family am paid by the following companies mentioned in this interview: Innovation Metals Corp. I was not paid by Streetwise Reports for participating in this interview.

Dear Money Talks Readers:
From time to time we are able to bring our readers subscriber-only reports from our colleagues. Today, we have a new report from a regular speaker at our MoneyTalks conferences, Keith Schaefer, who publishes the Oil & Gas Investments Bulletin. Keith has agreed to make this report available to our readers at no cost, and it is one that we highly recommend you download while it’s available.
Keith is one of the few analysts out there who focuses exclusively on the junior oil and gas sector. And in his new report, Keith reveals a Canadian junior oil producer that has:
– Three core plays—two are producing now, the other in 2013…
– Exceptional management with proven drilling record and execution
– 96% oil makes them very profitable against their peers
– Huge land position that will provide years of low risk drilling
To get Keith’s new stock report at no charge, simply click here for access.
You’ll also begin receiving Keith’s Oil & Gas Investments Bulletin Free Alerts, delivered to your email inbox one to two times per week. (You can opt out easily at any time.)
Keith is able to break down the oil & gas market into easy-to-understand research, and he’s also given his subscribers the opportunity to take exceptional profits along the way. Download Keith’s report here, while this offer lasts.

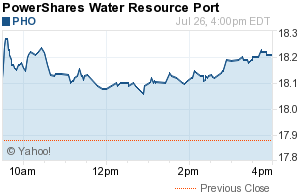
“Is water the gold of the 21st century?” asks Fortune. Answer: Yes, water is the New Gold for investors this century.
In 2010 global water generated over a half trillion dollars of revenue. Global world population will explode from 7 billion today to 10 billion by 2050, predicts the United Nations. And over one billion “lack access to clean drinking water.”
Climate and weather patterns are changing natural water patterns. And industrial pollution is making water a scarce commodity. So the good news is that huge “opportunities exist for businesses that can figure out how to keep the pipes flowing.”
Yes, it’s a hot market.
….read more analysis of the following topics HERE
- Population, the explosive driver in the demand for ever-scarcer water
- China’s mining “new gold,” for agriculture, industry, economic leadership
- New Gold hidden in steaks, auto tires, chickens, designer jeans
- Get your feet wet in wet stocks and watery ETFs


-
I know Mike is a very solid investor and respect his opinions very much. So if he says pay attention to this or that - I will.
~ Dale G.
-
I've started managing my own investments so view Michael's site as a one-stop shop from which to get information and perspectives.
~ Dave E.
-
Michael offers easy reading, honest, common sense information that anyone can use in a practical manner.
~ der_al.
-
A sane voice in a scrambled investment world.
~ Ed R.
Inside Edge Pro Contributors

Greg Weldon

Josef Schachter

Tyler Bollhorn

Ryan Irvine

Paul Beattie

Martin Straith

Patrick Ceresna

Mark Leibovit

James Thorne

Victor Adair