
Economic Outlook
We all know the debt load in the US economy is horrendous and unsustainable. The US government runs deficits of approximately $1 Trillion per year, even with interest rates at historical lows. Current official national debt exceeds $19 trillion, of which $13.9 trillion is public debt. Unfunded liabilities are much larger. Even a 7% average interest rate would require nearly $1 trillion per year for interest only debt service, thereby increasing national debt even more rapidly.
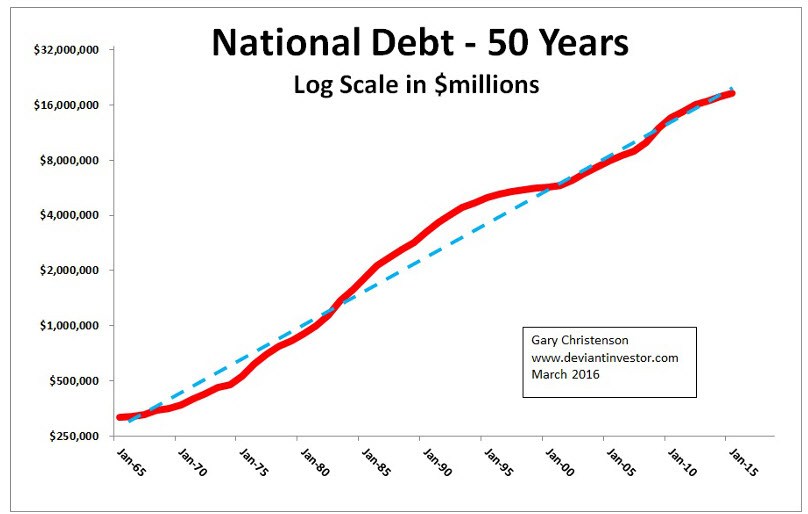
National debt has increased exponentially for the past 50 years. Expect the exponential increase to continue and accelerate, even with historically low interest rates.
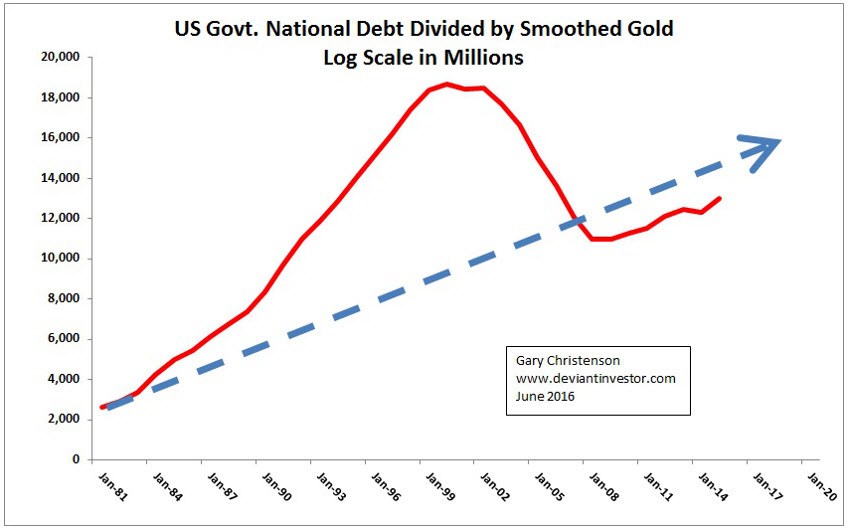
What if we priced national debt in “real money” – actual gold instead of the digital and paper stuff that can be created at the whim of a central banker?
I used the annual average of gold prices and heavily smoothed them with a 7 year moving average. Then I divided the national debt by the heavily smoothed gold prices.
The 35 year graph shows that, on average, national debt has increased rapidly, even when priced in gold. This should be cause for alarm – debt is increasing far too rapidly, and gold is underpriced.
The current national debt is equal to about 100 times the total value, at current gold prices, of the gold “officially” stored in Fort Knox. This should be cause for alarm.
What about transfer payments per the St. Louis Fed (FRED)? According to FRED the total transfers for social benefits in 2015 was about $1.959 trillion – or 10 times the value of the gold officially stored in Fort Knox. A 35 year graph is shown below. Of course transfer payments have steadily increased from $251 billion in 1981 to $1,959 billion in 2015, but even priced in gold the transfer payments have increased.

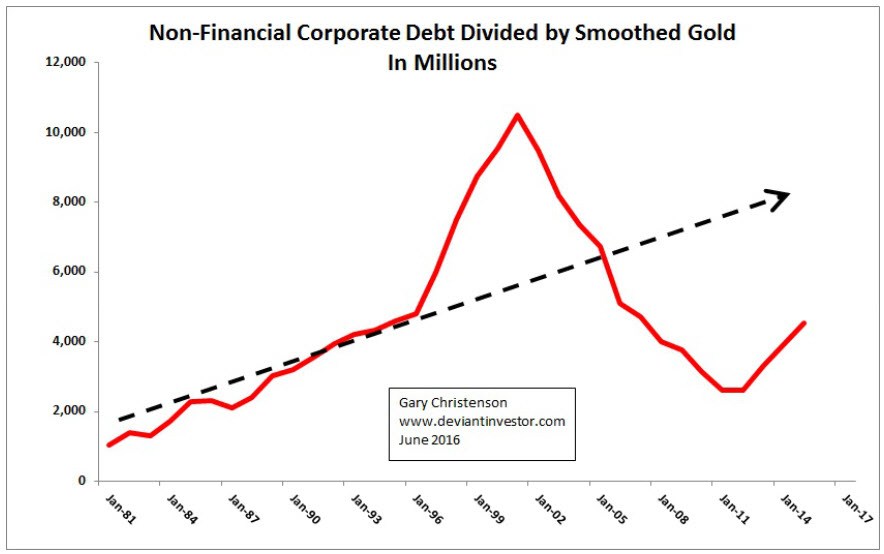
What about non-financial corporate debt? According to FRED that debt was $474 billion in 1981 and about $5.4 trillion in 2015. If the US economy falls into a recession what percentage of that debt will default? All of that debt is someone else’s asset, and if that debt defaults, those assets disappear. Cause for alarm…
What about wages as calculated by Social Security? The official average national wage in 1981 was $13,773 and in 2014 it was $46,481. I divided that official average wage by the heavily smoothed price of gold and produced this chart. National debt, corporate debt, and transfer payments are increasing more rapidly than average wages. Cause for alarm….

CONCLUSIONS
- Official national debt is massive and accelerating higher even though rates of interest paid to service that debt are historically low. The Fed will have difficulty raising rates.
- Non-Financial Corporate debt currently exceeds $5 trillion, thanks to low interest rates, QE, and stock buy-backs funded via debt. The next recession will be problematic for debt repayment to those who believe those debts are assets.
- Wages are increasing slowly compared to debt. Sustaining a standard of living via debt (individuals and governments) only works for a limited time. “Those trends are coming to an end…”
- The official horde of gold supposedly stored in Fort Knox is 147.3 million ounces, worth at current prices less than $200 billion, a tiny fraction of official national debt – debt which can’t be paid will be defaulted, either via inflation or repudiation. The price of gold will rise substantially as global currency values fall.
- Defaulting debt will be destructive to the value of the dollar as well as all other paper and digital currencies. Gold has no counter-party risk and will benefit accordingly.
From Bill Gross:
“For over 40 years, asset returns and alpha generation from penthouse investment managers have been materially aided by declines in interest rates, trade globalization, and an enormous expansion of credit – that is debt. Those trends are coming to an end…”
From Charles Hugh Smith:
“Leaders face a no-win dilemma: any change of course will crash the system, but maintaining the current course will also crash the system.”
Repeat: “Those trends are coming to an end…”
Gold and silver come to mind…
Gary Christenson
The Deviant Investor

 We are not in a recession. We are in a depression, and have been since the turn of the century.
“If one dates the beginning of a depression from the beginning of the unsustainable expansion of debt that preceded it, then the current depression began in 1987.”
“Governments and central banks turn recessions into depressions, which are preceded by unsustainable expansions of debt untethered from the real economy.”
“Economic depressions unfold slowly, which obscures their analysis, although they are simple to understand.
related: Greenspan: Monetary policy has done everything it can

What! With over 40 billion dollars spent annually to comply with CDN Government regulations. A third of which are useless. More than a million Provincial regulations from bicycles to Ice Cream stands. Billions in tax compliance costs and state cronyism…..
 This May 11th Daily Comment is from Michael Campbell, Canada’s top rated nationally syndicated financial radio show, along with the digital platform moneytalks.net

Consensus Forming: China Heading Back Into Financial Crisis
China’s historic post-2009 debt binge flew largely under the radar — fooling most observers into thinking the global economy was recovering rather than just re-leveraging.
Now Beijing is back at it, borrowing over $1 trillion in this year’s first quarter, buying up commodities and creating the illusion of global growth. But this time the scam hasn’t gone unnoticed. Reporters, editors and money managers seem, at last, to be catching on. Some representative headlines:
George Soros warns of credit crisis in China
Chinese cities dive back into debt to fuel growth even as defaults rise
China debt climbs to US$25 trillion
China’s banks cut bad debt buffer as profits flatline
Doug Noland, meanwhile, goes to the heart of the problem in last night’s Credit Bubble Bulletin:
I recall an early-1998 Financial Times article highlighting the explosive growth in Russian ruble and bond derivatives. Not only had the “insurance” market for risk protection grown phenomenally, Russian banks had become major operators in what had evolved into a huge speculative Bubble in Russian debt exposures. That was never going to end well.
There was ample evidence suggesting Russia was a house of cards. Yet underpinning this Bubble was the market perception that the West would not allow a Russian collapse. With such faith and the accompanying explosion in speculative trading, leverage and a resulting massive derivatives overhang, any break in confidence would lead to illiquidity, panic and a devastating bust. Just such an outcome unfolded in August/September 1998.
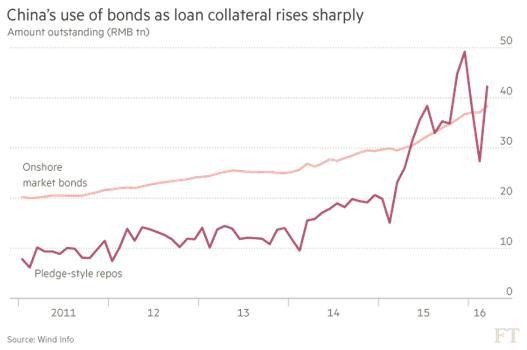
From a recent Financial Times article: “The [Chinese] market for pledge-style repos — short-term, bond-backed loans — is currently bigger than the stock of outstanding debt”. Within this undramatic sentence exists the potential for a rather dramatic global financial crisis. And, to be sure, seemingly the entire world has operated under the assumption that Chinese officials (and global policymakers in general) have zero tolerance for crisis – let alone a collapse. So Credit, speculation and leverage have been accommodated – and they combined to run absolute roughshod.
The Financial Times article includes a chart worthy of color printing and thumbtacking to the wall: “China’s Use of Bonds as Loan Collateral Rises Sharply”. The pink line shows “Onshore Market Bonds” having almost doubled since mid-2011 to about 40 TN rmb ($6.17 TN). The Red Line – “Pledge-Style Repos” – has ballooned four-fold since just early 2014 to surpass 40 TN rmb. So basically, in this popular market for inter-bank borrowings, borrowing banks have pledged bond positions larger than the entire market as collateral for their (perceived safe) short-term borrowing needs.
China has an historic Credit problem. It as well suffers from an unfolding “money” fiasco of epic proportions. My analytical framework attempts to differentiate the two, as each comes with its own set of (related) issues. A Credit Bubble is a self-reinforcing but inevitably unsustainable expansion of debt. Money (the contemporary variety) is a financial claim perceived as a safe and liquid “store of nominal value.” Importantly, systemic risk expands exponentially when risky borrowings are financed by an expansion of “money-like” instruments/financial claims. This typically occurs late (“terminal phase”) in the Credit Bubble Cycle.
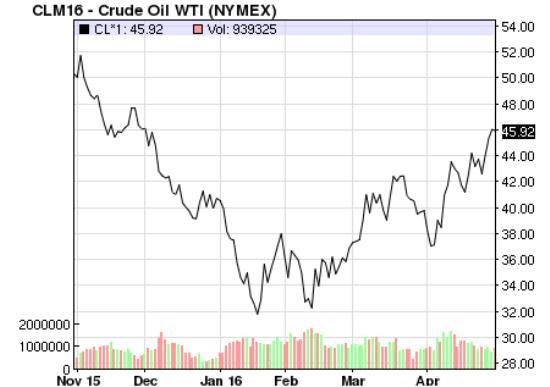
If the critics of China’s recent let-it-all-hang-out financial excess are right, a crisis of some sort is coming to a market near you. For instance, a fair bit of that Q1 $1 trillion went to boosting Chinese stockpiles — and therefore the price of — oil…
…and other commodities like iron ore. From More iron ore price madness as China’s mom-and-pops pile in:
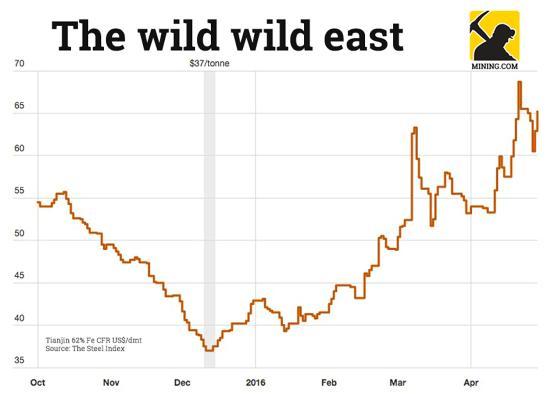
On Friday the Northern China benchmark iron ore price jumped to $65.20 per dry metric tonne (62% Fe CFR Tianjin port) bringing gains since Wednesday to 7.8% as commodity investment fever grips Chinese investors. Last week iron ore hit a 16-month high following an 11% jump over just two trading days according to data supplied by The Steel Index.
The steelmaking raw material has enjoyed a 52% rise in 2016 and a 76%-plus recovery from nine-year lows reached mid-December. On the Dalian Commodities Exchange the price swings are much wilder.
Despite a clampdown on rogue traders, higher margin requirements and trading fees, circuit breakers on Dalian iron ore futures to curb excessive price movement were triggered for the umpteenth time on Friday. That’s despite the exchange in northeast China “temporarily” upping the daily price change limit to 6%. The most traded contract ended Friday at its highs, exchanging hands for 462 yuan or $71.40 a tonne, duly up 5.97% on the day.
Based on supply/demand fundamentals, oil and iron ore remain in massive gluts. So when China’s stockpiling ends — as it mathematically must — these markets will lose a lot of their exuberance. The question then becomes, how many speculators will default on their loans, and what kind of banking trouble will ensue? That’s unknowable, but it’s safe to assume, given the numbers involved, that the rest of the world will find it distressing.
So think of today’s relative calm as the eye of yet another storm, and what’s coming as a return to the hyper-leveraged new normal.
 “I don’t pay any attention to China’s government officials’ numbers any more than I pay attention to America’s or Germany’s or Canada’s, for that matter. None of them really know, it’s all made up. I do know that things are getting slower in China, they have to. One of their largest trading partners, Japan, is in recession. Many European nations are in recession. Parts of America are slowing down. So if your customers are slowing down, certainly parts of China must be slowing down, and there has been over-building in China.…..continue reading HERE
related:


-
I know Mike is a very solid investor and respect his opinions very much. So if he says pay attention to this or that - I will.
~ Dale G.
-
I've started managing my own investments so view Michael's site as a one-stop shop from which to get information and perspectives.
~ Dave E.
-
Michael offers easy reading, honest, common sense information that anyone can use in a practical manner.
~ der_al.
-
A sane voice in a scrambled investment world.
~ Ed R.
Inside Edge Pro Contributors

Greg Weldon

Josef Schachter

Tyler Bollhorn

Ryan Irvine

Paul Beattie

Martin Straith

Patrick Ceresna

Mark Leibovit

James Thorne

Victor Adair