
Currency
In our Dec. 20 commentary, we discussed the outlook for the USD Index, Euro Index, and how these currencies were likely to impact gold. We summarized the essay by writing that the situation was bullish for the USD Index, and bearish for the euro. We wrote that the implications for gold were bearish. That was 10 days ago and we haven’t seen any big price swings since then (except for an intra-day decline in the USD Index, but we will move to that in just a few paragraphs). Has anything changed? Was there any kind of confirmation or invalidation that would increase the bullishness of the situation for gold? Or, perhaps, the situation is even worse now than it was before (despite a small move higher)? Let’s take a look (charts courtesy ofhttp://stockcharts.com).
From the long-term perspective, the outlook hasn’t changed at all and what we wrote on Dec. 20 remains up to date.
Despite a small decline that we have seen since the beginning of the month, the uptrend remains in place as the breakout above the declining long-term support line was not invalidated.
Now, let’s examine the weekly chart.
Looking at the above chart, we see that at the end of the week we had a situation similar to those that we saw earlier in December. Like a week ago, the USD Index broke below the medium-term support line based on the February 2012, September 2012 and January 2013 lows (bold black line), but once again this deterioration was only temporary. The dollar quickly rebounded and invalidated the breakdown below this medium-term support/resistance line, which is a sign of strength and a bullish factor. At this point, it’s worth mentioning that this time the USD Index didn’t decline to the lower medium-term line based on the September 2012 and January 2013 lows (thin black line), which confirms the strength of the buyers. From this perspective, there was no true breakdown and the trend remains up.
Let’s check the short-term outlook.
Looking at the above chart, we see that the USD Index extended its rally and moved higher breaking above both resistance lines (the horizontal support line based on the June low and the declining short-term resistance line) after our previous article was published. Although the greenback gave up the gains and declined in the following days, it confirmed the breakout above the declining short-term support/resistance line. At this point, we would like to draw your attention to the fact that although Friday’s intraday decline was sharp, it actually didn’t change much. The U.S. dollar moved below the declining short-term support/resistance line only very temporarily, without a breakdown in terms of daily closing prices, which is a positive signal. On top of that, this decline materialized right before the cyclical turning point.
This combination of factors creates a particularly bullish outlook and it could be the case that another rally in the U.S. dollar is just starting.
Let’s now take a look at the long-term Euro Index chart. HERE or the Chart for larger image:

The first thing that catches the eye on the above chart is the target area, which was reached once again. As you can see on the above chart, Friday’s intraday move took the Euro Index not only above the October high, but also the long-term declining resistance line based on the 2008 and the 2011 highs (in terms of weekly closing prices). However, as it turned out in the following hours, this improvement was only very temporary and finally, both breakouts were immediately invalidated. The currency index closed below these important resistance levels, which is a bearish signal and the outlook remains bearish.
What’s most interesting, gold didn’t follow that rally, which suggests that we’ll likely see further deterioration – similarly to that seen in the past.
In our previous article, we wrote the following:
(…) a similar situation preceded a local top in precious metals. On top of that, previous tops (in 2008 and then in 2011) were followed by major declines in the precious metals sector. If history repeats itself we may see similar price action in this situation.
Please take a moment to compare the euro’s performance in the past few weeks with the performance of the precious metals sector (lower part of the above chart).
Let’s take a look at our Correlation Matrix to find out how the above may translate into precious metals and mining stock prices.
The values of the correlation coefficients are basically unchanged from last week, so we will quote our previous comments – they are up-to-date.
Basically, the short-term numbers don’t tell us much at this time when we look at them directly, but can tell us something if we look a bit beyond them.
The correlation between the USD Index and the precious metals sector is slightly positive in the 30-day column (and even moderately significant in the case of the mining stocks), which tells us that in the past 30 days PMs and the USD Index moved on average in a similar direction. However, this was the case when they both declined – and when USD moved higher (this week), metals and miners declined even more. This is a very bearish combination – whatever USD does, the precious metals sector seems to either decline modestly or strongly.
Overall, the implications for the precious metals sector are bearish.
Having discussed the bearish impact from the currency markets (actually, even more bearish than last week because of the proximity of the cyclical turning point in the USD Index), the question remains if anything changed in case of the gold market itself. Click HERE or the image for larger view:

Not really. Generally, from the long-term perspective not much changed on the gold market. What we wrote in our previous article remains up-to-date as the breakdown below the rising long-term support/resistance line was not invalidated:
Gold didn’t manage to successfully climb above the rising long-term support line (not to mention staying above this line), which triggered a sharp decline. With this downward move, the yellow metal not only declined below last week’s low, but also slipped below the level of $1,200. These circumstances clearly show the weakness of the buyers and it seems that the previous 2013 low will be reached quite soon.
(…)
Please note that the exact target for gold is quite difficult to provide. In the cases of silver and mining stocks there are respectively: combinations of strong support levels, and a major support in the form of the 2008 low. In the case of gold, there are 4 support levels that could stop the decline and each of them is coincidentally located $50 below the previous one starting at $1,150: $1,150, $1,100, $1,050, and $1,000.
Summing up, looking at the current situation in both currencies, we are likely to see further deterioration in the Euro Index and improvement in the USD Index in the near future. As mentioned earlier in this section, the euro almost immediately invalidated both breakouts, which is a bearish signal. Additionally, the USD Index reversed course after a drop below the medium-term support lines (to be precise: similarly to what we saw last week, there was no true breakdown overall) and it seems that the bottom for this decline might already be in. On top of that, gold’s lack of will to really (!) react to positive news, like the dollar’s huge intra-day drop, is a bearish piece of information on its own and an indication that gold is likely to move lower in the short run – it seems that all it needs is a rally in the USD Index, which – as you can see above – will likely be seen shortly.
Thank you for reading. On behalf of the whole Sunshine Profits Team, I would also like to thank you for staying with us in 2013 and wish you a Happy and Prosperous 2014!
Przemyslaw Radomski, CFA
Founder, Editor-in-chief
Tools for Effective Gold & Silver Investments – SunshineProfits.com
Tools für Effektives Gold- und Silber-Investment – SunshineProfits.DE
* * * * *
Disclaimer
All essays, research and information found above represent analyses and opinions of Przemyslaw Radomski, CFA and Sunshine Profits’ associates only. As such, it may prove wrong and be a subject to change without notice. Opinions and analyses were based on data available to authors of respective essays at the time of writing. Although the information provided above is based on careful research and sources that are believed to be accurate, Przemyslaw Radomski, CFA and his associates do not guarantee the accuracy or thoroughness of the data or information reported. The opinions published above are neither an offer nor a recommendation to purchase or sell any securities. Mr. Radomski is not a Registered Securities Advisor. By reading Przemyslaw Radomski’s, CFA reports you fully agree that he will not be held responsible or liable for any decisions you make regarding any information provided in these reports. Investing, trading and speculation in any financial markets may involve high risk of loss. Przemyslaw Radomski, CFA, Sunshine Profits’ employees and affiliates as well as members of their families may have a short or long position in any securities, including those mentioned in any of the reports or essays, and may make additional purchases and/or sales of those securities without notice.

“In the year 1913, Congress gave the Federal Reserve the right to create and control US money. The Fed guards this power ferociously. The Fed prefers inflation, since it can easily control the rate of inflation. But the Fed is deadly afraid of deflation, since deflation can get out of control of the Fed.
Since 1980, the rate of debt has risen far past the growth in GDP. At some level, debt exerts a deflationary effect on the economy (GDP). We are past that point now, and deflationary pressures are bearing down on the US, this despite all the Fed’s money creation and manipulation of interest rates.
The question — How to reinflate the US economy? There is one method that was used in 1934 by the Roosevelt administration. That method is to devalue the currency against gold, the standard. This method was used by the US three times before. In 1934 the Roosevelt administration overnight re-set the price of gold from $20.67 dollars an ounce to $35 dollars per ounce.
Later, in 1971, the Smithsonian Agreement was reached which devalued the dollar from $35 an ounce to $38 an ounce. Again, and few people know this, in 1973 the US again unilaterally re-set the price of gold from $38 dollars an ounce to $42.22 dollars an ounce.
I believe that coming up we are going to see a fourth devaluation of the dollar against gold. By doing this the US Treasury will overnight have a vastly greater supply of wealth compared with its debt, putting its finances in a much healthier state.
How high might the US re-set the official price of gold? You pick a number — $5,000, $10,000 or $50,000, but the number should be high enough so that the price of gold won’t have to be re-set again in a hurry.
There are two problems with a re-set in the price of gold. (1) The government may decide to confiscate gold from its people. (2) There are arguments regarding how much gold the US Treasury actually owns. There have been no recent audits, and some of our gold may have been loaned out.
Question — If the dollar is to be devalued against gold, what might we do?
Answer — Many of the gold mines are now operating with thin margins as the cost of mining gold increases. If the price of gold is re-set higher, these thin-margin gold mines will explode higher in price. I doubt if the government would take over stock in the mines. But Congress could pass a law boosting taxes on mine profits.
Let me put it this way, I believe the government will re-set the official price of gold, but I don’t think there is a sure way, as an investor, to make a killing on a huge boost in the price of gold. Maybe the best recourse is to hold a small permanent position in position in GDX and GDXJ. Of course you can hold physical gold and keep it in an “out-of-the-way” place. Incidentally, I notice that some of the gold mining stocks are creeping higher, even on days when gold is lower.
You can be reasonably sure of one thing — certain insiders know what is being talked about and what is being planned. These may be the smart boys who are buying diamonds at $56 million and $125 million and great works of art at record prices. They are getting ready for a world of sky-high prices and hyperinflation.
… Now if all this could only help what’s left of the middle class. And if only the printers that print food stamps hold up. Get ready for massive changes in the year 2014 — And get ready for tremendous pressure to get rid of the Federal Reserve.”
To subscribe to Richard Russell’s Dow Theory Letters CLICK HERE.
About Richard Russell
Russell began publishing Dow Theory Letters in 1958, and he has been writing the Letters ever since (never once having skipped a Letter). Dow Theory Letters is the oldest service continuously written by one person in the business.
Russell gained wide recognition via a series of over 30 Dow Theory and technical articles that he wrote for Barron’s during the late-’50s through the ’90s. Through Barron’s and via word of mouth, he gained a wide following. Russell was the first (in 1960) to recommend gold stocks. He called the top of the 1949-’66 bull market. And almost to the day he called the bottom of the great 1972-’74 bear market, and the beginning of the great bull market which started in December 1974.
Letters are published and mailed every three weeks. We offer a TRIAL (two consecutive up-to-date issues) for $1.00 (same price that was originally charged in 1958). Trials, please one time only. Mail your $1.00 check to: Dow Theory Letters, PO Box 1759, La Jolla, CA 92038 (annual cost of a subscription is $300, tax deductible if ordered through your business).
 Quotable
“Everything we hear is an opinion, not a fact. Everything we see is a perspective, not the truth.”
– Marcus Aurelius
Commentary & Analysis
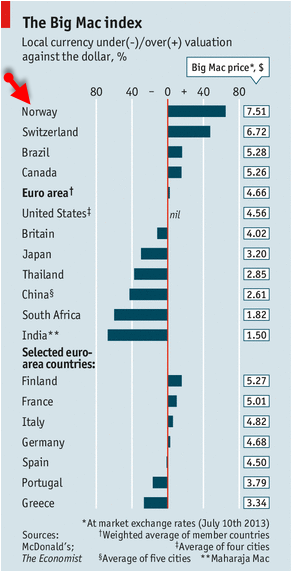
The most overvalued currency in the world.
So what is the most overvalued currency in the world? Well, according to the Economist Big Mac index the answer is the Norwegian Krone (see the index readings below from July 13th; the latest index I can find).
The Big Mac index shows the Krone is overvalued by a cool 65% against the US dollar. Okay, so what. This is a long-term measure that is useless from a trading perspective, you might be saying to yourself. But, consider the following…
- The Fed Taper will matter. It is at the margin stuff, but the Fed’s taper will likely matter as it relates to dollar-based credit and high-flying real asset prices (real estate) buoyed by debt. If you couple the taper with the impact of continued deflationary pressures in Europe, as banks there race to fortify their balance sheets, and add in the Bank of England will likely not be adding more juice given the better than expected improvement in the UK, mortgage money will likely become more expensive across Europe.
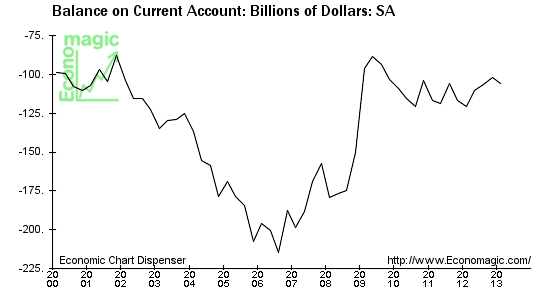
Above is a chart showing the US Current Account Balance. Though still in deficit, it effectively indicates that global dollar liquidity is draining off the world economies.
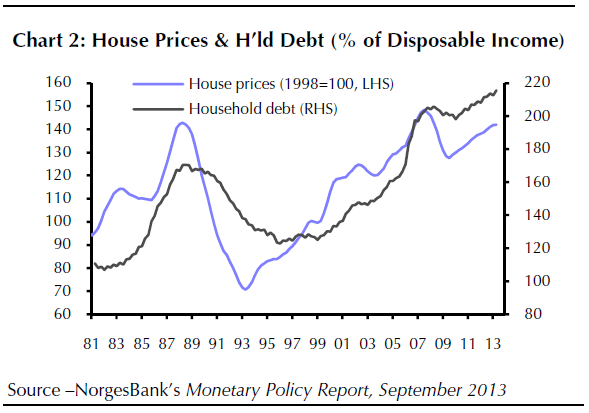
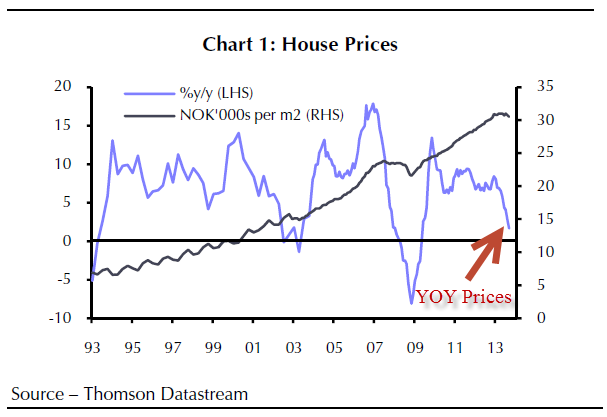
- Norway’s housing bubble is losing air fast and consumers are loaded with debt. When it comes to high-flying real assets, nothing has been soaring like the Norwegian real estate. And Norwegians’ have loaded up on housing debt. This is a recipe for a big decline in Norwegian consumption, as households will be forced to retrench as housing prices fall. We have seen this movie before; it’s called the new normal of below capacity economic growth. In short, the deflationary bear is stalking Norway.
From Bloomberg (12 Nov 2013):
“Norway’s housing market, which Nobel Laureate Robert J. Shiller described in 2012 as being in a bubble, is now deflating faster than even the central bank had predicted after regulators introduced a slate of measures to cool demand. After home prices doubled over the past decade, fueled by low interest rates and surging oil wealth, they’ve slid for two consecutive months raising concern that real estate could be in for a hard landing amid record household debt.”
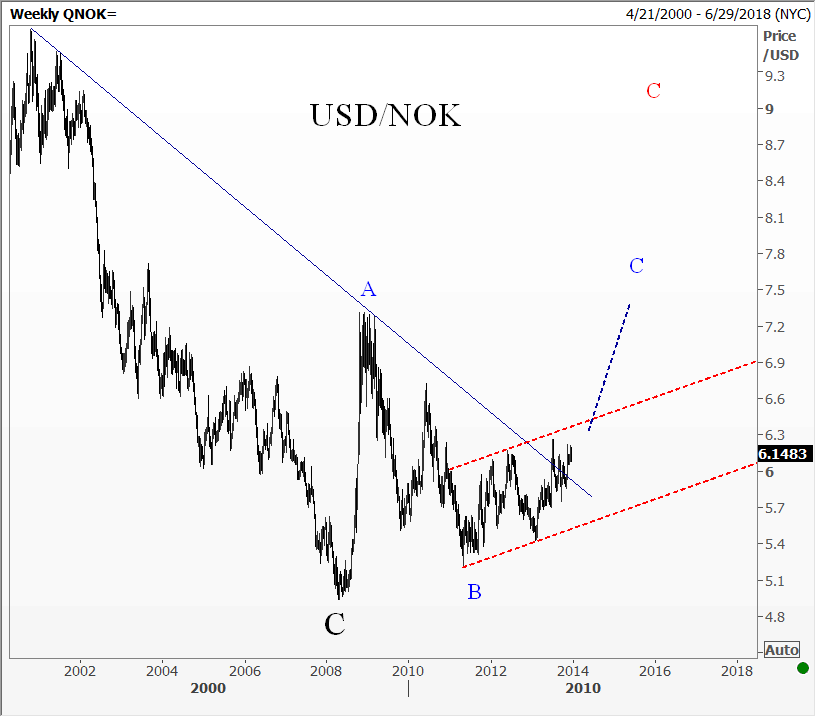
- The bottom for USD/NOK appears in place. As you likely know, my contention/conjecture/guess is the credit crunch was a sea change event in the global economy and marked the beginning of a multi-year bull market in the dollar. The Norwegian Krone seems to have put in a major long-term bottom back in early 2008 as along with many other currencies. Now the pair is channeling nicely higher.
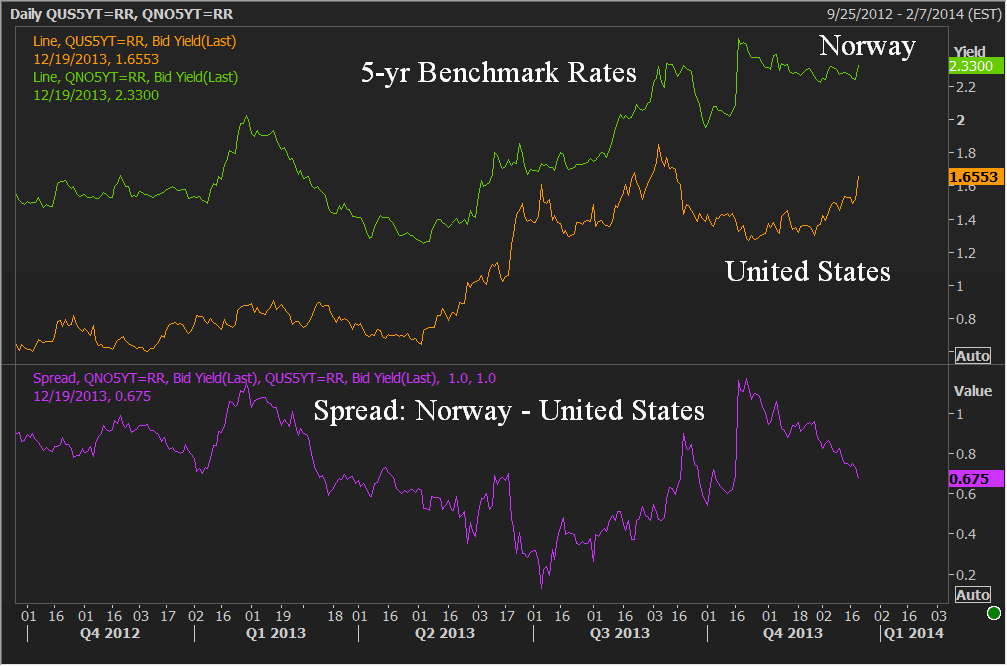
- Yield and yield expectations moving in favor of the United States. I do think yield spreads mater over the intermediate- to long-term now. They didn’t seem to matter much during the era of “risk on” and “risk off.” That era is gone. Now we are in the era of taper. And I think the fundamentals going forward likely favor the US over Norway, as US consumers have done much of the heavy lifting of debt liquidation while Norwegian consumers may be just getting started. If this proves true, it is likely the spreads across the curve will move strongly in favor of the US$.
That’s it in a nutshell. No doubt deflationary pressures are powerful across all countries. But given the catalyst of 1) popping of Norway’s housing bubble; 2) huge debt to income ratios for Norwegian households; it seems the 68% Big Mac overvaluation of the Krone will be eaten away by Mr. Market over time.
Jack Crooks
Black Swan Capital
Twitter: bswancap
———————Advertisement for our Forex Service————————
14 Reasons why you should subscribe to the Black Swan Forex service:
- Profitable – based on one lot trading, we have produced 2,085 pips for our subscribers this year
- Easy to understand
- Easy to follow
- Eliminates time
- Diminishes risk –
- Actionable trading signals
- Holding periods that make sense
- Ideas our subscribers can trade themselves
- We put our money where our mouth is
- We are there for our subscribers
- Can be traded automatically – through our auto-trading partner]
- We don’t play the hype game
- A proven methodology. Not guesswork [it is pattern analysis with fundamental considerations; we suggest trades based on patterns that produce higher than normal probability trading setups]
- We don’t issue signals just to produce action
————————————————————————————————————-

On a spike lower this morning the Canadian Dollar traded to lows (93.13) against the US Dollar not seen since May 26, 2010. That’s 3 1/2 year lows!
With commodities continuing to be out of favour, the Canadian Dollar will struggle. Highlighted by Golds lowest daily close since August 4th 2010.
Drew Zimmerman
Investment & Commodities/Futures Advisor
604-664-2842 – Direct
604 664 2900 – Main
604 664 2666 – Fax
800 810 7022 – Toll Free
Since at least the 1980s, US policy has been to convince us to borrow as much as possible on pretty much anything we could think of. This worked brilliantly until 2008, when homeowners, consumers and businesses hit a wall and private sector defaults began to exceed new loans. Another Great Depression was imminent.
But instead of allowing this natural cleansing process to run its course, governments around the world stepped into the breach themselves, borrowing tens of trillions of dollars to replace evaporating private sector debt. The idea, to the extent that there was one, was to buy time for traumatized consumers and businesses to relax a bit and start borrowing again.
This appears to be happening. The latest Fed Z.1 report shows overall US debt growing again, with the private sector leading the way.
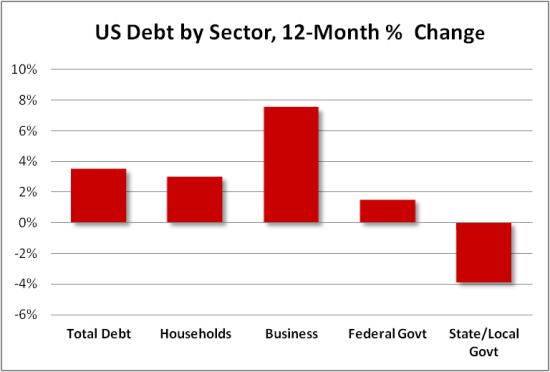
It’s not surprising that near-zero interest rates and trillions of dollars of newly-created currency would get people borrowing again. What is surprising is that anyone thinks this is a good thing. In 2013 total US debt, equity prices, household net worth, large-bank assets and derivatives books, and a long list of other debt-related measures pierced the records they set in 2007. In other words we’ve recreated the conditions that prevailed just before the world nearly fell apart.
Will the result be different this time? It’s hard to see how, especially since developed-world governments now have roughly twice as much debt as they did back then, so their ability to ride to the rescue will be limited.
As this is written the Fed is announcing that it will scale back its debt monetization to only $75 billion a month, or $900 billion a year. Its balance sheet, which just hit $4 trillion, will grow by nearly 25% in 2014, to nearly $5 trillion, which is a measure of how much new currency it is creating and pumping into the banking system.
The next stage of the plan is to get the banks to start lending this money, which would, through the magic of fractional reserves, produce loans in some large multiple of the original amount. So we might be on the verge of trading a nasty-but-comprehensible Kondratieff Winter for something a lot wilder.
continue reading& viewings HERE

-
I know Mike is a very solid investor and respect his opinions very much. So if he says pay attention to this or that - I will.
~ Dale G.
-
I've started managing my own investments so view Michael's site as a one-stop shop from which to get information and perspectives.
~ Dave E.
-
Michael offers easy reading, honest, common sense information that anyone can use in a practical manner.
~ der_al.
-
A sane voice in a scrambled investment world.
~ Ed R.
Inside Edge Pro Contributors

Greg Weldon

Josef Schachter

Tyler Bollhorn

Ryan Irvine

Paul Beattie

Martin Straith

Patrick Ceresna

Mark Leibovit

James Thorne

Victor Adair