
Market Opinion
Bensimon forecasting Gold to $2600 – Silver to outperform Gold substantially by a multiple of about 3 times!
To listen click HERE and scroll down to the David Bensimon Interview by Kitco’s Stanlie Hunt and click on either the MP3 image or the Window’s Media image.
(last on the list of interviews)
![]()
Silver has made strong gains over the past couple of weeks as gold has broken out upside from its Triangle, but this rapid progress has resulted in it arriving once again at the important resistance level in the $15.90 – $16.40 area in a critically overbought condition. It therefore stands to reason that it is likely to react back or at least consolidate before significant further gains can be made, especially as the Commercials were piling on the shorts last week – and this is only what we know about as the data is only available up to last Tuesday’s close, and it is fair to assume that they rose to even higher levels as silver rose sharply later in the week.
Silver Commitments of Traders Report Sept. 4th/009
Silver is therefore expected to react back next week, and possibly for somewhat longer, and if it does so we can expect many traders to be rattled by it. However, we will view it as a buying opportunity, provided that gold does not react back below the apex of its Triangle, which would be trigger a general sector sell signal. With gold expected to go on to break out to new highs and advance rapidly to the $1300 area, silver should proceed to break out above the resistance in the $16 area and advance to challenge its highs in the $21 area in due course.
Article posted in SilverSeek.com providing free silver news, commentaries, silver stock news, buying silver information and financial truth!
The weekly trend we have become accustomed to over the past month continued this past week as five-day period came in like a lamb and roared out like a lion.
For the past four weeks, it appears the markets have been stuck on repeat, as investors have gone home each Friday happy with their tidy profits in the rebound-rally and after careful consideration and a critical examination of the general economic outlook, decided to take profits early in the following week.
Just when it appears we are headed for a meaningful correction, the market latches on to a piece of decent news (in most cases data that was “not as terrible as expected”) and rallies by week’s end to close up on the five-day session.
This week (after an early week sell-off “better-than-expected” or not as bad as expected, depending on your point of view), job data in the U.S. and Canada helped power Toronto’s main index above the 11,000 mark. The Canadian economy created 27,100 jobs last month, Statistics Canada said on Friday, compared with a median forecast of 10,000 job losses in a Reuter’s survey of economists. What is not reported in the data is that much of the work created was part-time and a key component in manufacturing jobs, continued to decline.
But, who am I to rain on this parade. What we can do to profit and protect downside in this market is buy companies with solid growth, good cash flow, zero-to-no debt, strong cash positions, and with solid yields.
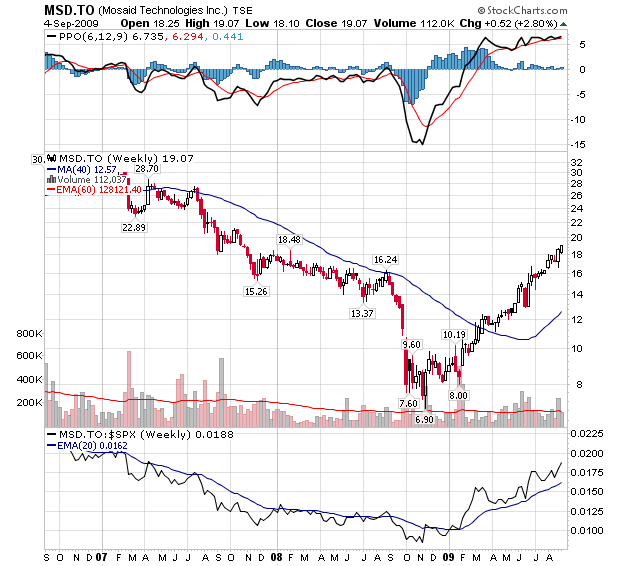
One such company that we have already made solid money on this year from our Canadian Small-Cap Universe (www.keystocks.com) is Ottawa-based MOSAID Technologies Inc. (MSD:TSX).
Founded in 1975, MOSAID Technologies Inc. has developed into a leading intellectual property companies. MOSAID develops semiconductor memory technology and licenses patented intellectual property in the areas of semiconductors and telecommunications systems.
This past week, the company announced its financial results for the first quarter of fiscal 2010, ended July 31, 2009. Q1 revenues rose 28 per cent to $16.2 million from $12.7 million in Q1 fiscal 2009. Q1 pro forma net income jumped 65 per cent to $6.6 million, or $0.63 per diluted share, from $4.0 million, or $0.37 per diluted share, in the same period of the prior year.
Looniversity – Father Index
Listening to the news these days, it seems one can’t go ten seconds without hearing a financial index quoted. Ever lay awake at night trying to figure out what they mean and when they started? Well, Bucks, thankfully, your sleepless nights are now over.
The first and consequently most widely quoted index was created back on May 26, 1896, and the man you can thank for it was none other than Mr. Charles Dow. At that time, the Dow index contained 12 of the largest public companies in the U.S. Today, the Dow Jones Industrial Average (DJIA) contains 30 of arguably the largest and most influential companies in the world economy.
Most of us financial types define an index as “a statistical measure of the changes in a portfolio of stocks representing a portion of the overall market.”
Because Mr. Dow created his index back when the abacus was still commonplace, it had to be kept as simple as possible. The original DJIA was calculated by adding up the prices of the 12 companies and then dividing that number by 12. Nice and tidy. While these calculations were actually more like an average than an index, it served its purpose.
Today, computers do most of the work and the indexes are much more accurate and complex. For example, many of the larger indexes now are based on the market capitalization (stock price * shares outstanding) of a company’s stock rather than the stock price alone. Many argue this practice tends to “weight” each company’s relative size and influence more effectively.
Remember, each stock index is slightly different. They include different types and amounts of stock.
Put it to Us?
Q. Can you give me the “411” on the “Dogs of the Dow” investment strategy?
– Daryl Andrews; Calgary, Alberta
A. The idea behind the “Dogs of the Dow” strategy is to buy those Dow Jones Industrial (DJI) companies with the lowest P/E ratios and highest dividend yields. By doing so, you’re selecting those Dow stocks that are cheapest relative to their peers.
In a nutshell, at the beginning of a given year, buy equal dollar amounts of the 10 DJI stocks with the highest dividend yields. Hold these companies exactly one year. At the end of the year, adjust the portfolio to have just the current “Dogs of the Dow.” In theory, what you’re doing is buying good companies when they’re temporarily out of favour and their stock prices are low. Hopefully, you’ll be selling them after they’ve rebounded. Then, you simply buy the next batch of Dow laggards.
Why does this work? The basic theory is that the 30 DJI stocks represent well-known, mature companies that have strong balance sheets with sufficient financial strength to ride out rough times. Some people use five companies, some use ten, some just one. You might call this a contrarian’s favourite strategy.
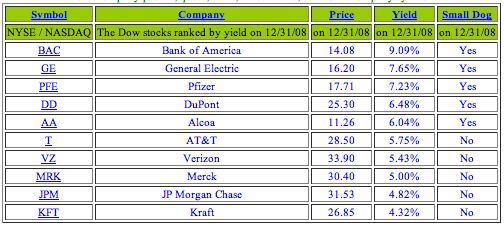
Ed Note: The 2009 Dogs of the Dow
The following table lists the ten highest yielding Dow stocks as of the close on December 31, 2008. These ten stocks are 2009’s Dogs of the Dow. Of these ten Dow stocks, the five stocks with the lowest closing price are 2009’s Small Dogs of the Dow.
Click HERE for a larger image.
KeyStone Financial is an independent financial advisor offering specific BUY/SELL research reports through our respected library of Canadian and U.S stock market investment publications.
Our independent research publications focus on uncovering companies that display “GARP” or Growth at a Reasonable Price. KeyStone’s publications provide both novice and sophisticated investors with reliable, objective and timely information on growing, profitable Canadian and U.S. publicly traded companies. We specialize in uncovering, before the broader market, under followed and undervalued small- to mid-sized stocks that are financially sound and producing solid growth in both revenues and earnings.
We put people before institutions – Providing initial coverage on some of North America’s fastest growing, yet undiscovered companies. In an investment world dominated by large banks and investment companies, our research publications offer a unique and completely independent research perspective invaluable in helping investors make informed portfolio decisions.
Our independent research focuses on uncovering companies that display “GARP” or Growth at a Reasonable Price. KeyStone’s publications provide both novice and sophisticated investors with reliable, objective and timely information on growing, profitable Canadian and U.S. publicly traded companies. From inception, we made a conscious decision to deliver professional style fundamental analysis of small-, mid- and micro-cap companies, a segment of the market typically ignored by traditional large financial institutions.
A hallmark of our research is independence. KeyStone is not affiliated with any bank or brokerage company, nor do its research publications accept any remuneration (cash or shares) for the inclusion of a company. Our purpose is to provide subscribers to our services objective information through independent research.
Both a product of our solid track record and a sign of standing in the small- to mid-cap market, KeyStone analysts are frequently quoted in respected publications, including the National Post, Calgary Herald, Investor’s Digest of Canada, and Canadian Money Saver, and make regular appearances on CKNW’s Money Talks with Michael Campbell, CBC Radio, ROBTV, as well as headline speaking engagements at several national conferences.
RUSH: Well, I’ll tell you what I think is going to happen. I read an Investor’s Business Daily editorial today, and thought I put it near the top of the stack, but I didn’t. It’s a fascinating little editorial about some of the plans the Obama administration has for energy in this country. And when I read this editorial, one of the things that I concluded was — here’s what it is. “The House of Representatives approved already a Senate-passed omnibus bill –” now, follow me on this “– that puts two million more acres of energy rich land off-limits. Last Wednesday, the House of Representatives passed on a 285-148 vote the Omnibus Public Land Management Act of 2009 (S.22), which confirms our theory that no good comes from legislation labeled ‘comprehensive’ or ‘omnibus.’ S.22 is a smorgasbord of 160 bills totaling more than 1,300 pages and, no, we’re not sure how many who voted for it actually read it. A stimulus bill it is not, for it locks up an additional 2 million acres to the 107 million acres of federally owned wilderness areas. That total is more than the area of Montana and Wyoming combined,” that are now off-limits for energy production.
Some of this area that has been placed now off-limits is among the most energy-rich in this country. It’s being placed off-limits. Now, we know that the Democrats are opposed to new drilling offshore. They’re opposed, as is Obama, to the creation and discovery of new domestic energy. Now, stick with me on this because this dovetails with the takeover of General Motors and Chrysler and the dictates that will result after whatever happens, either they take ’em over, there’s bankruptcy, restructuring, what have you. Obama knows that the tipping point to get you out of big cars is four-dollar-a-gallon gasoline. Obama said when the price of gasoline last summer got up to four dollars, he didn’t have a problem with it, he was just upset how quickly the price increases took place. So, Democrats and Obama restrict more of our own natural energy resources, placing discovery and usage off-limits, take over the automobile industry, say to General Motors, “Okay, 11 of your top 20 sales vehicles are showing a profit are SUVs and trucks but we’re going to change that with a political decision, not an economic decision.” ……full article HERE
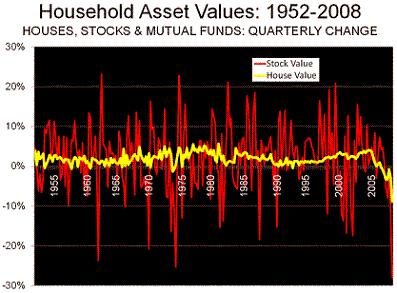
Just how bad is the current economic downturn? It is frequently claimed that the crash of 2008 is the worst economic downturn since the Great Depression. There is plenty of reason to accept this characterization, though we clearly are not suffering the widespread hardship of the Depression era. Looking principally at historical household wealth data from the Federal Reserve Board’sFlow of Funds Accounts of the United States, summarized in ourValue of Household Residences, Stocks & Mutual Funds: 1952-2008, we can conclude it’s pretty bad, but nothing yet like the early 1930s.
But this Panic of 2008 is no picnic. And in some key areas, notably housing, it could be even worse than what was experienced in the Great Depression.
Housing: It all started with the housing bubble that saw prices in some markets rise to unheard of levels, principally in California, Florida, Phoenix, Las Vegas and the Washington, DC area. Mortgage lenders, unable to withstand the intensity of losses in these markets caused by declining prices, collapsed like a house of cards. This precipitated the Lehman Brothers bankruptcy on Meltdown Monday (September 15, 2008) and a far broader economic crisis since that time.
Before the bubble, housing had been a stable store of wealth (equity or savings) for Americans. According to federal data, the value of the US owned housing stock increased in every year since 1935. The bursting of the housing bubble, however, brought declines in both 2007 and 2008, the longest period of housing value decline since between 1929 and 1933. The value of the housing stock was down 20 percent from its peak at the end of 2008. In some markets the losses amounted to more than double this amount. By comparison, the 1929 to 1933 house value decline was 27 percent. However, only one Great Depression year (1932) had a larger single-year decrease than 2008.
Indeed, between 1952 and 2006, the value of the housing stock never declined for more than a three month period. The bubble changed all that. The value of the housing stock has now fallen eight straight quarters. An investment that has been safe for most middle class Americans – the house in the suburbs – suddenly experienced the price volatility usually associated with the stock market, as is indicated in the chart below.
The resulting losses have been substantial. By the end of 2008, the value of the housing stock has fallen $4.5 trillion. In Phase I of the housing downturn, before Meltdown Monday, the largest losses were concentrated in the markets with the biggest “bubbles,”. But since that time the market has entered a Phase II decline, while a more general decline has characterized housing markets around the country in the fourth quarter of 2008. The decline continues.
California, the largest of all the states, has been particularly hard hit. New data for both the San Francisco and Los Angeles areas show price drops of approximately 10 percent in January, 2009 alone, as prices fall like the value of a tin-pot dictatorship’s currency. This decline, it should be noted, has spread from the outer ring of these areas – places like the much maligned Inland Empire region and the Central Valley – into the formerly more stable, and established, areas closer to the larger urban cores, which some imagined would be safe from such declines.
Sadly, there may well be some time before house price stability can be achieved. To restore the historic relationship between house prices and household incomes to a Median Multiple (median house price divided by median household income) of 3.0 would require another $3 trillion in losses, equating to a more than 15 percent additional loss. Losses are likely to be greater, however, not only in the “ground zero” markets of California and Florida but also other hugely over-valued markets, such as Portland, Seattle, New York and Boston. Of course, these are not normal times, and an intransigent economic downturn could lead to even lower house values than the historical norm would suggest.
Stocks and Mutual Funds: As noted above, stocks and mutual funds have been inherently more volatile than housing values. According to Federal Reserve data, the value of these holdings fell 24 percent over the year ended September 30. Based upon later data from the World Federation of Exchanges, we estimate that the value declined sharply after September 15, and at December 31 stood at 45 percent below the peak.
The household value of stocks and mutual funds has declined for five consecutive quarters, as of December 2008. There was a more sustained drop over six quarters in 1969-1970, although the decline in value was less than the present loss, at 37 percent. A larger decline (47 percent) was associated with the four quarter decline of 1973-1974. Comparable data is not available for household stocks and mutual fund holdings before 1952. The less complete data available indicates that the gross value of common and preferred stocks fell 45 percent from 1929 to 1933. As late as 1939, a decade after the crash, the loss had risen to 46 percent, indicating both the depth and length of the Great Depression.
The present downturn seems on course at a minimum to break the post-depression loss record with an overall decline at 55 percent as of February 20. This would correspond to a household loss of $8 trillion from the peak.
Consumer Confidence: The Conference Board’s Consumer Confidence Index reached an all time low of 25.0 in February, down a full one-third in a month. Even with its gasoline rationing, the mid-1970s downturn saw a minimum Consumer Confidence Index of 43.2. Normal would be 100; as late as August of 2007, consumer confidence was above 100. Consumer confidence is important. Where it is low, as it is today, there is fear and even people with financial resources are disinclined to spend. Confidence is a major contributor to economic downturns, which is why they used to be called “panics.” Restoring confidence is a requirement for recovery.
Government Confidence: If there were a federal government index of confidence, it would probably be near zero. This is demonstrated by the trillions that both parties in Washington have or intend to throw at banks, private companies and distressed home owners to stop the downturn. Never since the Great Depression have things become so bad that Washington has opened taxpayer’s checkbooks for massive financial bailouts.
How Much Wealth has been Lost: The net worth of all US households peaked at $64.6 trillion in the third quarter of 2007, according to the Federal Reserve Board. Since that time, it seems likely that the housing, stock and mutual fund losses by the nation’s households could be as high as $12 trillion – $4 trillion in housing and $8 trillion in stocks and mutual funds. This is a major loss and is unlikely to be recovered soon. Yet it makes sense to consider these losses in context. Unemployment is far lower than in the 1930s, when it reached 25 percent, and the Dust Bowl is not emptying into California (indeed, more than 1,000,000 people have migrated from California to other states this decade).
Born Yesterday Jeremiahs: It is fashionable to suggest that the current economic crisis is the result of over-consumption and an unsustainable lifestyle. The narrative goes that the supposed excesses of the 1980s and 1990s have finally caught up with us. In fact, however, even with the huge losses, the net worth of the average household is no lower than in 2003 and stands at 70 percent above the 1980 figure (inflation adjusted). This may be a surprise to “born yesterday” economic analysts.
The reality is that the country achieved astounding economic and social progress since World War II. The reality remains that even after the losses we are not, objectively speaking, experiencing Depression-like conditions. Critically, the answer to the question, “Are you better off today?” in 1950, 1960, 1970, 1980, 1990 and even 2000 is “yes”. This is a critical difference with the situation in the 1930s when the country overall was much poorer, and far less able to withstand such punishing losses.
Beware the Panglossians: Even so, it seems premature to predict that the economy will turn around soon. Some Panglossian analysts predict recovery later in the year or in 2010 seem likely to miss the mark by years. Remember analysts – particularly those tied to both the real estate and stock sectors – who have discredited themselves with their past cheerleading. In addition, the international breadth and depth of this crisis cannot possibly be fully comprehended at this time. Last week the Federal Reserve predicted a declining economy over the next year.
And even when the recovery starts, it is likely to be slow because of the public debt run up to stop the bleeding. When the recovery begins, the nation and the world will have to repay the many trillions in bailouts one way or the other. This can take the form of higher taxes, inflation, rising real interest rates or, if you can imagine, all three.
How Bad Is It? Bad Enough. The present downturn is not as serious as the Great Depression. Nonetheless, the Panic of 2008 is without question, the most serious economic downturn since the Great Depression. The real question is whether the government will react as ineffectively as it did back then, and prolong the downturn well into the next decade.
-
I know Mike is a very solid investor and respect his opinions very much. So if he says pay attention to this or that - I will.
~ Dale G.
-
I've started managing my own investments so view Michael's site as a one-stop shop from which to get information and perspectives.
~ Dave E.
-
Michael offers easy reading, honest, common sense information that anyone can use in a practical manner.
~ der_al.
-
A sane voice in a scrambled investment world.
~ Ed R.
Inside Edge Pro Contributors

Greg Weldon

Josef Schachter

Tyler Bollhorn

Ryan Irvine

Paul Beattie

Martin Straith

Patrick Ceresna

Mark Leibovit

James Thorne

Victor Adair