
Market Opinion

Today, the Labor Department reported that nonfarm payrolls decreased by 263,000 in September. As a result, today’s chart provides some perspective on the US job market. Note how the number of jobs has steadily increased (top chart) over the long-term. During the last economic recovery, however, job growth was unable to get back up to trend (first time since 1960). More recently, nonfarm payrolls have pulled away from its 50-year trend by a record percentage (bottom chart). In fact, the number of US jobs is currently at level first seen in early 2000. – via http://www.chartoftheday.com. Sign up FREE HERE.
Bucking The Trend?…It should be absolutely plainly obvious to everyone at this point that the direction of the dollar and many an alternative financial and physical asset class have been very highly negatively directionally correlated for some time now. This has been especially true over the last year of economic and financial market volatility and has been nothing but reinforced lately with the dollar assuming the role of global carry trade vehicle (notice how much foreign sovereign debt has been dollar denominated lately?). It should be no surprise as the US government has coincidentally been in the process of betting the fiscal and monetary ranch with its historic and unprecedented stimulus efforts. And at least according to the CBO (Congressional Budget Office) estimates for the forward US deficit released a number of weeks back, this is not about to stop any time soon. So the rise in many an asset class nominal price is as much about adjusting to and reflecting the reality of a declining dollar as it is about anticipating improving asset class specific fundamentals.
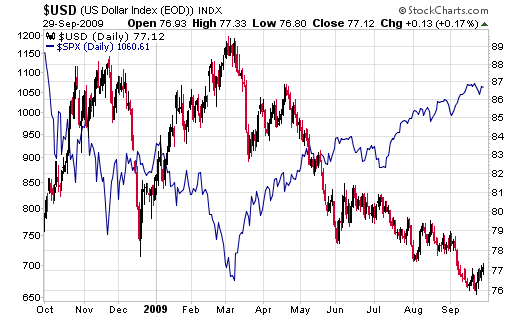
From a global perspective, in June we watched China sell the greatest dollar amount of Treasuries in one month on record, albeit a somewhat less than stunning 3% of their total holdings. So far, this is a one off event. Also on the global scene, the election in Japan last month may also mark a shift in policy regarding Japanese holdings of US dollars; we’ll just have to see how it all works out. In Japan , the landslide election of the DPJ (Democratic Party of Japan) was more a refutation of the LDP (Liberal Democratic Party) than an overwhelming affirmation of the DPJ, but the fact is that the DPJ has made noises about wanting the US to repay its borrowings from Japan in Yen. The DPJ has long criticized the LDP for its “closeness” to the US . Not exactly a dollar positive comment or political backdrop, now is it? And lastly as it pertains to the near relentless “adrift on a sea of government-sponsored liquidity” US equity rally of the moment, the very simple chart below simply confirms the importance of this negative directional correlation to the dollar. Although this relationship may be broken some time ahead for all we know, it sure seems to imply US equities require a weakening dollar for further northward movement.
…..read more and view more charts HERE

“At a time where Yves sees investment gurus shouting to steer clear of Treasuries and move into stocks, he feels that investors are being misled; he does not roll over to the common belief that stocks will outperform bonds from here as recent market and economic developments have prompted a change in investor attitudes.
ks?”
Quotable
“Arbitrary power is most easily established on the ruins of liberty abused to licentiousness.” – George Washington
FX Trading – Central Bankers Seek a Dollar Bottom; Bonds Favored Over Stocks?
The Bank of England last week made comments regarding some recent weakness in the British pound. It was seen as a potential boost to the UK economy as they’d love to resuscitate what external demand for their exports, albeit a relatively small portion of their economy.
There seems to be ongoing concern from the Swiss National Bank that the value of the franc is becoming too high, versus the buck and the euro. It has been stated that they will use the franc to help guide monetary policy.
In Japan, it seems to be a teeter-totter of comments that may or may not mean the Bank of Japan will take steps to stem the rise of the yen versus the US dollar.
And the latest among central bank intervention talk comes out of the EU, where Eurozone finance ministers are set for this weekend to discuss appreciation of the euro exchange rate.
The EU comments were icing on the cake and bring to light the concern among foreign policy-makers that their currencies have become too strong in light of the US dollar’s recent sharp decline.
Will that be enough to provide a bottom for the US dollar? Maybe in the short-term, at least. It could prompt traders and investors to cover their short positions, which could help to build some momentum to the upside.
Looking at the US dollar Index, 80 seems to be a good stopping point if this nascent correction has any legs. That level is an area of past support and resistance …

Looking at global economic fundamentals, nothing has really changed to favor the US dollar. Sure, we can draw on many of the same items that could eventually provide some fuel for a dollar rally if it gets a major risk-aversion bid. But the signs pointing to recovery continue to surface and lend credibility to optimists who are more than willing to take on risk.
But this change in sentiment among policy-makers could induce the US dollar correction that appears overdue. If this happens, then attention will turn to global market sentiment … looking for any obvious changes on the risk-appetite front.
_________________________________________________________________________
Yves Lamoureux – Blackmount Capital
Negative risk premium and return assumptions.
Yves Lamoureux of Blackmont Capital Inc. seems to think too much emphasis is being put on relatively minor shifts in risk appetite, specifically as it concerns the bond market.
At a time where Yves sees investment gurus shouting to steer clear of Treasuries and move into stocks, he feels that investors are being misled; he does not roll over to the common belief that stocks will outperform bonds from here as recent market and economic developments have prompted a change in investor attitudes.
ks?
The Bank of England last week made comments regarding some recent weakness in the British pound. It was seen as a potential boost to the UK economy as they’d love to resuscitate what external demand for their exports, albeit a relatively small portion of their economy.
There seems to be ongoing concern from the Swiss National Bank that the value of the franc is becoming too high, versus the buck and the euro. It has been stated that they will use the franc to help guide monetary policy.
In Japan, it seems to be a teeter-totter of comments that may or may not mean the Bank of Japan will take steps to stem the rise of the yen versus the US dollar.
And the latest among central bank intervention talk comes out of the EU, where Eurozone finance ministers are set for this weekend to discuss appreciation of the euro exchange rate.
The EU comments were icing on the cake and bring to light the concern among foreign policy-makers that their currencies have become too strong in light of the US dollar’s recent sharp decline.
Will that be enough to provide a bottom for the US dollar? Maybe in the short-term, at least. It could prompt traders and investors to cover their short positions, which could help to build some momentum to the upside.
Looking at the US dollar Index, 80 seems to be a good stopping point if this nascent correction has any legs. That level is an area of past support and resistance …
US Dollar Index, Weekly
Looking at global economic fundamentals, nothing has really changed to favor the US dollar. Sure, we can draw on many of the same items that could eventually provide some fuel for a dollar rally if it gets a major risk-aversion bid. But the signs pointing to recovery continue to surface and lend credibility to optimists who are more than willing to take on risk.
But this change in sentiment among policy-makers could induce the US dollar correction that appears overdue. If this happens, then attention will turn to global market sentiment … looking for any obvious changes on the risk-appetite front.
Yves Lamoureux of Blackmont Capital Inc. seems to think too much emphasis is being put on relatively minor shifts in risk appetite, specifically as it concerns the bond market.
At a time where Yves sees investment gurus shouting to steer clear of Treasuries and move into stocks, he feels that investors are being misled; he does not roll over to the common belief that stocks will outperform bonds from here as recent market and economic developments have prompted a change in investor attitudes.
Most market participants today still expect a positive risk premium for stocks even if extrapolating from recent past events results in confounding this expectation.
I expect bonds to deliver better or equal real returns with fewer risks than stocks going forward. Negative risk premium is the new normal and new behavioral shifts strongly underpin that case.
I had originally offered my case to buy the long bonds near the bottom of this cycle on the 19th June. http://yelnick.typepad.com/yelnick/2009/06/yves-on-the-greenshootfed-sacred-fed-bull-died-fat-and-happy.html
You create a spread of 4% or better between the Fed fund and the long bonds and in turn that becomes a trading buy signal. We had such a signal and ran with it.
We continued to run with this message digging further and came up with the primary dealers’ net treasury weekly positions graph in relations to bonds. What we found was most unusual. After averaging a net short position of -60 billions on average over many years, the primary dealers had suddenly turned bullish with net long treasury positions.
http://www.zerohedge.com/article/guest-post-observations-unusual-bond-deal-behavior
In this next graph, I use TLT as a proxy for long term bonds and TIP as the proxy to represent the Treasury inflation protected bonds. The recent recovery points to TLT showing greater strength and the clear conclusion is one of deflation reasserting itself or the lack of inflation thereof.
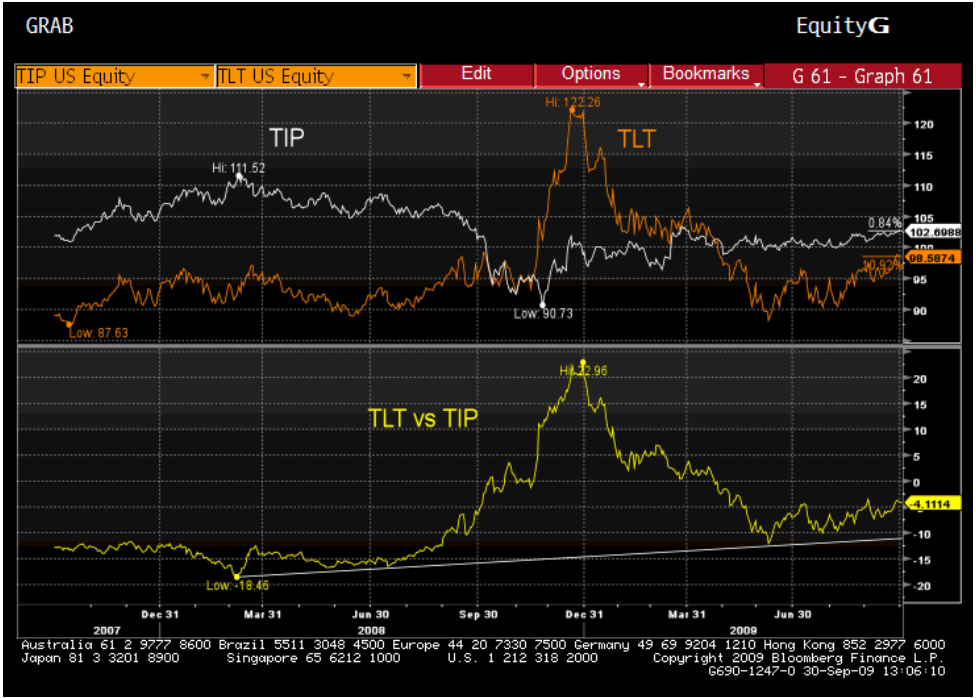
In a negative risk premium world you would expect to have bonds outperform stocks for total return and the yellow line here (below) where bonds are compared to the S&P500 is definitely up.

From both charts long bonds are definitely turning up or have put in a good base from which to launch upward.
In reference to behavior, it’s become clear that investors attitude are changing and the new normal is not to invest one’s savings in stocks rather that money is flowing to bonds. Recent data points to exactly this type of behavior and perhaps getting trounced once is enough for a certain legion of investors but not all. As we had seen in 2000 in every drop of stocks, we are slowly loosing participants to join in this exuberant party. Investors who miss out this time are also assured of not feeling any party hangover.
Yves Lamoureux,
Investment Advisor,
Blackmont Capital Inc.
John Ross Crooks III
Black Swan Capital LLC
www.blackswantrading.com
Black Swan Capital is an independent minded currency advisory firm established to provide subscription-based services to help retail and institutional clients consistently attain above average profits trading and investing in both forex and currency futures markets. We tell our Members when to enter and exit and why. HERE for more information.
Our commitment is to deliver well researched trading recommendations that our clients understand and can efficiently execute through their brokers. We outline the reasons to enter a trade and define the risk. But our Members must understand there is a substantial risk of loss trading in forex (off-exchange retail foreign currency) and currency futures markets.
Register HERE for the FREE Daily Currency Currents Newsletter.As a subscriber to Currency Currents you stay tuned-in to our current global-macro view and our analysis of key investment themes driving currency prices. Nothing is off limits to us in this free-wheeling look at the markets. Some days you’ll receive ramblings on trading psychology, while other days we may take an academic approach in explaining esoteric economic issues. Ultimately we have one goal in mind: to help you get a handle on the key investment themes driving global capital flow. Because if you know where the money is going, it increases the probability that yourposition in the market will be a profitable one.
In this Sept/October issue of Castlemoore’s Investment Newsletter “WASTING AWAY”:
By Ken Norquay, CMT & Partner
Learning from our investment mistakes is challenging, especially if we think later, once the pain is gone, that we don’t have to learn anything.
MARKET RALLIES AND TIMEFRAME
By Robert “Hap” Sneddon, PM, FSCI, President & Founder
The 2000-2003 bear market is very similar to the current state of markets and economics, yet it has some deeper issues that weren’t around back then.
THE CHART PAGES
A visual observation of some canaries in the coal mines, a few things we watch that maybe portend of the state of affairs down in the deep.
LIQUIDTY
By Sheldon Liberman, PM, CCO
There’s been lots of talk liquidity and cash on the sidelines, both oft talked about current and future drivers of markets, but what do they really mean now and in the future.
SEASONAL INFLUENCES ON THE MARKETS IN THE MONTH OF SEPTEMBER GUEST COLUMN By Don Vialoux, CMT, Timing the Market
Don’s looks at the month of September from a seasonal and historical perspective
“The financial industry normally reserves the word “crash” for a one-day occurrence. But, according to internet encyclopaedia Wikipedia, the 1929 crash actually occurred over 2 days. On October 27, 1929, the Dow Jones Industrial Index [DJII] closed at 298.66. It dropped 12.8% on October 28 and another 11.73% on October 29 to close at 230.07, for a total decline of 24.5% in two days. Years later, on October 19, 1987, the DJII dropped 22.6% in one day!
What defines a stock market crash? Consider autumn 2008. From early September to late November, the DJII dropped 35%! Shell – shocked investors were reluctant to open their month-end brokerage statements. Their retirement plans were in tatters. Although it had not been as dramatic as history’s one or two-day market crashes, the autumn 2008 drop had slashed a huge chunk out of people’s savings. “
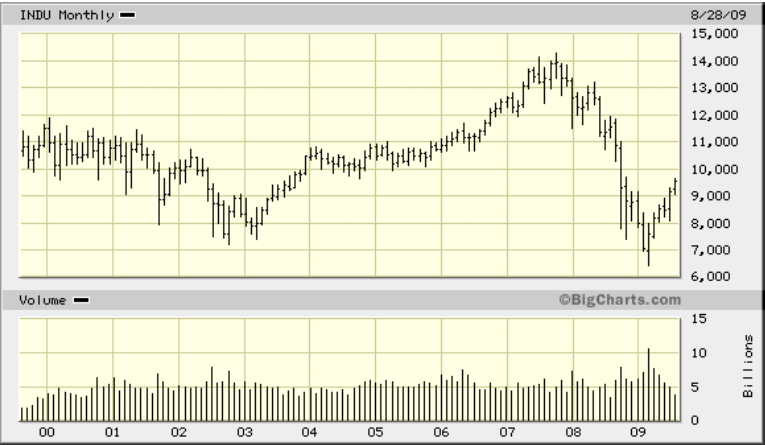
“It’s lower now than it was 10 years ago. Yet somehow the myth of “buy- and-hold-for-the-long-term” persists. That mantra seems to have a similar effect to Jimmy Buffet’s margaritas: it helps them forget. But even Jimmy seems to have learned something when he sings: “Yes, some people claim that there’s a woman to blame, but I know it’s nobody’s damn fault.”
…..read the whole 8 page report “WASTING AWAY” HERE

With second-quarter earnings largely in the books (over 99% of S&P 500 companies have reported for Q2 2009), today’s chart provides some long-term perspective to the current earnings environment by focusing on 12-month, as reported S&P 500 earnings. Today’s chart illustrates how earnings declined over 92% since peaking in Q3 2007, which makes it easily the largest decline on record (the data goes back to 1936). On the positive side, S&P 500 earnings have moved off their lows – slightly.
Quote of the Day
“Bureaucracy defends the status quo long past the time when the quo has lost its status.” – Laurence J. Peter
What is Chart of the Day?
Chart of the Day is a world renowned email newsletter devoted to providing professional money managers, investment advisors and individual investors with exclusive charts on a variety of financial markets and indicators.
How do I get my free Chart of the Day?
Simply enter and submit your email address (we won’t share it with anyone) and you will receive one free chart per week and instantly receive the latest free Chart of the Day.
Sign up for FREE Chart of the Day enter your email address HERE.
-
I know Mike is a very solid investor and respect his opinions very much. So if he says pay attention to this or that - I will.
~ Dale G.
-
I've started managing my own investments so view Michael's site as a one-stop shop from which to get information and perspectives.
~ Dave E.
-
Michael offers easy reading, honest, common sense information that anyone can use in a practical manner.
~ der_al.
-
A sane voice in a scrambled investment world.
~ Ed R.
Inside Edge Pro Contributors

Greg Weldon

Josef Schachter

Tyler Bollhorn

Ryan Irvine

Paul Beattie

Martin Straith

Patrick Ceresna

Mark Leibovit

James Thorne

Victor Adair