
Market Opinion
The gold price has swept past the US $1200 mark – in both directions – so it’s time to check numbers against concepts and patterns.
The yellow metal’s modern history began with Western economic expansion in the 19th century. That outstripped our ability to supply gold equivalent to economic activity, at fixed rates. With currencies delinking from gold by the early 1970s, miners couldn’t supply enough of it at the old fixed rates. Contrast that with copper which was in a supply glut at the time due to technological changes. Paper currencies were already a large multiple of gold horde values by this point.
Unfettered gold took one of the most incredible price runs in history during the 1970’s, peaking near 2500% above its old official US$ price in 1981. That brought bulk mining technologies to gold akin to those copper miners had used since early in the century, and a big increase in supply. That, plus selling from official hordes, pushed gold miners into the same cycle of profitable spurts sandwiched between longer red ink troughs that copper producers were already suffering.
The last spurt was the commodities run of the mid 1990s that dashed against the Asian Tigers currency based defaults in 1997. The long trough that followed shut down most generative work in the mining sector as a whole. It was unready for the boom of larger growth economies. As is typical, gold sat in the backseat while base metals lead off this “super-cycle”, but it was in the car.
Gold’s price has, in US$ terms, been in a staged advance since 2002. That steepened in late ’05 with a quick 40% run-up that was mostly about storing wealth in a boom period. There after gold shifted into a “traditional” hedge role.
The gain for gold from the “start-of-US-debt-worries” base in late ‘06 to the pre “all-hell-is-breaking-loose” peak in early ‘08 was also about 40%. An “Ok, now we’re-scared-@%#$less” reversal in mid ‘08 as instinct moved capital into the most liquid US$ market wiped out about 3/4 of that earlier gain. The gain this year from the “play-the-bounce” base of March has again been about 40%, in US$ terms. Is that that?
The answer to ‘that’ requires parsing the shift from “play-the-bounce” to “take-my-greenbacks-please” that has polished hard assets to a shine not seen for a century. Keep in mind the NZ$ and Australian$ have done even better than gold this year, which hasn’t stopped Australia from replacing the USA as number two gold producer this year. The CDN$ has done almost as well as gold despite Canada having low interest rates and important manufacturing ties to the US economy.
Gold is trading in line with a basket of mid tier currencies the market is warm on because of underlying commodity ties, and recent histories of prudent management. Of course one major difference between gold and fiat currency is the latter are usually leveraged by trading pairs. Gold is a counter trade, either one of two transactions or bought to store against further turmoil.
As a commodity, gold is doing less well this year than is copper which from bottom to, well now, is up about 125%. Silver’s percentage gain is twice that of its yellow cousin. This of course reflects the deeper discounts the other metals suffered last year. Copper has recovered only 70% of its peak value, and silver about 85% of its. Gold is almost 15% above its old high.
For some technicians it’s the last 15% (which was 20% at one point last Thursday) that really matters since it is well below the magnitude of earlier moves. Pre-Crunch moves of 40% had established new base levels at or near the peaks of those earlier runs. This time around gold was also coming off of a low created by Debt-Crunch selling, which we note again is the yellow metal doing its job as a crisis hedge. On the basis of previous oversold conditions, there would be room left in this uptick.
Lows and highs aside, the pattern looks similar to a typical cycle. Even in this atypical post-Crunch period the relative gains, and relative strengths, still has copper moving ahead of gold. However, in most cycles gold strengthens as base metals and the broader economy begin to flag on supply gains. Therein lies the current quandary.
As we’ve noted for the past few months, the continued strength of copper’s price is surprising us. Copper has better visibility than gold since the bulk of its available warehouse stocks are offered by a few markets. Clearly there has been little interest in betting against the red metal lately. It has been acting as a US$ hedge, and presumably with counter trades in place to dampen a market reversal. However, its producers have been moving sideways. That speaks to a lack of conviction about sustaining this price level, which we have agreed with and which still prompts us to look for copper price consolidation.
With gold the above ground hordes are not so visible. The official sector holdings can be added up, and the bulk of these central bank holdings are subject to either imposed selling restrictions or required consent before selling can take place. We doubt much of this gold is “spoken for” now that many miners have closed their hedge books and gold production loans are less prevalent, but some of it probably is already borrowed by speculators and unavailable for sale. Official sector net buying for the first time in a generation has in fact helped the gold price.
But private sector gold holdings are of similar scale, and intended sales are hardly likely to be trumpeted. That reality was evident when the building corporations in Dubai announced they were halting debt payments. The emirate has a major gold market and it seemed logical enough to assume gold selling would be part of a solution there. That abated when Abu Dhabi signaled it would work something out.
Friday’s selling was a more straight forward reversal of the greenback’s decline on news of strong US employment numbers. Whether that marks a trend it’s too soon to say. It won’t of itself mean the US debt issues are cleared up, and that has been the real basis for the US$ decline. It was time for some reversal and consolidation, and fortunately it came on good news.
The sentiment shift will be tested by the holiday shopping season amongst other issues. We hope these too show the US economy is improving. Though our bit of the market will mainly be governed by how well the growth economies are doing, the long process of paying for this decade’s party needs to get underway as quickly as possible.
It is that bill paying that will continue to be the economic focus, and for years to come. It is important to recognize that the reversal on Friday, a move into the US$ on good news for its economy, is quite different than the panic driven moves that had created previous upticks for the greenback. After a steep shift out of the US$ and into varied alternatives, the employment numbers became an event for gains taking.
This piece was supposed to be a warning that after a long steep run it was likely there would be some trade reversals in January on profits taking. Instead that is getting underway in time for seasonal shopping. We didn’t and don’t view the profits taking as a basic change to the trend line. Whether gold will rise enough to make this a 40% up leg we don’t know. But the gold market is trading in a fairly balanced fashion even after the move it has already had. Perceptions about the yellow metal have changed, to its benefit.
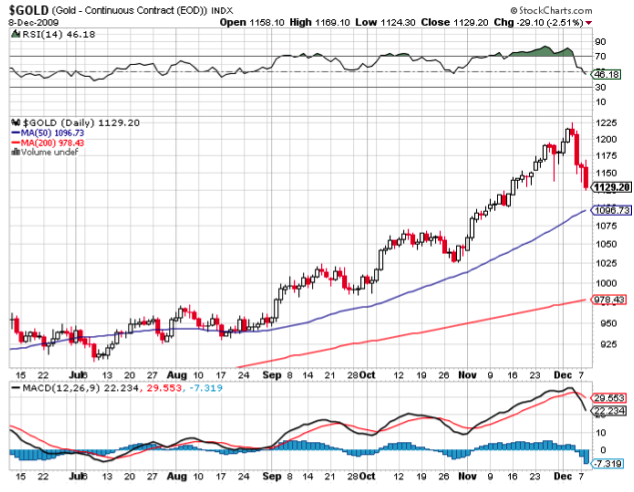
For all of the hand wringing and “I told you so” in some quarters the gold “crash” is all of about 8%. The 40 day moving average has been a pretty reliable base that gold has bounced off of several times on the way up. That
stands at about $1100 right now and hasn’t even been tested yet. If it holds, then a resumption of the upward move would not be long in coming. If it does not the 200 day average that has provided a floor on several larger dips in the past eight years would be the next target, at about $1000. In short, it’s a normal correction in a rising market so far.
The story isn’t much different for the Dollar. It has been a long one way ride down so a counter trend rally is no surprise. So far, it has not been an impressive one given some of the economic news in the US that started it came as a surprise to virtually everyone. Like the gold market, the greenback has had a couple of big days but doesn’t look like the longer term trend has been reversed.
We could see a more sideways trading pattern on the Dollar. If that happens it can’t be either praised or blamed for moves in metal prices. We think precious metals would fare better in that scenario than base metals, in the short term at least.
The relative lack of fireworks extended to the major equity markets. Most major indices really haven’t gone anywhere for a month or more. There is a sense that things are again in a holding pattern.
For the remainder of the year markets will increasingly be dominated by year end book squaring and positioning. We’ve noted several times this year that the major rally has been supported by surprisingly light volume. Participation has not been strong, but those funds that did get long early are looking pretty smart.
How the indices fare as the year closes out will be determined by the actions of the relative few that rode this rally. We expect funds that are long will be skittish, wanting to carry the gain through year end but ready to take profits on a moment’s notice to protect strong performance numbers. If we get through year end relatively unscathed we expect those same funds will be profit taking to lock in gains in January. It may take substantial good news to give the market a large lift early in the year.
In our own sector, metal prices will obviously be a factor, but we expect a smaller version of the trades described above to play out. There have been a number of very strong stories that look like they are ahead of themselves. Most were wise enough to use their market strength to carry out substantial financings. As we enter the New Year we suspect there will be profit taking in a number of these deals as that financing stock becomes tradable, and that money will be spread around on newer stories in the sector.
We expect M&A activity to continue ramping up. Mid sized companies that didn’t buy when the getting was cheap seem to be holding off waiting for a better ratio between their and their target’s share prices. Short of gold having a large move that is more than matched by the producer indices, we don’t think they will get their wish. At some point we expect them to just give up and bid. This will free up more capital in the space to pursue newer stories.
We’ll spend more time on the big picture items and what next year’s market may look like in the next issue. One last item we want to touch on here is year end tax loss selling.
There is concern that this years selling will be heavy, but we think it will be both light and quite selective. A look at last year’s chart of the TSX Venture makes it clear how vicious that selling was. Volumes were huge, as was the bounce the index had (20% in a week, more or less) as soon as the last day for tax selling passed.
We expect traders will be more interested in carrying gains through year end this time. The exception will be companies that had bad or no results this year. Look at the chart for your stock. If it goes upper left to lower right, than there may be more “lower right” before the month is over.
Ω
NEW DECEMBER HRA OFFER: To access Eric Coffin’s latest interview and to sign up for our Latest FREE REPORT, including HRA’s most recent new company extended review and subscription savings, click here: http://www.hraadvisory.com/qa01.html
Gain access to potential gains of hundreds or even thousands of percent! From March to June, HRA introduced four new gold explorers to subscribers. Those four companies have generated an average gain of +205%, to date!
The HRA – Journal, HRA-Dispatch and HRA- Special Delivery are independent publications produced and distributed by Stockwork Consulting Ltd, which is committed to providing timely and factual analysis of junior mining, resource, and other venture capital companies. Companies are chosen on the basis of a speculative potential for significant upside gains resulting from asset-base expansion. These are generally high-risk securities, and opinions contained herein are time and market sensitive. No statement or expression of opinion, or any other matter herein, directly or indirectly, is an offer, solicitation or recommendation to buy or sell any securities mentioned. While we believe all sources of information to be factual and reliable we in no way represent or guarantee the accuracy thereof, nor of the statements made herein. We do not receive or request compensation in any form in order to feature companies in these publications. We may, or may not, own securities and/or options to acquire securities of the companies mentioned herein. This document is protected by the copyright laws of Canada and the U.S. and may not be reproduced in any form for other than for personal use without the prior written consent of the publisher. This document may be quoted, in context, provided proper credit is given.
©2009 Stockwork Consulting Ltd. All Rights Reserved.
The big trends are often the hardest to identify. They are best seen on monthly charts. For instance, examine the two monthly charts below. The first one is the Dow going back to 2000. The second is gold going back to the same year. Where would you rather have been, in the Dow or in gold? The monthly charts often tell the story when nothing else does.
What to do? As I see it, the coming years will be the opposite of the period since the early 1980’s. By that I mean that the years from the early 1980s were years in which our efforts were confined to “making money.” As Richard Russell sees it, the years ahead we will be concentrating our efforts on NOT LOSING MONEY. This will be very difficult. The essence of it will be finding the safe haven area. Off hand, I believe the ultimate safe haven area will be gold. The losing area will be currencies including the dollar, and very probably bonds and stocks. The recognition of what I predict will be long and tedious. Nothing will occur over-night.
Comment after the close: On my Big Three, bonds were lower, the Dollar Index was and Feb gold was up 5.30 to 1126.20. Gold may have hit bottom yesterday. March silver confirmed gold, up 0.008 to 17.18. CEF and GTU both closed higher.
Richard Russell has made his subscribers fortunes. One of the best values anywhere in the financial world at only a $300 subscription to get his DAILY report for a year. HERE to subscribe. Richard has been Bullish Gold since below $300.
he 84 yr. old writes a market comment daily since the internet age began.
There is little in markets he has not seen. Mr. Russell gained wide recognition via a series of over 30 Dow Theory and technical articles that he wrote for Barron’s during the late-’50s through the ’90s. Russell was the first (in 1960) to recommend gold stocks. He called the top of the 1949-’66 bull market. And almost to the day he called the bottom of the great 1972-’74 bear market, and the beginning of the great bull market which started in December 1974. He loaded up on bonds in the early 80’s when US Treasuries where yielding 18%.
The above is a partial comment from the lengthy daily comment Richard Russell writes. One of the best values anywhere in the financial world at only a $300 subscription to get his report daily for a year. HERE to learn more and HERE to subscribe online.
Once again yesterday the dollar soared against all comers. Have a look at the movement of the US currency by 10 AM. It looks eerily reminiscent of the summer and fall of 2008 when the dollar soared and commodities swooned. In that go round there was a liquidation which very nearly spawned a 30s-styleglobal depression. Beginning last Friday with “cooked” unemployment numbers the dollar soared. This broke the back of gold and silver. Monday only a speech by Ben Bernanke turned that day around for gold. Yesterday gold swooned another $33. Today it is again down….
Click HERE and scroll down to see a larger table:

Gold is now entering a very healthy pullback. The yellow metal has now lost almost $100 (~8%) and silver has fallen 12%. You can see where support must kick in for gold in the following diagram.
Ed Note: $GOLD closed down a further $29.10 this December 9th Close
Both gold and silver are very likely to become buying opportunities. Many of you have emailed or called to ask is this the beginning of another meltdown. I do not think so! Gold was overbought. The dollar today is mixed. It is higher against the British Pound, Swiss Franc and S.A. Rand but lower against the Euro, the Ruble, the Loonie and the Yen. The bull market for gold is still intact.
We have heard numerous commentators suggest that because of this decline gold is not a safe asset yet over the past ten years gold has outperformed most markets.
For Michael Berry’s comment on REVETT MINERALS Click HERE
To sign up for Michael Berry’s Discovery Investing FREE letter go HERE. Michael Berry has been a portfolio manager for both Heartland Advisors and Kemper Scudder where he successfully managed small and mid cap value portfolios. Dr. Berry has specialized in the study of behavioral strategies for investing and has been published in a number of academic and practitioner journals. His definitive work on earnings surprise, with David Dreman, was published in 1995 in the Financial Analysts Journal.
Previously, Dr. Berry was a professor of investments at the Colgate Darden Graduate School of Business Administration at the University of Virginia and has also held the Wheat First Endowed Chair at James Madison University.
Dr. Berry is a respected and dynamic speaker. He regularly presents around the world on topics such as value investing, the role of Austrian Economics in investment management, behavioral investing strategies and is a specialist in developing case studies to teach investors how to invest. While a professor, he published a case book, Managing Investments: A Case Approach.
He has recently focused on the role of precious metals in the asset allocation of the individual investor.
“it came from a most unlikely place called theUS economy. US non-farm payrolls were down only 11,000 compared to an expectation of 130,000”
“Houston this morning broke a record with the earliest snowfall ever recorded in the city’s history,” the Houston Chronicle reported. Sure is good timing for the “global warming” nut-jobs who have made Orwell proud by changing the name of their movement to “climate change.” Now “climate change” kooks everywhere can tell us “I told you so” every time we see new records during the global cooling phase we are likely now entering. You just gotta love poly-science; it is so useful when molding a ridiculous world view so that lemmings everywhere can unite. You know who you are!
But there was another surprise today; it came from a most unlikely place called the US economy. US non-farm payrolls were down only 11,000 compared to an expectation of 130,000—that was a huge surprise? What was interesting is that we finally are seeing a day when after a question is asked, the answer isn’t, “Oh that’s easy, sell the dollar.”
Mr. Market did his thing again dishing out asset class surprises on the news. Today’s action and our brief comments to suggest this could be sustained…
Gold crushed – If scenario #3 emerges, our least likely but one we have expounding upon, which represents a US growth surprise, gold goes to $700 before it sees $2,000.
Euro slammed – Given the mess the Eurozone still has in front of them, they would love to see the euro fall against the dollar so Germany might be more willing to continue to subsidize Athens.
Yen mashed – The US growth scenario means the Fed will raise rates at some point before the Bank of Japan does; thus the yen moves back into its rightful role of key global carry trade currency.
Bonds battered – Yields look very low in a US growth surprise scenario—adjustment time.
Stocks stung? – Thinking about the idea that as the real economy recovers the stock market gets whacked. The logic is money flowing from the financial economy back into the real one. Sweet justice for sugar high Wall Street “free-market” types who never met government subsidized money they didn’t like.
Maybe this is just another one-day wonder. We can never underestimate the ability of the dollar to disappoint. But, if the “climate change” crowd can hang their hats on such flimsy and biased research, so can we.
Have a great weekend.
Jack Crooks
Black Swan Capital LLC
www.blackswantrading.com

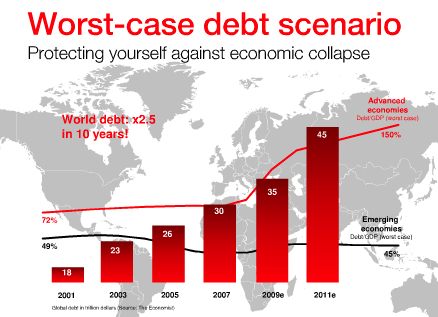
A few weeks ago, Société Générale, one of the oldest banks in France and the 3rd largest Corporate and Investment bank in the Eurozone, released a 68-page report entitled ‘Worst-Case Debt Scenario: Protecting Yourself Against Economic Collapse.”
In their report, they advised clients on how to prepare their portfolios in the case of a complete global economic collapse.
Hoping for the best, but preparing for the worst.
Under each category, they presented a bull and bear case for sector performance, highlighting the positives and negatives for each scenario.
What caught our attention in the report for specific sector performances was their view on Mining and Metals. In particular, Gold. Take a look.
Bear Economic Scenario:
“(Gold) should outperform commodity benchmark as gold would be sought out as a hedge against dollar risk .”
The report gave gold a positive outlook rating for both the short term (12 months) and long term (2 years) under a bearish economic scenario.
Bull Economic Scenario:
“Strong demand for inflation hedging and physical purposes should outweigh increasing supply .”
Even under the Bull scenario, the report gave gold a positive outlook rating and suggested that gold will outperform for both the short term (12 months) and long term (2 years).
Take a Look:
Société Générale Worst Case Debt Scenario Fourth Quarter Nov 2009
…..read more HERE.
What is Equedia?
Equedia is an investor relations firm, a dedicated social media platform for business, and a financial broadcaster of syndicated stock market content.
Companies click here
Investors click here
-
I know Mike is a very solid investor and respect his opinions very much. So if he says pay attention to this or that - I will.
~ Dale G.
-
I've started managing my own investments so view Michael's site as a one-stop shop from which to get information and perspectives.
~ Dave E.
-
Michael offers easy reading, honest, common sense information that anyone can use in a practical manner.
~ der_al.
-
A sane voice in a scrambled investment world.
~ Ed R.
Inside Edge Pro Contributors

Greg Weldon

Josef Schachter

Tyler Bollhorn

Ryan Irvine

Paul Beattie

Martin Straith

Patrick Ceresna

Mark Leibovit

James Thorne

Victor Adair