
Market Opinion
For more than a year, the “recovery” bounce in the stock market has refused to give up. The indexes have recovered more than 50% of what was lost. Technically, they look pretty good. What’s more, the S&P sells at more than 21 times normalized earnings, according to Robert Shiller’s latest tally. It seems like nothing can stop stocks now.
Then there’s the Treasury market. Overall, yields remain remarkably low. It is almost as if Treasury buyers are unaware that they are being asked to finance the biggest increase in sovereign debt ever. It doesn’t seem to matter either that many of the applicants for money will be incapable of repaying it. Several sovereign debtors, including the US, have already reached the “point of no return,” according to professors Rogoff and Reinhard.
Still, the financial press is optimistic. Economists are irrationally confident. Investors and advisors are overwhelmingly bullish. And the American public seems willing to add a trillion-dollar health-care program to its burdens – a sign of remarkable faith in the nation’s prospects.
So, let’s go back and reexamine our basic position. Is this really the “Great Correction” that we think it is?
If there is one lesson we’ve learned over the years, it is that we need to be patient. Things that have to happen generally do, sooner or later. You just have to wait. And when they happen, they generally happen much faster than you expected. Even when you’ve been expecting something for years, it can come and go before you realize what is going on.
You get used to being wrong…or at least premature. You wait. You watch. You think the time has come…and then: whoops…not yet. Pretty soon, you are overcome by anticipation fatigue. Then when the real thing finally does start to happen you don’t believe it. You wait to be sure…you hesitate…and then it’s over!
Just what am I waiting for? I’m anticipating more evidence of this Great Correction, including another big swing down in the real price of stocks, bonds and commodities…further deterioration in the real estate market…a falloff in consumer spending…and a higher savings rate.
I’m also expecting higher yields from government debt…and a dangerous intensification of financial problems in both the private and public sectors. If I’m right, those things must happen eventually. So far, we’re still waiting.
But this week the long-awaited turnaround in the bond market may have begun. Rates are rising along the entire yield curve, especially at the long end. “The bond market is now very close to saying, ‘We’ve had enough,’” predicts the octogenarian stock market technician, Richard Russell. The 30-year T-bond’s recent decisive move above 4.80% marks the end of a 25-year bull market in bonds, says Russell. Rates will be moving higher from here.
Investors are starting to tune into how sovereign debt works. And they’re starting to realize that even governments can default. In fact, almost all of them do default eventually. Yes, even governments whose debts are denominated in their own currencies default. And even when they have the power to print the currency themselves.
How could that be? Well, it is very simple and worth spending a little time on. I want to make two points:
First, governments will usually choose to default on their debt rather than risk hyperinflation of their currencies. Second, when they reach a “point of no return” they have no choice. They cannot cut back spending. Because even the most drastic cutbacks will not do the job. That would simply result in lower tax receipts and an even bigger deficit. At a certain point, the multiplier effect becomes the divider effect.
I’ve made the point many times that democracy seems hell-bent on self-destruction. America’s founding fathers noticed many years ago that when people realized that they could vote themselves money from the public treasury, democracy would be doomed.
Most people presume that if a politician offers benefits, “someone else” will pay for it somehow, someday. In practice, the money doesn’t come from additional taxes. Taxes are already, at least theoretically, at their optimal level. Higher tax rates produce lower economic activity, which lowers tax receipts. So instead of raising taxes, governments borrow the money. Then sovereign debt loads become larger and larger until, as Greece has recently discovered, they are impossible to carry.
America also has public sector debt problems – of about equal measure to Europe – and she has huge private sector debt problems as well. For the moment, the skies over the American financial markets are clear. But out at sea a hurricane is spinning faster and faster. There is a huge wave of debt defaults/foreclosures in the private sector that will hit the markets soon. This wave, combined with record borrowing from the US government, is bound to push up bond yields…making it harder than ever to get needed funding.
The situation with the US government is more complicated than it is with private borrowers – or even with Greece or California. The federal government can print money. But it, too, is ultimately at the mercy of the bond market. Last year Uncle Sam borrowed $2.1 trillion. This year it will borrow $2.4 trillion. Without this money, US government spending would have to come to a halt. The US counts on lenders. It needs lenders. Without them it would be forced to make cuts equal to about 10% of GDP. Think you’ve got de-leveraging now? Just imagine what that would do.
Typically, of course, government bond buyers don’t cut off a lender altogether. They merely demand a higher rate of interest to offset what they see as an increased level of risk. The higher interest rate adds to the borrower’s cost – increasing his deficit and forcing him to borrow more.
This is where it gets interesting. You might say that a government can “print its way out” – it can just print the money it needs rather than borrowing it. But what would happen if the US chose to print $2 trillion this year? It would risk hyperinflation. Lenders would run for cover. Prices would shoot up. The damage to the economy would be severe…so severe that only governments under extreme pressure – think Weimar Germany or Mugabe’s Zimbabwe – are willing to risk it. Instead, they try to muddle through, as Greece is doing now – promising budget cuts, making special financing deals and pushing up the rate of inflation a bit, but not so high as to cause panic in the bond market.
See, as long as the bond market permits it, debt levels continue to grow. But at some point – the point of no return – a government can no longer save itself from disaster. How does that work? Well, when deficit/debt levels are too high, the cuts necessary to bring the budget back in balance are so great that they squeeze the economy hard, reducing output and decreasing government’s tax revenues.
In this case, the government cannot escape. It has to print money. Or default. Most often, it will choose default, because it is the less painful solution. Either way, the government finds that it will be cut off from the bond market. Hyperinflation is merely an additional and unnecessary aggravation. (That said, I agree with Nassim Taleb, that hyperinflation remains an underestimated black swan risk.)
The underlying story of the economy has not changed. We are in a Great Correction. We don’t know exactly what it is correcting…but it looks as though it will at least reduce some of the leverage that has been added to American and British households over the last 60 years.
So far, the process is tentative…and unsure of itself. From a peak of 96% of household income in 2007 debt has fallen to…94%! The drop is so small that it makes you wonder if it is a trend at all. But if it is, it has a long way to go. Ten years ago – at the peak of the dot-com bubble – household leverage was only 70% of income. At the present rate it will take another 24 years to get back to 1999 levels.
Albert Edwards of Societe General has examined the non-financial leverage in the system. There is excess leverage of about 60% of GDP, he says. He calculates it will take a decade of “Japan-like pain” to eliminate it.
Either way, you’re talking about a long process of getting back to “normal.”
The Great Correction is also what is keeping housing and unemployment down. When the banks aren’t adding to the nation’s credit, you just can’t expect many new jobs or many new house sales.
Nothing has changed in the last week – except we have moved one week closer to whatever crisis lies ahead.
Bill Bonner
for The Daily Reckoning
Since founding Agora Inc. in 1979, Bill Bonner has found success and garnered camaraderie in numerous communities and industries. A man of many talents, his entrepreneurial savvy, unique writings, philanthropic undertakings, and preservationist activities have all been recognized and awarded by some of America’s most respected authorities. Along with Addison Wiggin, his friend and colleague, Bill has written two New York Times best-selling books, Financial Reckoning Day and Empire of Debt. Both works have been critically acclaimed internationally. With political journalist Lila Rajiva, he wrote his third New York Times best-selling book, Mobs, Messiahs and Markets, which offers concrete advice on how to avoid the public spectacle of modern finance. Since 1999, Bill has been a daily contributor and the driving force behind The Daily Reckoning .
Special Report:The Endless PAYCHECK PORTFOLIO: In three simple steps, unleash a steady flow of work-free income… starting with up to 75 automatic “paychecks” deposited directly into your account.
BEAUCOUP MOOLA
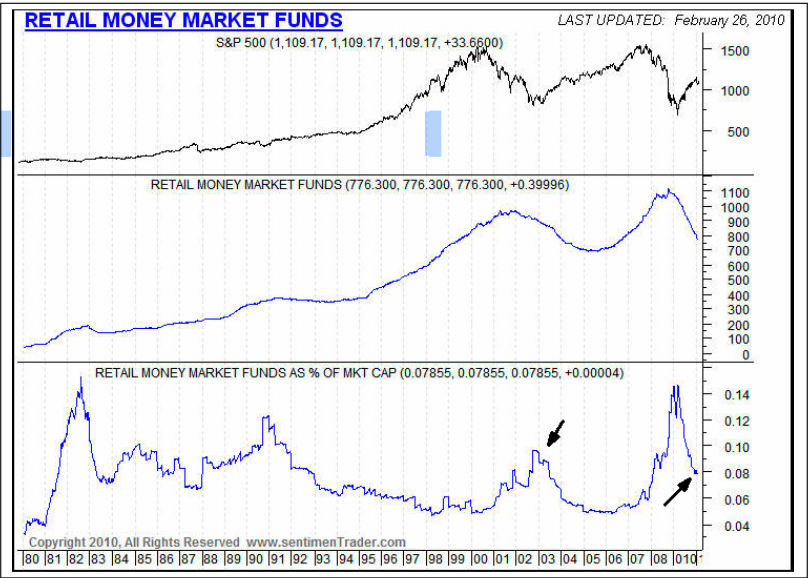
For a number of months I’ve been telling you that the market continues to look higher because of all of the money on the sidelines, much of it making less than 1%. Over time, a lot of these funds tend to find their way into the stock market.
This graph is courtesy of Jason Goepfert, of Sentimentrader.com. At the market bottom in 2009, retail money market funds as a percentage of market capitalization were as high as the major bottom in August of 1982 and we all know what happened after that.
Given this major liquidity event, it would appear that we are still owed a great deal on the upside.
Even now, with much of the liquidity having been dissipated, we are still almost as high as we were at the major bottom in 2003 (arrows).
Even with the major uptrend that we have already had, there remains a lot of skepticism. We have a name for what we’ve been experiencing. It’s called “climbing a wall of worry”.
Yes, there are a lot of economic problems, most specifically unemployment and we have an administration that doesn’t seem to be all that fond of private enterprise, but none of this matters right now.
Let’s look at history. The unemployment rate has only been higher than the current 9.7% for 16 out of the 764 months since January of 1948. That’s only 2% of the time. The worst readings during this period were the 10.8% unemployment rates in November and December of 1982, but by then the S&P 500 was already up 37% from the August lows and headed considerably higher.
We bring this up because so many pundits, even those who have been around long enough to know better, keep bringing up the economy as a reason to not own stocks.
Looking at the economy when trying to understand the stock market is not only useless, it is actually harmful. Stocks frequently go up when the economy is poor and down when it’s doing well. A stock may go up because of a profitable overseas operation that has nothing to do with the U.S. economy.
If you want to understand the stock market, then study the market. If you want to understand the economy, that’s a different matter. But be warned. Even if you get the economy right, you can’t buy 100 shares of GDP or short the unemployment rate, so how do you make money? After all that is our purpose.
Studying the economy is alright if you’re an economist and are hired by some company to do so. Yes, we do discuss economic news developments
on our nightly hotline, but only because it has a short term knee jerk influence on stock prices. This tends to dissipate rather quickly.
TODD MARKET FORECAST – April 2010
Stephen Todd
Registered Investment Advisor
e-mail –toddmarketforecast@charter.net
Phone 909 338 8354
P.O. Box 4131
Crestline, CA 92325-4131

How the Dow Has Really Performed When Measured in Real Money (Gold)
“Your cheating chart will tell on you.”
Hank Williams may not have known about Elliott waves, but he did know when a story doesn’t add up.
Such is the case with the nominal rise of the Dow Jones Industrials from 2000 to 2007. In the language of country music, this stock index has a “Cheatin’ Chart” — it doesn’t tell the real story.
Download Robert Prechter’s FREE 40-Page Gold and Silver eBook. This valuable ebook explores the role of gold in today’s markets like no other resource has attempted. You will get more than Prechter’s long-term outlook on gold and silver; you’ll also learn how gold still plays an important role in determining the real value behind nominal share prices. Learn more, and download your Gold and Silver eBook HERE.
You don’t have to tell Bob Prechter this: He knows. A simple price chart of the Dow is, well, a bit too simple. First Bob explains that pricing via fiat currency is not the same as pricing the Dow in terms of real money (namely gold). Then he shows the difference.
For six long years, we’ve had declining real values in stocks. Since the 2002 bottom, we’ve had rising values in nominal terms. This is the same set-up that we saw in the early ’70s except for one thing: it’s bigger. . .Ultimately, real prices are leading dollar prices, and we’re going to see a tremendous drop in the dollar price of the Dow as well, because I’m making a case that this is a much bigger top. – Elliott Wave Theorist, December 2006
If gold were our money, the major stock market indexes would have declined relentlessly from 2000 to the present, with a muted bounce in 2003. There would be no arguing the point of whether a bull or bear market was in force.
Elliott Wave Theorist, March 2006
This “oh-so-true” chart of the DJIA priced in gold showed the path that the “cheatin’” nominal Dow would eventually follow. Our forecast was that it’s just a matter of time. This analysis has played out as expected several times since the 1999 high in the Dow Jones Industrials.
The July 1999 top in the real Dow was the first in a long succession of rolling blow-offs that (The Elliott Wave Financial Forecast) successfully identified From the DJIA’s orthodox top in 2000 to the NASDAQ’s all-time high several weeks later to the top in residential real estate prices in 2005 to the nominal peaks in major stock indexes in 2007 to the wild commodity spikes in 2008, EWFF managed to anticipate many of the markets major trend changes. . .We owe these forecasting successes to the Wave Principle and its reflection of market psychology and its foreshadowing of larger social forces. – Elliott Wave Financial Forecast, July 2009
The monthly Elliott Wave Financial Forecast keeps a tireless eye on stocks, real estate, commodities and much more. We also keep track of the precious metals and the dollar — and even keep our finger on the pulse of developing social trends.
The quotes above confirm the power of Elliott wave analysis in identifying market turns in various asset classes.
Download Robert Prechter’s FREE 40-Page Gold and Silver eBook HERE. This valuable ebook explores the role of gold in today’s markets like no other resource has attempted. You will get more than Prechter’s long-term outlook on gold and silver; you’ll also learn how gold still plays an important role in determining the real value behind nominal share prices.
Elliott Wave International (EWI) is the world’s largest market forecasting firm. EWI’s 20-plus analysts provide around-the-clock forecasts of every major market in the world via the internet and proprietary web systems like Reuters and Bloomberg. EWI’s educational services include conferences, workshops, webinars, video tapes, special reports, books and one of the internet’s richest free content programs, Club EWI.
I’m a contrarian. When everyone loves gold, I hate it. When everyone hates the dollar, I love it. I called for a top in gold and silver and by inference, a bottom in the dollar, at the end of November 2009. I was immediately battered to death with criticism, threats and a public keelhauling by one of the manipulation crowd. The level of venom made it obvious to me that I was right. And of course, I was.
I won’t get bombarded this time, I’m telling people what they want to hear. And that’s a shame because people’s reactions are what tell me when I am right or not. I see the dollar getting toppy.
Gold has been interesting. It was really getting carried away and was a classic example of irrational exuberance by the 1st of December and screaming to correct but very few people saw it. The permabulls were calling it a Commercial Signal Failure. I don’t know what that means and I suspect they don’t either. They just made it up. They call it a Commercial Signal Failure every time gold hits a top. But they were screaming “Buy, buy.” I’d love to know how much money they lost their followers this time.
All markets, bear or bull, have regular corrections. Gold and silver are no exceptions. Gold had a perfectly normal and predictable correction. Gold is no more manipulated than any other financial market. Gold shares peaked in early December at the same time as gold. Gold shares are still exceptionally cheap in historical terms given that the POG is still very high. Any gold company that can’t make a lot of money at $1100 gold needs to be raising moose.
I think a top in the dollar is at hand. I’m not even sure it’s correct to say the dollar went up, in reality, the Euro went down. But as many problems as the Euro has, the British Pound and US dollar are going to crater as well. It’s just that in the race to the bottom, the Euro has on a temporary basis been going down faster.
I think gold has pretty much finished its correction, the permabulls are all muttering to themselves about manipulation. That’s always a good sign for gold. Gold shares are historically cheap, as cheap as they were in 2001 and 2002 with far lower prices for gold and silver. The number of visitors to our site is a great reflection of just how interested people are in gold. Our numbers are the lowest in 18 months. People don’t value gold right now.
I went to PDAC a few weeks ago. I dread going to any of the gold shows. There are simply too many stories to keep track of. I know less when I leave than when I arrived but it does give me a chance to get a feel for what ordinary investors are doing. For the first time in 9 years, I saw ordinary new investors and I got a sense that the gold market is changing.
For one thing, I’ll predict a lot of consolidation in the next year. There is a lot of money floating around looking for a safe haven and what could be safer than gold? I think the big news will be takeovers; lots of them and that will put a floor under the price of metals shares.
But the public is interested and I think will be buying in a big way. While I think there is a great risk of another deflationary default on an international basis, I don’t see there being a lot of risk in gold and silver shares. They have already been walloped.
I saw a few companies that really interested me. I bought shares in the ones I liked and some are or will be advertisers so I’ll make the traditional disclaimer. Your profits are not shared with me and neither should your losses. Take some responsibility for your own investment decisions. I’m human and my opinions are as biased any anyone else.
One of the real stories was that of Arco Resources (ARR-V) located in Oaxaca Mexico near the San Jose mine of Fortuna Silver. The management of Arco was associated with the San Jose mine and they know the area well.
I think of Arco as a concept stock. The stock has a clean history; it only came public three years ago but failed to get traction. The company management is very experienced in the Oaxaca area and have picked up what they believe are the best projects around the area, many have had prior production.
I wish they hadn’t had to do a financing at $.05 recently as the existing shareholders got whacked but I was a buyer on the open market at $.05 when I heard the story and I was a participant in the PP. Arco has enough money in the kitty to give drilling a serious go. If they hit what they and I hope they hit, the stock will run. But in the $.05-$.06 area it’s a cheap lottery ticket with a lot of potential.
If you are a believer in owing a US based project, Premium Exploration (PEM-V) should be on your target list. They have a minable resource in Idaho with 531,000 ounces of gold in the inferred category already at Friday-Petsite and another 100,000 ounces at Buffalo Gulch (great name). The project is on a major regional structure some 28 km long with a lot of blue sky potential.
I met with management of PEM in Toronto and I like the project and the management a lot. The company is well cashed up, they are drilling in elephant country and if you perceive the US as being a safe climate to invest in, you won’t find many companies with this kind of blue sky and such a small market cap. It’s a medium priced lottery ticket.
If you are a long time reader of 321gold and can remember back to when I wrote about Pebble many years ago, when I went to Toronto, I came across the next Pebble. The company is called Kiska Metals (KSK-V). Kiska did a deal with Rio Tinto on a giant block of land 90 mines NW of Anchorage. They have 527 square km of Alaska State mining claims and a 50-person camp.
The deposit is a gold-rich, copper porphyry. Within the main Whistler zone, they have 5.75 million ounce AU equivalent resource in inferred and indicated combined. It’s a district and they have new gold discoveries 23 km south and 17 km east south east of Whistler. With a $48 million dollar market cap, you are buying gold in the ground for less than $10 an ounce and their discovery costs are less than $4 an ounce.
Kiska has a one time back-in deal with Rio that should be triggered in the 1st half of 2010. Rio can back in by repaying double Kiska’s expenditures and agrees to fund the project through pre-feasibility to earn 51% and can earn another 9% by funding and advancing to a production decision.
In either case, Kiska wins big. I was the first guy to write up Northern Dynasty and this is another giant porphyry target. I was impressed with the management of Kiska, the company is funded for a major drill program and a lot of uncertainty will be removed once Rio announces their decision. The stock is very very cheap right now and is a perpetual call on both gold and copper.
The last stock of this report is by far the most interesting because it is so unusual. First Bauxite (FBX-V) was founded by Ioannis (Yannis) Tsitos, veteran of 18 years with BHP Billiton. While at BHP, Yannis looked at hundred of different projects and completed more than 50 JV agreements with various companies on behalf of BHP.
Mr. Tsitos saw an opportunity in a high-grade refractory bauxite only found in a few places on earth. China controls the market and allows only a small amount of this special bauxite to be exported every year. Russia, India and Brazil produce the high-grade bauxite but only produce enough for their own demand. First Bauxite has their projects located in Guyana.
If you are familiar with minerals, you may recognize the name bauxite. It is the mineral used to produce aluminum. However, the refractory bauxite deposit located by First Bauxite is used as a flux in the production of steel, cement, glass and furnaces. It’s far more valuable than ordinary aluminum ore.
Where ordinary bauxite is valued at about $35-$50 a ton, what is termed Refractory Calcined Bauxite (RASC bauxite) is worth $400-$500 a ton. That’s the same as having a half ounce gold grade or 30 ounce silver.
FBX plans for early stage production of 100,000 tons per year bauxite. They expect to complete the feasibility study in the 1st quarter and begin production as early as Q2/2011 with a production cost of less than $200 per metric ton. FBX anticipates revenue of over $26 million in 2011.
First Bauxite is a great example of someone understanding the economics of mineral production. The company has picked a highly profitable niche market with little competition. Management really impressed me. The company is selling at a potential 1.5 times next year earning. Naturally there will be dilution to finance production but this is one of the most attractive juniors I saw at PDAC.
Obviously I have not gone into great detail on any of these companies. I don’t want to bore readers silly and the companies have done a pretty good job of telling their stories on their websites. I encourage any potential investors to look into the company closely before investing but I liked them a lot.
Arco Resources
ARR-V $.06 (Mar 29, 2010)
ARRXF-PK 96 million shares fully diluted
Arco Resources website
Premium Exploration
PEM-V $.335 (Mar 29, 2010)
61.8 million shares
Premium Exploration website
Kiska Metals
KSK-V $.85 (Mar 29, 2010)
KSKTF-PK 56.6 million shares
Kiska Metals website
First Bauxite Corporation
FBX-V $1.25 (Mar 29, 2010)
FIBCF-PK 45.3 million shares
First Bauxite website
###
Bob Moriarty
President: 321gold
Stockscores.com Perspectives for the week ending March 28, 2010
In this week’s issue:
Weekly Commentary
Strategy of the Week
Stocks That Meet The Featured Strategy
![]()
The breakout. In its simplest form, it occurs when a stock hits a new high, moving through a price ceiling that has held up for some amount of time. Stocks that are strong must eventually break out so it is understandable that a very basic trading strategy is to buy stocks that are making breakouts. However, I have found that trading with just this simple criterion is not a good way to make money. To use breakouts as an entry signal, you have to add other criteria.
Let’s first make sure we understand what dynamic is in place when a stock breaks out. If a stock is hitting a price that is higher than it has seen for some time then the market is really saying that the fundamentals are better than they have been for some time. Investors are willing to pay higher prices because they believe that the company’s business is worth more. So, breakouts are significant because they represent a change in the perception that investors have about the company’s ability to make money in the future.
That is why I like considering breakouts; there is something significant fundamentally behind them. However, it is important that we find a way to differentiate between breakouts caused by emotion and those caused by information.
Better trading opportunities occur when investors are motivated to pay a higher price because of new information rather than emotion. Higher prices caused by emotional investors chasing a hot stock higher are likely to see a correction and actually represent a good short selling opportunity.
So, when considering breakouts, we need to have techniques that help us separate the emotional breakouts from the informational breakouts. (more below)
- Get the StockSchool Pro Free

- DisnatDirect named the number one Canadian brokerage for Traders by Surviscor! Open and Fund a brokerage account with DisnatDirect and receive the StockSchool Pro home study course free, including special Pro level access through the DisnatDirect client website. Offer only available to Canadian residents. For information, click HERE
This is actually quite simple to do. When a market is emotional, there will tend to be price volatility. By that, I mean that price will be changing day by day. Typically, an emotional breakout to the upside will be preceded by an upward trend where investors are eagerly buying the stock. So, the first rule of breakouts is to not buy them when they are preceded by price volatility.
Instead, we want to focus on stocks that have been trading in narrow, normal trading ranges. If a stock is trading sideways and has a pretty boring price pattern then the breakout represents the beginning of something. New information has shocked the buyers in to paying more. Informational breakouts are best when they come from periods of sideways trading.
When assessing breakouts, we also need to determine if the breakout has real buyer power behind it. Moving a stock to higher prices requires buyers motivated by greed. If that is lacking, then the stock will sink lower as sellers take profit. So, breakouts to the upside must be accompanied by volume, for volume is the fuel of the buyers. Stocks have a hard time going up without volume, although they can fall lower without it.
Breakouts will have difficulty evolving in to upward trends if there are people who own the stock at higher prices. These people have been losing money on the stock and are likely frustrated with holding it. As a result, they are more likely to sell the stock when it gets back to what they paid for it. So, when analyzing a breakout, it is good to consider how long it has been since the stock has traded at this price. I find that breakouts are more reliable if they represent a move to at least a two year high.
Finally, we need to think about the mood of investors because, even though information can cause a breakout, a sustained trend needs investor optimism to keep it going. Therefore, it is important to look at the shape of the pattern in to the breakout so we can understand who is in control of the market. Rising bottoms indicate the buyers are in control, falling tops show the sellers are in control. Upside breakouts are best preceded by investor optimism as shown by rising bottoms.
To summarize, the best breakouts are those motivated by new information that justifies investors paying a higher price. Breakouts from sideways, low volatility trading with strong volume supporting the breakout, rising bottoms in to the breakout and up to prices that have not been seen for two years will have the best potential for an upward trend.
![]()
This week, I did a Stockscores Market Scan with the following criteria:
Price < $10
Abnormal Volume
80 day resistance = breakout
Number of trades < 100
This brought up 22 candidates, of which two stand out:
![]()
1. V.NDX
V.NDX has been trading under resistance at $0.24 for a few months but broke through it on Friday with abnormal volume. The stock has no resistance to hold it back, looks like it can continue higher from here unless support at $0.20 is broken.
2. LSE
I picked LSE in the daily newsletter a few months ago and it has been slowly climbing but stuck in a sideways trading range under $5 resistance recently. Friday it broke through that price point with strong volume support. Good chance it can move up toward $8 in the months ahead. Support at $4.65.

References
Get the Stockscore on any of over 20,000 North American stocks.
Background on the theories used by Stockscores.
Strategies that can help you find new opportunities.
Scan the market using extensive filter criteria.
Build a portfolio of stocks and view a slide show of their charts.
See which sectors are leading the market, and their components.
Click HERE for the Speaker Lineup and to Purchase the video if you want to learn from some of the worlds best traders including Tyler Bollhorn.

Tyler Bollhorn started trading the stock market with $3,000 in capital, some borrowed from his credit card, when he was just 19 years old. As he worked through the Business program at the University of Calgary, he constantly followed the market and traded stocks. Upon graduation, he could not shake his addiction to the market, and so he continued to trade and study the market by day, while working as a DJ at night. From his 600 square foot basement suite that he shared with his brother, Mr. Bollhorn pursued his dream of making his living buying and selling stocks.
Slowly, he began to learn how the market works, and more importantly, how to consistently make money from it. He realized that the stock market is not fair, and that a small group of people make most of the money while the general public suffers. Eventually, he found some of the key ingredients to success, and turned $30,000 in to half a million dollars in only 3 months. His career as a stock trader had finally flourished.
Much of Mr Bollhorn’s work was pioneering, so he had to create his own tools to identify opportunities. With a vision of making the research process simpler and more effective, he created the Stockscores Approach to trading, and partnered with Stockgroup in the creation of the Stockscores.com web site. He found that he enjoyed teaching others how the market works almost as much as trading it, and he has since taught hundreds of traders how to apply the Stockscores Approach to the market.
Disclaimer
This is not an investment advisory, and should not be used to make investment decisions. Information in Stockscores Perspectives is often opinionated and should be considered for information purposes only. No stock exchange anywhere has approved or disapproved of the information contained herein. There is no express or implied solicitation to buy or sell securities. The writers and editors of Perspectives may have positions in the stocks discussed above and may trade in the stocks mentioned. Don’t consider buying or selling any stock without conducting your own due diligence.
-
I know Mike is a very solid investor and respect his opinions very much. So if he says pay attention to this or that - I will.
~ Dale G.
-
I've started managing my own investments so view Michael's site as a one-stop shop from which to get information and perspectives.
~ Dave E.
-
Michael offers easy reading, honest, common sense information that anyone can use in a practical manner.
~ der_al.
-
A sane voice in a scrambled investment world.
~ Ed R.
Inside Edge Pro Contributors

Greg Weldon

Josef Schachter

Tyler Bollhorn

Ryan Irvine

Paul Beattie

Martin Straith

Patrick Ceresna

Mark Leibovit

James Thorne

Victor Adair