
Bonds & Interest Rates
“I have little doubt that with excess savings, new stimulus, huge deficit spending, more QE, a new potential infrastructure bill, a successful vaccine, and euphoria around the end of the pandemic, the U.S. economy will likely boom. This boom could easily run into 2023 because all the spending could extend well into 2023.” – Jamie Dimon, CEO JP Morgan Chase
There are many problems with this view looking forward.
To begin with, the vast majority of American’s do not have excess savings. If they did, then repeated stimulus payments wouldn’t be needed to support economic growth. The reality is “savings” get skewed by the top 20% of income earners, notably the 0.01% like Jamie Dimon.
The top 5%, of income earners skew the measure. Those in the top 20% have seen substantially larger median wage growth versus the bottom 80%. (Note: all data used below is from the Census Bureau and the IRS.)”
Since the top income earners have more than enough income to maintain their living standards, the balance falls into savings. This disparity in incomes generates the “skew” to the savings rate and obfuscates the ability to “maintain a certain standard of living.”
More Stimulus Not The Answer
Such remains problematic for many Americans and consistently forces them further into debt.
“The debt surge is partly by design. A byproduct of low borrowing costs the Federal Reserve engineered after the financial crisis to get the economy moving. It has reshaped both borrowers and lenders. Consumers increasingly need it. Companies increasingly can’t sell their goods without it. And the economy, which counts on consumer spending for more than two-thirds of GDP, would struggle without a plentiful supply of credit.” – WSJ
I often show the “gap” between the “standard of living” and real disposable incomes. In 1990, incomes alone were no longer able to meet the standard of living. Therefore, consumers turned to debt to fill the “gap.”… CLICK for the complete article
Record Breaking Month in Greater Vancouver for Home Sale Prices & New Monthly Listings
Yet another record month for the Greater Vancouver housing market. The average cost to purchase a detached property inside of REBGV increased by $89,000. Bringing the average to $1.958M. This was aided by the continued high sales totalling 1,973. Accumulating the second largest sale total in the history of Greater Vancouver real estate. In attempts to capture the newly minted growth phase in home prices, sellers came to the market in droves. Setting the new record with 3,368 newly listed detached properties in March. The record amount of activity to kick off the spring market is likely to continue as March through May are typically the busiest months of the year.

Home sale prices continued their escalation beyond the previous market cycle. Amazingly, another $89,000 was added to the average sales price from the previous month. The new record price of $1.958M represents a 7% gain over a two month span. The 7% growth is the first increase above the previous market cycle which had held home values range bound for 5 years.
The biggest gainers this past month were Pitt Meadows up an incredible $233,000 month over month, representing an astonishing 20% increase. The average property in Pitt Meadows is selling for $1.44M. Vancouver West rose $500,000 up 14%, bringing the average price to $4.025M. The standout of the gainers over the past two months is Whistler. This past month over $600,000 was added to the average price. Couple that with the $900,000 increase from the month previous, and Whistler has increased over $1.5M in just the past two months. The recent spike in value has increased the averages price to over $4.325M for a detached property in Whistler. The massive increases to these areas have aided the REBGV average price to gain distance between the price point and the aggressive uptrend instigated during July 2020.

Breaking beyond the 5 year price boundary has been clearly aided by the supply demand imbalance. March 2021 just recorded the second largest imbalance between the two market metrics on record. The total gap between the supply versus demand during March was 3.6. Falling just 2 basis points below the all time high which occurred during March 2016 with a 3.8 gap. Interestingly, previous to the past month the second largest discrepancy occurred during April 2016. This implies buyers are unlikely to receive any reprieve in the short term.

As forecasted over the previous months, sellers are entering the market with full force. A record setting total of over 3,300 properties were listed in last month. March 2021 represents only the 4th instance where new listings accumulated over 3,000 in a single month. Should the high new listings count continue to rise through spring and into the summer months, home values will likely realize a near term price peak during the summer.
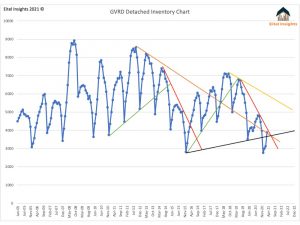
Even with a record amount of new listings, the total inventory continues to remain in the doldrums of the chart. A glimmer of hope would be the total inventory of 3,886 is attempting to break out of the 3 year immediate downtrend (Red trend line). Established during June 2019 when there was over 6,700 active listings. The enormity of new listings only resulted in a net of 880 total active listings compared to the previous month. However should inventory continue to grow a the 29% as was the case in March. The key figure of 5,700 active listings is well within reach by the late summer, or early fall.

Sales fell just short in completing a trifecta of records during March. The 1,973 sales were only 177 shy from the all time high achieved during March 2016 of 2,150 sales. With the abundance of new listings coming to market, the buyers snatched up the choice properties, and continued in the bidding war mentality which pushed the average sales price to over 101% of the asking price. This is only the 9th instance in which sales price was over 100% of the asking. Of those previous 8 instances they all occurred between December 2015 – July 2016. Implying the next several months of data could result in a continuation of the sales prices being higher than the asking prices.
Importantly, all subsections of the market are now selling. Over the past year the entry level homes have been selling at a frenzied pace, that has worked all the way up to the luxury market. March realized 49 properties that sold over $5M. The 49 sales is an increase of 250% compared to the preceding 3 year average of 14 sales per month. The prices of the luxury market is still not quite back to the peak conditions of 2017. As the averages sales price was $8.6M. However the average sales price in March of $7.6M, is up over $1.6M from the low recorded in May 2020 of $6M.
Dane Eitel
Founder & Lead Analyst
EitelInsights.com
Low supply and high demand have pushed lumber prices through the roof, but European beetles are helping.
Wood is typically used for building roofs. Now it’s known for blasting through them.
Lumber prices are up nearly 260% since April 2020, following a perfect storm of surging demand and diminished supply.
And it all started with a simple backlog…
At the start of the pandemic, sawmills anticipated weak demand and limited production by up to 30%. To their surprise, demand turned out stronger than ever:
- DIY boom: While the US economy shrank 3.5% in 2020, spending on home improvements and repairs grew 3%+
- Low interest rates: In December, US new housing starts hit a 14-year high
Despite wood production hitting a 13-year high in February, supply hasn’t caught up with demand — and now ~70% of builders are raising home prices to slow demand down.
The result is a $24k+ increase in the average price of single-family homes since April 2020.
European beetles are now coming in clutch
Not those European beetles. A literal beetle infestation across Europe is boosting logging there, and Europe’s share of US lumber imports reached a record high of 13% in 2020.
Those imports are critical to the US lumber supply as British Columbia has reduced production by over a third in 5 years.
In conclusion… (We wanted to end this piece with a joke about lumber, but we just couldn’t think of any that wood work.)
CPI Basket Case
On Sunday on ‘60 Minutes’, Fed Chair Powell said “We can wait to see actual inflation before we raise interest rates.” Well, today is the US inflation report. The market consensus is headline prices will rise 0.5% m/m, which would be around 6% y/y annualised, and on a straight y/y basis CPI will go from 1.7% to 2.5%. Of course, excluding food and energy CPI is seen rising just 0.2% m/m, or around 2.4% annualised, and up from 1.3% to 1.5% y/y. Yet the Fed won’t see any actual inflation in those numbers. When it comes to inflation, what one does and doesn’t see is all political.
For example, we are currently seeing a housing boom in many economies, most so in Australia, on the back of ultra-low interest rates. What do central banks and regulatory bodies say when house price inflation is, say, 5%, or even 10% – let alone 30% as in Oz? Answer: nothing. Once upon a time they had to do something – but then we removed accurate measures of house prices from CPI, so now they don’t. It isn’t happening, or isn’t their remit. True, they can waffle about financial stability, and in the case of the odd outlier like New Zealand (and on/off in China), the government can force action from the central bank. Yet until that revolution is imposed globally –in the same ‘yes,-that-is-going-to-happen’ way the US wants minimum corporate tax rates to be– house-price inflation just is what it is. As such, is it any wonder that such a vast slice of the US, Chinese, European, Aussie, etc., economies are focused on endless property speculation?
How about stock prices? Can anyone remember back to Alan “Bubble Boy” Greenspan and his empty warning of “irrational exuberance”? Indeed, can anyone remember the last time a major central bank deliberately raised interest rates in order to slow down an ascent in stocks, because this was inflationary? Conversely, does anyone seriously think that stocks could ever fall significantly before our monetary authorities slashed interest rates (where they still can), or boosted QE further, or did “whatever it takes” to get them to go back up again? So clearly not much fear of inflation there – just deflation.
Of course, there is wage inflation. Nowadays there are more frequent and widespread calls to ‘Build Back Better’ and ‘level up’, and recognition that this involves higher pay. (Just not for NHS workers in the UK, who were initially offered 1%). Even the US Treasury Secretary is using quasi-Marxist terminology of “labor vs. capital”. However, since the neoliberal reforms of the late 1970s/early 1980s, wage inflation has not been tolerated by central banks – outside of finance and after-dinner speaking fees of USD250,000 a pop. Any sign of general salaries going up to, say, 5% or even 10% is terrifying, was met with an immediate response of higher interest rates.
Yes, central-bank rhetoric has now changed: but it’s easy to say one is willing to let wage rises happen when one is also aware that the economic structure will not allow it! You can’t sit on rates or yields or talk about “labour vs. capital” and expect wages to just go up. You need to *strengthen* the bargaining power of labour vs. capital. How do you do that without empowering unions/weakening the power of firms? How do you do that while allowing off-shoring and free trade, because the logical response will be to shift production elsewhere. And how do you stop capital replacing labour, i.e., automation? Our global system is designed to ensure we don’t get general wage inflation. Slashing rates, QE or even YCC are performative in a political vacuum: but, handily, they produce higher house and stock prices.
Meanwhile, expensive Aussie house prices and cheap rhetoric are not the only things growing 30% y/y. As the US CPI report will probably only partially show, so are food and energy costs. I wrote recently about geometric vs. arithmetic means and hedonic adjustments made to the CPI basket that keep it lower than it feels for most people. One other what-you-see-and-what-you-don’t impact in the same basket I didn’t mention is periodicity.
How often do you buy a TV, for example? The price of those has come down when one adjusts for quality, and even in absolute terms. Yet my own experience is that if I am buying more than one every five years, I am pretty angry about it. The same goes for key pieces of furniture and lots of other items where our neoliberal system *has* seen prices come down (and Western supply chains and jobs shift to Asia in tandem). By contrast, how often do you buy food? How often do you fill up your car with petrol/gas, or buy something delivered by somebody who did? Inflation fails to capture this time distribution effect. Everything around you that you need to buy today is going up in price rapidly – but don’t worry: something big you might not need to buy until 2028 is going down in a hedonic-adjusted price. Sit back and feel the savings.
All this neoliberal deliberate (“neo-liberate”) stupidity was perhaps tolerable before 2008-09 because most of the population was in a debt- and housing-fuelled stupor. Even with far more somnolent monetary policy being lavished on us today, that is no longer the case. Especially for those who can’t afford to fill up their cars; or buy the same foods they used to be able to; for those who can no longer find somewhere affordable to live in a country like the US or Australia, which are hardly short of land – talk about “labor vs. capital” to labor looking at the price of a home anywhere near a capital; or for those trying to do DIY/construction to avoid moving home and seeing eye-watering price-spikes. (Check out social media for more timely and accurate measures of what people are *actually* paying for key inputs than the BLS will provide today.)
When one then throws in the combination of drought in the US and voracious commodity demand in China –and Wall Street finding time in its busy schedule of suppressing wages and pushing up house prices to also speculate on soft commodity futures– then the structural scene is potentially set for much higher food prices yet. (On which note, here was our warning of the tail risk of a Biblical commodity-price surge from a few weeks ago.) When we add disrupted global supply chains for all kinds of goods on top, things get even more ‘interesting’.
Let’s watch as central banks try to explain this all away rather than having to raise rates and see deflation in house and stock prices – which somehow they *can* measure accurately on the downside in real time. Unless we slip into a true inflation-wage spiral, which is unlikely given weak labour power, once we are on the other side of this real-income crushing CPI peak in 2022, let’s then also watch central banks explain why we still aren’t seeing any wage inflation, just in house prices and stocks.
Ian Paterson, CEO of Plurilock Security joins Michael to share some insights into the booming market for cybersecurity products and services – and most importantly, some ideas on how investors can participate.
-
I know Mike is a very solid investor and respect his opinions very much. So if he says pay attention to this or that - I will.
~ Dale G.
-
I've started managing my own investments so view Michael's site as a one-stop shop from which to get information and perspectives.
~ Dave E.
-
Michael offers easy reading, honest, common sense information that anyone can use in a practical manner.
~ der_al.
-
A sane voice in a scrambled investment world.
~ Ed R.
Inside Edge Pro Contributors

Greg Weldon

Josef Schachter

Tyler Bollhorn

Ryan Irvine

Paul Beattie

Martin Straith

Patrick Ceresna

Mark Leibovit

James Thorne

Victor Adair