
Daily Updates
After reading this weekend’s literature, I had to wonder whether gold was heading down to around a price of zero. “I am now on record that gold has topped out and is headed for a major decline” writes friend Joseph Granville in his latest mailing.
“The price of gold could fall a third from its recent high” warns Gene Epstein in the current issue of Barron’s.
“Gold’s brief Reign” is the heading and warning from Murray Coleman in this week’s Barron’s.
How seriously should we take all this concentrated anti-gold talk? My own reaction is that these forecasters don’t know any more about the death of gold than does my Aunt Tilly. Sure, it’s an interesting and reasonable bet. Gold is in its eleventh year of an historic bull market, and gold has yet to be subject to a major killer correction. If you haven’t been in gold during this whole bull market, you probably hate gold and its performance and hope it goes to zero. Omaha Oracle Warren Buffett despises gold but adores stocks at this time. So why not bet against the yellow metal? If you’re right, you’re a brilliant analyst, if you’re wrong your predictions will soon be forgotten.
Richard Russell 08/29/11 Dow Theory Letters HERE to subscribe
Good morning! I hope you had a wonderful weekend, like I did, resting, spending time with family, and at the same time, reflecting on the markets — because if you think last week’s action was wild, just wait until you see what this week will bring!
So let’s get right to the market action now …no delays, no dilly-dallying, no pontificating about theories or philosophies. Just the cold hard truth about last week’s action in key markets — and what to expect this week.
First, to the most important market on investors’ minds: None other than that most precious asset class of all, and the world’s most tried and true store of value: GOLD!
In my video update of last Monday, I showed you this chart, and I told you that “I personally would not be buying here. I would only be buying on a pullback when it comes or when I give the all clear, which would be a close into this channel here which right now stands about $1,900 … $1,910.

Well, gold did soar to as high as $1,917, but importantly, it failed to close above that resistance level, and then — as I have been expecting — gold swooned, big time. Shedding more than $200 in a mere three trading days, about an 11% plunge.
More importantly, gold also gave me a very important sell signal when it closed below the $1,768 level. That action now confirms what I’ve been suspecting and looking for.
A sharp, sudden pullback in gold that will shake out all the weak long positions, relieve the overbought conditions, and eventually and properly set gold up for its next major move higher, where the yellow metal will eventually see the $5,000 plus level.
So how low could gold go during a correction? Why is it heading lower? And how should you handle it?
Here are my answers:
First, as published in my recent columns, I believe gold can fall back to the following support levels: $1,611 … $1,567 … $1,433 … $1,386 … and $1,359.
A closing price below each of the above support levels will indicate a move to the next lower support area.
What’s driving gold lower is simply this …
A. It was hugely overbought and way overdue for a correction.
B. The dollar is likely bottoming (short term) as the euro continues to suffer from the sovereign debt crisis and the potential that the euro will disintegrate.
C. It’s just time for a correction: Gold has had an incredible 11-year run, with very few 10% to 20% pullbacks. So, a rather big, possibly drawn out correction is definitely in the cards.
Importantly for your long-term core gold holdings, you should just sit through it and wait for lower prices to add more gold to your portfolio. Ditto for select gold shares. Do not, I repeat, do not try to trade the short side, for most, it’s too risky.
And don’t worry, the bull market in gold is not over yet, not by a long shot!
Despite Bernanke’s neutral stance right now toward taking any further simulative action, rest assured — as soon as the markets start really falling apart again, he’ll be charging in there with all guns blazing. And that’s precisely when gold is likely to take off again. But that time is not here yet.
Next, silver: The devil’s metal ran up to over $44 and then collapsed to as low as $38 before rebounding a bit. That’s almost a 15% slide, in just a few days time.
Thing is, silver has already penetrated the $38.86 all-important technical support level on an intraday basis, a subtle but important signal that it should soon close below it. And once it does, look out below; silver could plunge all the way down to the $30 level!
In silver, I repeat my warnings: Steer clear of it, period, until it finds rock solid support at the $30 level. At that time, depending upon a few other parameters I monitor, I might then issue my first major buy signal for silver. But not until then!
Next, the Dow Industrials. Wow, what wild moves eh? In the past week, we saw the Dow swing between 10,820 and 11,448. The week before, between 11,529 and 10,644.
Notice how close these numbers are to some of the ranges I gave you in previous issues, where I mentioned massive resistance at 11,542 … and support at 10,567. Pretty darn accurate, wouldn’t you say?
Importantly though, the Dow Industrials and broad stock market indices are now in bear territory. I do expect the Dow to move toward major support at the 9,034 level.
But it won’t happen overnight. And it won’t happen without occasional snap-back rallies and bounces.
So if you acted on any of my suggestions to capitalize on a move lower in the broad stock market indices with inverse ETF investments, hold them!
Best wishes,
Larry
P.S. With the markets as wild and wooly as they are now, wouldn’t you want the insights of a 33-year trading veteran by your side?
To join my Real Wealth Report now, click here.
Larry Edelson has more than 30 years of investing experience with a focus in the precious metals and natural resources markets. His Real Wealth Report (a monthly publication) and Resource Windfall Trader (weekly) provide a continuing education on natural resource investments, with recommendations aiming for both profit and risk management.
For more information on Real Wealth Report, click here.
For more information on Resource Windfall Trader, click here.
this is a tet
The Fed surprised the market by extending its policy of 0 to 0.25% Fed funds rate to mid-2013. The way the Fed manages to drive rates lower is to buy Treasuries with newly created money – driving the price up and the rates down. The big question is whether the policy will have a sizeable effect on markets. The chart below shows the historical jump in the Fed’s combined policy tools that were used to lower rates and bail out financial institutions through a variety of programs.
These include the big purchase of mortgage-backed securities (MBS) called QE1 and the large purchase of Treasuries called QE2.
The point of the extrapolation in the chart is just to guess how much more money the Fed might need to create to keep the rate extremely low for another two years. By connecting a straight line from the start of the unusual policy tool expansions in late 2008 to today’s number, and then extending it to 2013, we can estimate that the policy might require about $1.5 trillion in order to keep the rate low.
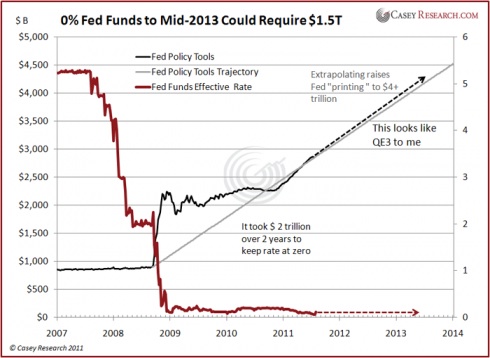
(Click HERE to enlarge image)
The Fed doesn’t calculate the amount of money that might be required and probably doesn’t know for sure. They just keep buying on the open market until the rate comes to its target. If there were a loss of confidence in the dollar, the amount could become very large – and in the extreme, printing more money contributes to that loss of confidence, which in turn causes runaway inflation. We are not there yet. But this kind of open-ended promise is a dangerous precedent because we can’t be sure of the cost of the commitment.
However, we can say that the Fed policy is to let the dollar fall and to support the bankers and politicians who want to stimulate the economy.
[Many analysts at Casey Research foresaw the problems that are playing out today with US debt and the dropping value of the dollar. Join Bud, Doug Casey, other Casey Research experts, and special guests including John Mauldin and Mike Maloney in a free online event focusing on the American debt crisis – including how you can protect yourself and your wealth.]
Casey Research has been making money for subscribers for 30 years. We do it by spotting trends in a market or the economy early — way ahead of the crowd.
Our research staff includes geologists, economists, seasoned business analysts, and experts in precious metals, energy, technology, and natural resources. We come to our conclusions through decades of experience and plenty of hard work.
We believe that major market trends provide some of the best investment opportunities. But you have to get in early and know when to get out. Reporting on those trends and providing the information needed to profit from them is what we do in our flagship publication, The Casey Report. And we’ve helped many of its subscribers make fortunes in the process.
Now that Mr. Bernanke’s speech is old news, what was the financial media thinking exactly?
-
I know Mike is a very solid investor and respect his opinions very much. So if he says pay attention to this or that - I will.
~ Dale G.
-
I've started managing my own investments so view Michael's site as a one-stop shop from which to get information and perspectives.
~ Dave E.
-
Michael offers easy reading, honest, common sense information that anyone can use in a practical manner.
~ der_al.
-
A sane voice in a scrambled investment world.
~ Ed R.
Inside Edge Pro Contributors

Greg Weldon

Josef Schachter

Tyler Bollhorn

Ryan Irvine

Paul Beattie

Martin Straith

Patrick Ceresna

Mark Leibovit

James Thorne

Victor Adair