
Daily Updates
Economists’ crystal balls are clouded right now. They see signs of a burgeoning global recovery, but retail sales and other key data surprise with their weakness. There is no sign of inflation, yet commodity prices are extraordinary strong, given we are in the depths of a major recession. The reality is that fiscal and monetary experiments have been tried that have never been tried before, and their combined effect is only beginning to be felt.
Conventional wisdom, based on the experience of the 1970s, holds that over-expansionary monetary policies should lead to inflation, while large budget deficits should lead to higher interest rates. Yet there is little sign of accelerating consumer price inflation at present (although Federal Reserve Chairman Ben Bernanke’s 3 a.m. fear of deflation has also not appeared), while interest rates have trended down in the last few weeks, contrary to expectations of “crowding out” from the U.S. Treasury’s unprecedentedly large budget deficit.
Were the adverse effects of excessive money creation and huge budget deficits not to appear at all, much of economic theory would have to be rewritten. It would mean that excess money creation could magically disappear, leading to no real world effects. It would also mean that budget deficits ad infinitum could be financed, as the global pool of capital simply expanded to accommodate them. Economically, the world would have invented a perpetual motion machine, in which government could create resources at will without adverse side effects.
Perpetual motion machines being impossible in the physical world, one’s natural skepticism supposes them to be impossible in the economic world. Hence the adverse effects of excessive money creation and budget deficits must either be delayed or be appearing in some novel form, so that observers looking for a repetition of the 1970s do not spot them.
As soon as the problem is posed in this way, the evidence becomes obvious. Commodities prices are far higher in real terms than they were at the top of the 2000 boom, while gold is on the verge of breaking through its record high and soaring into unknown territory. In itself, that makes no economic sense; in a deep recession such as the current one, where markets are allegedly fearful of deflation, commodities and gold prices should be extremely weak.
Commodities and gold therefore are the destination of this year’s hot money, and are forming the new bubble. They are a hedge against inflation, obviously, but they are also a hedge against prolonged recession, since the authorities have made it very clear that in such a case they would continue ad infinitum their current loose money policies.
That makes sense. Stocks, the most likely bubble suspect, are held back by recessionary earnings and prospects. It becomes impossible for even the most enthusiastic Wall Street analyst to push up stocks beyond a certain level if the raw material of “stories” is not there and in this economy the stories are decidedly absent. China of course sees its stock market soar to ever greater heights, since its domestic funding sources have lots of money and very few alternatives, but that market is still largely independent of the world as a whole. As for housing, in most national markets there is a huge inventory overhang, together with a backlog of borrowers heading slowly for foreclosure, so that too is unlikely to see much of a takeoff.
Bonds are an interesting case. From December to June, 10-year Treasury bond yields backed up from 2.07% to 4%. That’s what one would expect with the ludicrous levels of deficit, more than 10% of Gross Domestic Product in both 2009 and 2010, that the United States is currently running. However, yields then backed off; the 10-year Treasury bond is currently yielding about 3.4% and the Treasury is able to fund hundreds of billions of new confetti-like financing with the utmost ease.
That suggests a fair sized bubble has developed in the T-bond market. With the world in recession, yet Asian central banks and other institutions generating massive cash flows because of easy money, the most obvious place to put those flows remains T-bonds. If this is a bubble, however, it is an extraordinarily vulnerable one. At any moment, a modest resurgence in U.S. inflation or difficulty in a long dated T-bond auction could cause confidence to flee the Treasury bond market and yields to leap uncontrollably upwards.
The current situation is unstable. The problems caused by excessively lax fiscal and monetary policies are indeed appearing, but not yet in a form that forces policymakers and economic participants in general to take action. The rise in commodities prices will remove purchasing power from Western economies and push up their consumer price indices, but it has not yet done so since it has been offset by the natural deflationary effects of recession.
The recent modest decline in Treasury bond yields conceals an increasingly unstable bubble, and it is only a question of time before that bubble bursts. Given the current predilections of the world’s central bankers, it is likely that when the T-bond bubble bursts, they will rush to the printing presses, the Fed buying Treasuries in a frantic attempt to stabilize the bond market. In all but the shortest term, that is unlikely to work; it will cause a spiraling increase in gold, oil and other commodities prices that will make it clear to the doziest Federal Open Market Committee member that the punchbowl has been drained dry and the party of monetary profligacy must end.
October 2009 is unlikely to produce another banking crisis. It may very well, however, produce a crisis of confidence in the Treasury bond market, followed by an economic relapse as interest rates are forced upwards and high commodity prices reduce purchasing power in those Western countries that are heavy net consumers of commodities.
If October 2009 fails to produce a full-scale T-bond rout, it will not be long delayed thereafter; the resurgence in consumer price inflation caused by continually rising commodity prices will eventually cause even central bankers to demand higher yields.
Either way, the flood of money that has poured into commodities, bonds and the stock market cannot prop them up for much longer. Like previous such floods, it must eventually reverse, and its reversal will cause yet another round of bankruptcies and unexpected disasters. The “Great Moderation” of which Ben Bernanke spoke so lovingly before the present unpleasantness was always a myth. In reality, the flood of easy money from 1995 caused a succession of bubbles, each one more devastating than the last once it burst. Monetary policy since 1995 has been wholly immoderate, expanding the St. Louis Fed’s broad measure of money, MZM, by 8.7% annually since spring 1995, 82% faster than the 4.7% annual rise in nominal GDP. Its long-term results have been and will continue to be equally immoderate.
The laws of economics have not been repealed. It is indeed not possible to run a huge fiscal deficit without destabilizing the bond market; attempting to finesse the problem by creating excessive money simply causes spiraling commodities prices and subsequent inflation. Equally, an over-stimulative monetary policy will find an outlet either in consumer prices or in asset prices, though it may take a considerable time to do so.
Apart from instability, the long-term costs of excessively cheap money are beginning to be seen in the U.S. economy itself. By allowing money to remain so cheap for so long, and by running incessant payments deficits, the United States has surrendered the advantage of its superior long-established capital base, narrowing its capital cost advantage over emerging markets and exporting that capital to countries with less profligate approaches. Huge budget deficits, themselves worsening the trade deficit, merely export yet more U.S. capital to the surplus nations. That makes it inevitable that the years ahead, in which the United States will no longer enjoy a capital advantage over its lower-wage competitors, will see highly unpleasant declines in U.S. living standards.
Job losses within the United States in the current downturn are steeper than in any previous recession, even though the output decline is only equivalent to those of 1973-75 and 1981-82. Income differentials have widened unpleasantly, as the working class jobs in manufacturing are outsourced to Asia while the cheap money has created a parasitic and unpleasant class of financial manipulators at the top of the distribution. Only a decade of sound money and sound budgets will rectify these problems, and halt the decline in U.S. living standards. Needless to say, we are a very long way from even the start of such a decade.
There really are no free lunches in this world. And of all the attempts to create a free lunch, or a perpetual motion machine, the delusion by government that it can create wealth is the most dangerous.
Martin O. Hutchinson is a Contributing Editor to both the Money Map Report and Money Morning (http://www.moneymorning.com/). An investment banker with more than 25 years’ experience, Hutchinson has worked on both Wall Street and Fleet Street and is a leading expert on the international financial markets. At Creditanstalt-Bankverein, Hutchinson was a Senior Vice President in charge of the institution’s derivative operations, one of the most challenging units to run. He also served as a director of Gestion Integral de Negocios, a Spanish private-equity firm, and as an advisor to the Korean conglomerate, Sunkyong Corp. But it was Hutchinson’s work in Bulgaria, Croatia and Macedonia that solidified his reputation as a true “hands-on” expert on the developing economies. As the U.S. Treasury Advisor to Croatia in 1996, he helped the country establish its own T-bill program, launch its first government bond issue, and start a forward currency market. Hutchinson returned to the United States, was named Business and Economics Editor at United Press International, and was able to jump-start the financial-news operation of that historic wire service. In October 2000, Hutchinson began writing “The Bear’s Lair,” a weekly investment column that appears on the Prudent Bear Web site. Hutchinson earned his undergraduate degree in mathematics from Cambridge University, and an MBA from Harvard University. He lives near Washington, D.C.
Editor Note: Highly recommend that you take a visit monday morning visit to Don Vailoux’s monday report where he analyses an astonishing 40 plus Stocks, Commodities and Indexes.
Technical Action Yesterday
Technical action by S&P 500 stocks remains bullish. Another 32 companies broke resistance and two stocks broke support (Lockheed and Monsanto). Most stocks breaking resistance continued existing uptrends. The Up/Down ratio for S&P 500 stocks increased from 9.50 to (404/42=) 9.62%. Major U.S. equity indices closed at 11 month highs.
Technical action by TSX Composite stocks was quiet once again. One TSX stock broke resistance (Sino Forest). The Up/Down ratio for TSX stocks was unchanged at (112/25=) 4.48.
Interesting Charts
The exceptionally high inverse correlation between the U.S. Dollar and the S&P 500 Index has dominated the trend for U.S. equity markets since the beginning of the year. The U.S. Dollar weakened again yesterday. Short term momentum indicators show that the U.S. Dollar is oversold, but has yet to show signs of bottoming.
Yesterday natural gas recorded its largest daily percentage gain in five years. Short term momentum indicators bottomed earlier this week. Natural gas already has recovered to the bottom of a range of resistance. Seasonal influences for Canadian natural gas is positive from the end of August to the end of December.
Bullish Percent indices for all sectors remain intermediate overbought. Nine indices increased slightly, one index (Telecom) was unchanged and one index slipped slightly (Utilities). Four indices remain below their 15 day moving average (Consumer Discretionary, Utilities, Industrials and Materials). The remainders are close to breaking below their 15 day moving average. Following are the charts:


Don Vialoux has 37 years of experience in the Investment Industry. He is a past president of the Canadian Society of Technical Analysts (www.csta.org) and a former technical analyst at RBC Investments. Now he is the author of a daily letter on equity markets available free on the internet. The reports can be accessed daily right here at www.dvtechtalk.com.
Impossible! That’s what institutional investors say about “Timing the Market”. Mr. Vialoux will explain that, indeed, it can be done with the appropriate analysis. He also will explain why timing the market will be important during the next decade. Buy and Hold strategies are not working anymore; Investors are looking for alternatives. Mr. Vialoux will demonstrate four techniques that can be used to time intermediate stock market swings lasting 5-15 months. The preferred investment vehicles for investing in intermediate stock market swings are Exchange Traded Funds.
Comments in Tech Talk reports are the opinion of Mr. Vialoux. They are based on technical, fundamental and/or seasonal data that is believed to be accurate. The comments are free. Mr. Vialoux receives no remuneration from any source for these services. Comments should not be considered as advice to buy or to sell a security. Investors, who respond to comments in Tech Talk, are financially responsible for their own transactions.
Dateline August 31st: The world’s favorite investor Warren Buffett’s investment in China’s BYD (electric cars) has returned 500% in one year. – China Stakes
Demand for lithium is on the rise, as hybrid car batteries and portable electronic devices often require rechargeable lithium batteries. Analyst Merrill McHenry, MBA, CFA, in this email interview, gives The Energy Report readers the lowdown on automakers racing to see how many cars they can get into the market, and the importance of project economics in looking at investment opportunities. Some excerpts:
The Energy Report: Merrill, can you comment on how the recession is impacting the price of lithium?
Merrill McHenry: In 2008, lithium’s (Li) growth was only slightly affected by the recession. Lithium has had compounded annual growth of 5% to 7% over the past five years, according to Patricio de Solminihac, EVP of the world’s largest lithium carbonate producer, SQM (Sociedad Química y Minera de Chile S.A) (NYSE:SQM). At a conference on lithium last January, Solminihac also said 2008 demand for lithium carbonate equivalent is estimated to have been in the range of 115,000 to 118,000 tons (about 2% above 2007 levels). This is in sharp contrast to Li’s 31% 2007 sales growth.
It’s interesting to note that lithium actually got a big start in the Great Depression. While some may know that Coca-Cola originally contained a tiny amount of cocaine (9mg/glass until 1903), very few know that the “Up” in 7-Up, launched two weeks before the Wall Street Crash of 1929), contained lithium citrate, a mood-stabilizing drug. 7-Up was specifically marketed as a hangover cure. Long before today’s “Energy Drinks,” the soft drink industry had a medicinal heritage.
So, back to our present-day situation. . .keep in mind most all of the metal is traded under longer-term market contracts, typically adjusting in various degrees over time to the spot. 2009 contract Li prices were down to $2.80 to $3.00/lb (or $6,613/ton); down approximately 5% to 10% from the prior year’s peaks.
Future growth estimates vary wildly—anywhere from 20- to 40-fold by 2020—driven largely by car battery demand. The USGS expects demand for lithium-ion batteries to increase 15-fold from 2006 to 2012.
…read more about Lithium and public companies that mine it HERE.
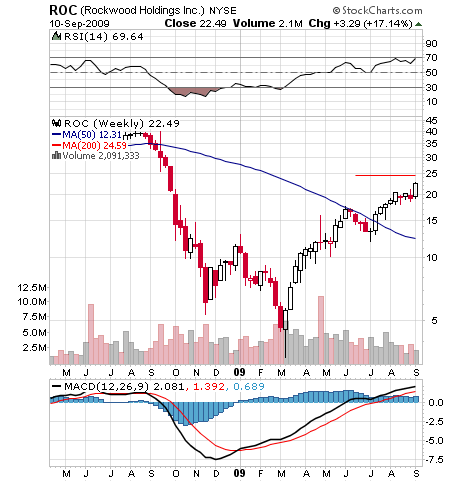
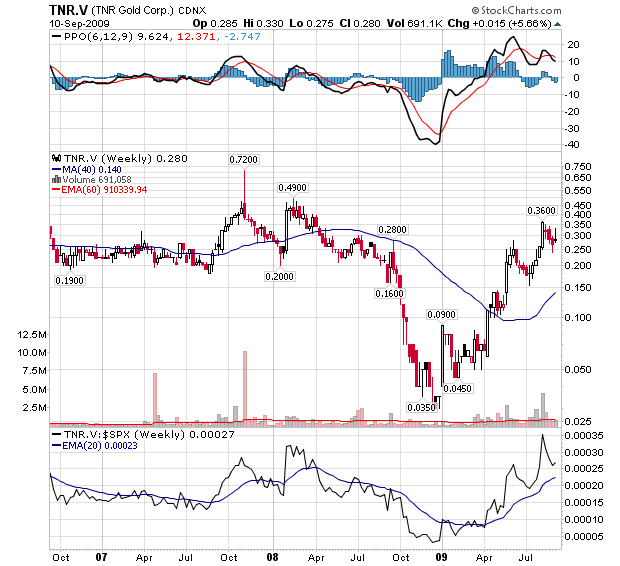
Ed Note: Some charts of a few of the companies discussed:
The markets have had a good summer. They have built on a base off the March 9th lows. The market has climbed over 50% and has increased 14% since May 5th. In the May newsletter I was recommending investors use the 3 R’s – Reduce equities, Redeploy equities to less riskier assets and Re-adjust the overall risk in the portfolio. Does the fact that the market has gone up in the summer mean that the six month favourable-unfavourable cycle of investing is dead? No! Aside from the two R’s of redeploying assets and readjusting the risk in a portfolio, Investors have to remember that seasonal investing is a long-term discipline.
The six month cycle is built upon the premise that the markets perform better from October 28th (buy at the end of the day October 27th) to May 5th, than they perform from May 6th (buy at the end of day May 5th) to October 28th. It does not state that the market will be negative in the unfavourable months. In fact it is positive approximately 56% of the time from 1950 to 2008. When gains occur in the summer months they tend to be small and when corrections occur, they can be large. From a risk-reward relationship the favourable months are a much better deal than the unfavourable months. In addition, from a short-term perspective it must be remembered that the unfavourable months in 2008 produced a loss of 40% in the S&P 500. I don’t mind giving up a 14% gain and saving myself a 40% loss.
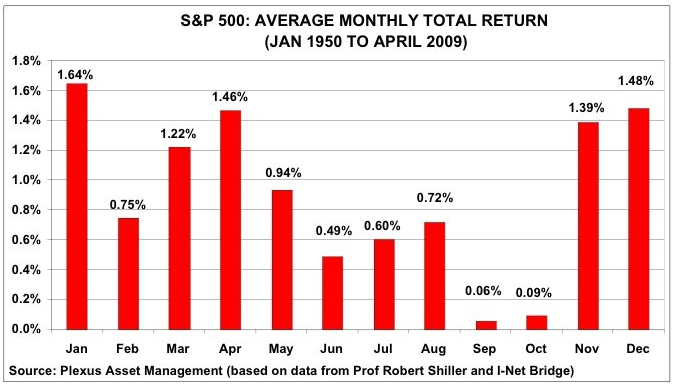
Despite the run in the market at this time, investors should be cautious. From a technical perspective the market is showing both bullish and bearish signs. It has been able to stay over 1,000 (bullish). At the same time the market has been forming a rising wedge (bearish). Given that we are in the worst performing month of the year it makes sense to be defensive until the last week in October. October is typically the most volatile month and there may be earlier opportunities to enter the market on large downdrafts (topic to be covered in the next newsletter – October 5th).

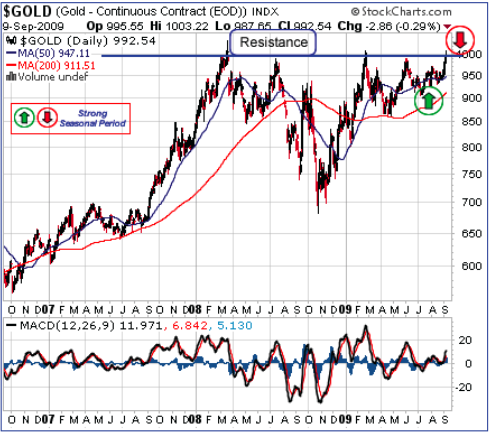
Gold
Gold has been the in the newspapers recently as it breached the $1,000 level. Every time gold reaches an important milestone the gold bugs come and the newspapers report how gold may one day hit an astronomical amount. Although I believe has more upside, I still believe that it is better to focus purchases in the seasonal zone. Currently gold is fl irting with the $1,000 level. It is up in its seasonal time but is bumping into resistance.
Because October has traditionally been a very weak month for gold (see Thackray’s 2009 Investor’s Guide) investors need to be very careful at this time. If gold is able to breach $1,000 before the end of September, then investors can use this level as a stop-loss. If gold is under $1,000 then investors should consider taking profi ts. It is better to err on the side of caution during the typical negative month for gold.
In this newsletter I will discuss the merits of investing in the oil, health care and consumer staples. I will also discuss the merits of investing in a sector that has recently done well, but typically does poorly at this time – materials.
The Thackray Market Letter is FREE . To read about oil, health care and consumer staples go HERE to email, HERE to subscribe on the website. to the FREE Thackray Market Letter (or email subscribe@alphamountain.com).
Brooke Thackray is President of alphaMountain Investments, a firm that publishes investment reports and books. The main goal of the publications is to use seasonal analysis to give investors and money managers an edge in the markets.
When it comes to investing in commodities, the people I know have two opposite emotions — either obsessed or terrified.
I can see why. The commodity markets — contracts representing tangible goods like gold, oil, grains, etc — are known for sharp reversals and wild volatility. The potential profit can be enormous if your forecast is correct. If you’re wrong … let’s just say the results aren’t pretty.
Today I’m going to tell you about some of the best new investment instruments created in my lifetime — and how their very existence is under attack from powerful vested interests.
Commodity ETFs Revolutionize Investing!
Until recently, commodity investing was mostly restricted to professional traders, large institutions and a few intrepid individuals. This began to change with the introduction of commodity-based ETFs.
The idea wasn’t really so complicated: Start a fund whose price is based on a commodity market or a commodity-related index. Simple in concept, but difficult in reality mainly because of legal restrictions, these took a long time to resolve even as stock-based ETFs thrived.
Finally, the first commodity ETF launched in 2004. SPDR Gold Shares (GLD) was an immediate success. With the path now open, a flurry of similar funds hit the market in the next few years, tracking all kinds of commodities.
It didn’t hurt that this period was accompanied by a huge bull market in all kinds of natural resources. Crude oil went from less than $40 to more than $140 per barrel, gold climbed from around $400 an ounce to over $1,000, and corn jumped from $2 all the way up to $6!
With investors clamoring to get into booming commodities but afraid to trade highly-leveraged futures and options, these ETFs came at the perfect time.
Many were actually offered under a new structure called exchange-traded notes, or ETNs, that look a lot like ETFs but have some important differences. (See my February 6, 2009 Money and Markets column about the unique risks of ETNs.)
Three Kinds of Commodity Funds
Commodity ETFs and ETNs can be broken down into three groups:
1. Broad-based: These track an index that includes many different commodity markets. These are very useful to long-term investors who want to allocate a small portfolio slice to commodities and don’t care so much about following particular markets. Some examples are …
- iShares S&P GSCI Commodity Index (GSG)
- PowerShares DB Commodity Index (DBC)
- GreenHaven Continuous Commodity (GCC)
2. Commodity Sectors: This type of fund tries to cover a particular category of commodities, like energy, agriculture, metals, etc. These are naturally more volatile than the broad-based funds, but have the potential to move much higher if the sector takes off. This group includes funds like …
- PowerShares DB Energy (DBE)
- PowerShares DB Agriculture (DBA)
- Elements Rogers ICI Metals ETN (RJZ)
3. Specific Commodities: Funds in this category track the price of one particular market, like GLD that I mentioned above. These are considered very speculative. Here are some you might have heard about …
- United States 12-Month Oil Fund (USL)
- iPath DJ AIG Sugar ETN (SGG)
- iPath DJ AIG Copper ETN (JJC)
As with stock ETFs, some commodity ETFs and ETNs are designed to deliver leveraged and/or inverse returns. These features can be useful but also bring extra volatility and risks. They should be used very cautiously.
Regulatory Chaos Threatens to Eliminate Innovation
…read more HERE.
P.S. I’m now on Twitter. You can follow me at http://www.twitter.com/ron_rowland for frequent updates, personal insights and observations about the world of ETFs.
This investment news is brought to you by Money and Markets. Money and Markets is a free daily investment newsletter from Martin D. Weiss and Weiss Research analysts offering the latest investing news and financial insights for the stock market, including tips and advice on investing in gold, energy and oil. Dr. Weiss is a leader in the fields of investing, interest rates, financial safety and economic forecasting. To view archives or subscribe, visit http://www.moneyandmarkets.com.
Ron Rowland is president and a founder of Capital Cities Asset Management. Mr. Rowland is widely regarded as a leading ETF and mutual fund advisor as well as a sector rotation strategist. In addition to his roles of President and Chief Investment Officer of CCAM, he is Executive Editor and Publisher of the All Star Fund Trader, a highly regarded investment newsletter in its 18th year of publication.
You may have read about Mr. Rowland and his strategies in publications such as The Wall Street Journal, The New York Times, Investor’s Business Daily, Forbes.com, Barron’s, Hulbert Financial Digest and many more. Outside of CCAM, Mr. Rowland served on the Executive Committee of Austin’s American Association of Individuals Investors (AAII) and led the mutual fund special interest group for numerous years.
As a former mutual fund manager from 2000 to 2002, Ron was a pioneer in using ETFs inside of mutual funds. He also served as the manager of a hedge fund from Aug. ‘93 to Dec. ‘94. His formal education includes a BS in Electrical and Computer Engineering from the University of Cincinnati in 1978 with additional studies in the same field at the University of Texas from 1978-1981.
-
I know Mike is a very solid investor and respect his opinions very much. So if he says pay attention to this or that - I will.
~ Dale G.
-
I've started managing my own investments so view Michael's site as a one-stop shop from which to get information and perspectives.
~ Dave E.
-
Michael offers easy reading, honest, common sense information that anyone can use in a practical manner.
~ der_al.
-
A sane voice in a scrambled investment world.
~ Ed R.
Inside Edge Pro Contributors

Greg Weldon

Josef Schachter

Tyler Bollhorn

Ryan Irvine

Paul Beattie

Martin Straith

Patrick Ceresna

Mark Leibovit

James Thorne

Victor Adair