
Daily Updates
The overall market tone remains bullish though volumes are still light. It’s an impressive turnaround from the “world is ending” scenarios being outlined only a few months ago. Many more analysts and commentators have turned bullish in the last couple of weeks. While the bearish population is still healthy, which may explain the lighter volumes, growing bullishness could become a contrary indicator.
The scale of the move off the March bottom makes traders nervous. We need to remember that this move came after the worst market decline in over 70 years. The 50% rally for the major indices still leaves them 35% below their 2007 highs. So while this year’s rally is impressive, especially given the breadth of the problems that caused the crash, the bounce is not quite the raging irrationality some see it as.
We said earlier in this rally that we were concerned about a revisit to the year’s lows. It’s not news that the economic backdrop that led to the market collapse is more dire than any other in recent (or not so recent) memory. We don’t see convincing evidence that everything is “fixed”. There is still room for disaster, especially in the financial sector, but we would rather work with the market that is then try and tell it what to do. The odds of a correction are high but a full retest of the lows now seems a lot less likely.
We accept the conventional wisdom that the world’s major markets are in a secular bear market that began in 2000. If this is an “average” secular bear, we are half way through it. Any bear market rally needs to be treated gingerly so we will keep suggesting you take enough profits to stay liquid and lower your holding costs as much as possible.
We looked at the S&P during the last secular bear in the 1970’s for some insight on how far a bear market rally can go. The S&P chart for this period appears on the following page. As you can see the market basically “went nowhere” from 1968 to 1982, but that flat period included sustained rallies of 55%, 60% and 80%. A more recent example is the rally that occurred from 2003 to 2007. Bear market rally it may have been, but a 4-year 90% rally leaves room for a lot of profitable trading. One could refuse to trade during secular bear markets, that’s an individual choice, but it’s hard to make money sitting on the sidelines for 18 years.
We’ve seen new bearish lectures about how the market has again gone nowhere for 15 years. True, if you do a straight line point to point measurement using carefully selected dates, but not very meaningful or useful.
If you buy your portfolio on one day then bury the certificates in your back yard for 20 years, then yes, you had better pick the right day to buy and sell everything. If you treat stocks as trading vehicles, and we certainly do, the obsession with the species of the rally seems overdone. The best one can do is look for undervalued situations on an individual basis where new information can change the market’s view of the company. Accept it’s a bear market and make a habit of always taking profits on strong upward moves, letting the market show you the low before buying again, and try to “play with house money” as much as possible. We think that is sensible advice in any market.
Our concerns about a retest stemmed from the market action of 2000 to 2003. There was a retesting of the lows that occurred within 2 years of the market top. That has many traders nervous as we move towards the second anniversary of the current bear move. Arguably however, the March bottom was the main retest of last autumn’s lows, which became a rout thanks to more bad news from the financial and auto sectors. If that’s the case we may see much more mild corrections along the way until this rally runs its course.
This recovery looks even more jobless than the early recovery from 2000. The consumer saved the day early this decade, but we can’t see it happening this time. However, production indices have turned positive worldwide and we appear to be at the start of a new inventory cycle. Companies rebuilding inventories could generate good (not great) GDP growth for a couple of quarters.
Based on the strong productivity growth numbers recently put out, this inventory rebuild could also generate good — or at least better than expected — profit growth for several quarters. While that productivity growth owes much to a lack of new hiring, the bottom line numbers could be good enough to keep the rally going through the fall if there are no new financial disasters. Going into Q4, the year over year profit comparisons get much easier. Favorable comparisons between this year’s lousy and last year’s just awful bottom line numbers is something of an optical illusion, but rallies have run on less in the past.
The Bear over There
While the world as a whole is in a secular bear market, the developing countries that are the commodity demand drivers look better. Long term charts for Shanghai, Mumbai, and San Paulo show all of these markets still appear to be in long term up trends, albeit with a really nasty dive last year.
Serious caution is still needed when dealing with Shanghai, or any emerging market bourse, since any economy’s emergence will produce sharply overbought periods and subsequent nasty downturns. However, the Panda bear should continue to be much easier to approach than the Grizzly bear stalking western markets. [Grizzlies, we could note, rarely ever come into camp unless you are foolish enough to leave food out for them. However, once they arrive they do tend to stay].
Importantly, the bourses like Canada’s and Australia’s in countries that supply the emerging markets’ demand for commodities are also not in the secular bears. Both comfortably exceeded their 2000 highs in 2007 and neither breached 2002 lows earlier this year. The bankers in both of these countries were less stupid than those in New York or London, but the heavy resource weighting in Toronto and Sydney has at least as much to do with their bounce. They hearken back to the last sustained resource bull of the 1970s.
The 1970s was a period of high inflation, which certainly isn’t a problem at the moment, which became the main driver of that resource bull. High inflation was partly the result of the massive and self reinforcing price jump for crude oil, but a major expansion of the industrialized world’s paid workforce because of the baby-boom and a much greater participation of women was also a major factor.
The fundamentals surrounding current commodity price gains are somewhat different. New demand from a major expansion of the “emerging world’s” paid workforce is certainly a factor, but the other driver is a lack of supply to meet this demand because it was preceded by a weak investment period for the resource sector.
The 70s resource bull and the current one are in fact linked – oversupply from a heavy investment into resources in the 70s eventually killed off that resource bull. That, in turn, caused the period of weak intervening commodities investment that has set up this new secular bull.
What is also common to both the 70s and now, and we think quite normal, is for secular equities bears and secular commodity bull markets to occur simultaneously. We are not trying to reinvent the wheel in expecting the commodity sectors to act separately from western stock markets. While we can’t expect resource stocks to buck the trend in a major sell off, the strength of the markets in metal consumer and producer countries implies this sector will continue to outperform. That view is taking hold more broadly, so now the real trick is to focus in on the right sub-sectors within the broader commodities space. As pointed out on page 1, right now gold and silver are most capable of going against the overall market trend if big markets keep weakening.
We don’t see a strength for a broader recovery until employment starts to grow in the west. Though employment stats are a trailing indicator in most recessions, we have to side with those who think the developed markets are ahead of themselves. They usually are at this part of the cycle. What equity markets do is project economic change several quarters out, and they did see the current bounce beginning in March. The key now will be getting through the dangerous months of September-October with economic numbers that remain at least positive. We are still anticipating a near term correction, but if no new catastrophes occur it is possible we have seen the low for this part of the cycle. On a global average basis, that is.
David Coffin and Eric Coffin produce the Hard Rock Analyst publications, newsletters that focus on metals explorers, developers and producers as well as metals and equity markets in general. If you would like to be learn more about HRA publications, please visit us HERE to view our track record, see sample publications and other articles of interest. You can also add yourself to the HRA FREE MAILING LIST (lower left hand corner to sign up) to get notifications about articles like this and other free analyses and reports.
by LARRY EDELSON on SEPTEMBER 16, 2009
Click here to post your comments …
This morning, we awakened to the news that the U.S. dollar has now fallen to its lowest levels in about a year — in freefall against the euro, the British pound and many other major currencies.
This is precisely the danger I’ve been warning you about.
Just yesterday, I showed you how Washington’s massive debt and entitlement obligations have grown to well over $100 trillion — far more than our nation could ever hope to service — let alone ever repay.
We took a look at Bernanke’s secret solution to our massive, record-shattering debt: That only by destroying the value of the U.S. dollar can Washington ever even hope to service our skyrocketing debt — by satisfying its Social Security, Medicare and Medicaid obligations with ever-cheaper dollars.
We saw how this strategy is already being implemented … how it has already begun to crush the dollar’s value on world markets …
And we’ve seen how, by destroying your buying power, it can only drive your cost of living through the roof … push retirees living on fixed incomes into abject poverty … and trigger massive new waves of bankruptcies from coast to coast.
The simple truth is, if Bernanke’s secret debt solution was the ONLY threat to the U.S. dollar, it would be enough to crush the greenback’s value.
But this intentional destruction of the dollar by our leaders is only ONE of FOUR factors that are about to crush the value of your income, savings, investments and retirement in what will go down in the history books as the single greatest confiscation of personal wealth in world history.
Today, we’re going to examine a second crucial reason why I am convinced that the U.S. dollar is doomed:
Foreign investors are abandoning the dollar in droves.
Anyone who buys long-term U.S. treasuries these days is virtually begging to get his head handed to him for three very simple reasons:
FIRST, long-term treasuries are paying bupkis. To many, tying up money for 30, long years in return for a paltry 4.2% yield isn’t an investment decision; it’s an IQ test.
SECOND, foreign investors aren’t blind, deaf or dumb: They know full well that U.S. deficits and debt are exploding. And they’re also keenly aware that Bernanke’s secret debt solution means the yield they earn in those treasuries will be worth much less with each passing year — as the dollar continues to fall in value.
AND THIRD, the sheer size of Washington’s debt has many foreign investors wondering if long-term U.S. treasuries really are a prudent investment in the first place. As our national debt continues to explode, so does the risk that at some point, Washington may have no choice but to default on that debt.
Put simply, foreign investors are disgusted with Washington’s unprecedented spending binge. They’re haunted by Bernanke’s seemingly intentional failure to defend the dollar. They’re sick and tired of footing the bill for our spendthrift ways. And they’re increasingly skeptical of our ability to pay what we owe them.
And now, they’re beginning to recoil in horror; snapping their checkbooks SHUT.
This is serious: Overseas investors fund fully 50% of our borrowing addiction, holding $6.2 trillion in U.S. securities — including almost $4.6 trillion in bonds.
But over the last year, central banks have been actively replacing portions of their dollar reserves with the euro, the Canadian and Australian dollars, and most of all gold. China alone recently announced it has quietly increased its gold reserves by more than 75% over the last seven years!
All this has enormous implications for the value of your money, your buying power and your standard of living: As demand for U.S. treasuries wanes, so does demand for dollars to buy them. And as worldwide demand for dollars declines, so does the value and spending power of every dollar in your pocket.
Worse: As more foreign central banks, overseas fund managers and investors flee the dollar, Washington has no choice but to pump out more and more unbacked paper dollars and dump them into the economy — further eroding your buying power.
It’s a perpetual cycle that can only lead to one thing: Printing presses blazing on overdrive … a collapse of bond prices … a massive surge in interest rates … an explosion of inflation … and the total destruction of our standard of living — at least, for those who aren’t aware or prepared for what is happening.
That’s why I believe it is absolutely essential that we pull out all the stops to help you weather the greenback’s ultimate collapse.
So please be sure to watch your inbox tomorrow and over the next few days for the next installments of this series — and to discover what we’re doing to help you protect your wealth and profit.
In the meantime, I stand ready to help any way I can. Just click this link to leave a comment and give me your comments. Ask anything you like and we’ll do our best to get you the answers you need to shield your wealth.
Best wishes,
Larry
Larry Edelson
Financial Analyst
Ed Note: Sign up for FREE Uncommon Wisdom Updates HERE ( top left hand corner)
Larry Edelson, a financial analyst specializing in international macro-economics, and the precious metals and natural resources markets, is the editor of Weiss Research’s Resource Options Alert, Energy Windfall Trader, and the monthly newsletter Real Wealth Report.
Mr. Edelson is a co-editor of The Foundation Alliance as well as managing editor and a regular contributor to Weiss Research’s daily investment e-newsletter, Uncommon Wisdom.
Mr. Edelson also serves as an Executive Director of the prestigious Foundation for the Study of Cycles — a non-profit organization established 78 years ago at the behest of President Herbert Hoover and Edward R. Dewey, Hoover’s Chief Economic Analyst, to conduct ongoing research into the science of cycles, with an emphasis on economic cycles and the financial markets.
For the better part of 40 years, the gold price has been standing guard over monetary policy. The gold price has been alerting investors to the potential threat of inflation. And if the recent price action in the gold market is to be trusted, this sentry has not fallen asleep on his watch. During the last few weeks, gold has jumped about 10% to over $1,000 an ounce.
But our story really begins in the late 1960s, just as “Lost in Space” was going off the air and the U.S. dollar was going off the gold standard. Back when B-9 was waving its arms and yelling “Warning! Warning!” once per week, the gold price was fixed at $32 an ounce and foreign central banks could freely convert their accumulated dollar bills for gold.
The French thought this was pretty sweet deal and swapped as many dollars as they could find for gold. However, President Nixon soon realized that this trade was a very sour deal for the U.S. And so, in August of 1971, he ended gold convertibility for good. Without this inconvenient and inhibiting link to gold, the U.S. discovered the pleasures of reckless monetary policy: printing dollars to pay debts.
Inflation kicked up almost immediately, as did the gold price. Within a few short years of ending gold convertibility, inflation jumped to double digit rates and the gold price jumped to $800 an ounce. But then the “yellow dog” took a good long nap. It slept through most of the 1980s and 1990s, as monetary inflation remained RELATIVELY tame.
By the late 1990s, the gold price had slumped to nearly $250 an ounce. It has been climbing steadily ever since. The initial move from $250 to $450 between 2000 and 2004 did not exactly scream “Warning! Warning!” But the gold rallies of recent years have taken on a more ominous tone, from a monetary standpoint. In other words, gold is in a bull market because inflation is in a bull market.
The most recent rally in gold seems particularly intriguing – and ominous – in light of the crazy quantities of cash that the Treasury and Federal Reserve have been tossing at the financial crisis. In various ways through various channels, the nation’s monetary bodies have conjured trillions of dollars into existence that did not exist before Lehman Bros. went bankrupt.
In all earlier epochs, such activities would have produced a large and inevitable inflationary trend. We predict this epoch will be no different. The gold price is telling us as much. So are the Chinese, as Byron King, editor of Outstanding Investments observed in a recent missive to his subscribers:
The Chinese Keep Buying Gold
“Then again, why worry about the future of energy development? The West — the U.S. in particular — is working overtime to wreck the future by debasing its currency and choking its economy.
“Don’t take my word for it. In a recent article, the U.K. Telegraph quoted at length Cheng Siwei, former vice chairman of the Standing Committee of the Chinese Communist Party. He explained how Beijing is dismayed by the ‘credit easing’ coming out of the Federal Reserve.
“‘If they [the Fed] keep printing money to buy bonds,’ said Mr. Cheng, ‘it will lead to inflation, and after a year or two, the dollar will fall hard. Most of our [Chinese] foreign reserves are in U.S. bonds and this is very difficult to change, so we will diversify incremental reserves into euros, yen and other currencies.’ Mr. Cheng was referring to over $2 trillion of Chinese foreign reserves, the world’s largest holding.
“‘Gold is definitely an alternative,’ said Mr. Cheng, ‘but when we buy, the price goes up. We have to do it carefully so as not to stimulate the markets.’
“Thus, we have direct testimony from a high-level cadre that China, while cautious, is a key driving force in the gold market. It’s buying. The implication is that the Chinese will not overbuy gold, which may be why the yellow metal has hovered just below the $1,000 mark per ounce in recent weeks. At the same time, it’s more than likely that China will buy gold whenever there’s a price dip.
“The significance is that the Chinese seem to be prepared to establish a floor under any correction in gold prices. This limits the downside for well-positioned gold miners such as AngloGold Ashanti (AU: NYSE) and Kinross (KGC: NYSE).
“As for the upside to gold prices? That will depend on when monetary-driven inflation begins to bite into the economy. The tide of inflation will lift the boats of the gold miners.
“Mr. Cheng’s greatest concern with the U.S. is that the country ‘spends tomorrow’s money today.’ Meanwhile, he added, ‘We Chinese spend today’s money tomorrow.’
“To sum things up, according to Mr. Cheng, ‘He who goes borrowing, goes sorrowing.’ Mr. Cheng was, of course, quoting that famous Chinese philosopher Benjamin Franklin.”
The Short-Term Case for Gold
Byron’s analysis above highlights the compelling long-term reasons to allocate some capital to the gold market. On a related note, most gold mining companies are swearing off the practice of “selling forward” – i.e hedging – their production. In effect, therefore, the insiders are buying…and that’s usually a bullish sign. “The size of the [gold] industry’s hedge book is set to drop to a residual of less than 200 tonnes by the end of 2010, the lowest in almost 25 years,” the Financial Times reported recently. “The reduction is a 95 per cent drop from 3,000 tonnes a decade ago.” The mining industry’s bullish stance is just one more vote of confidence in gold’s long-term investment appeal.
Meanwhile, the shares of gold mining companies are flashing a compelling short-term buy signal. Since late July, the gold mining stocks, as represented by the HUI “Gold Bugs” Index have jumped more than 30%, while the gold price has advanced only about one third as much.
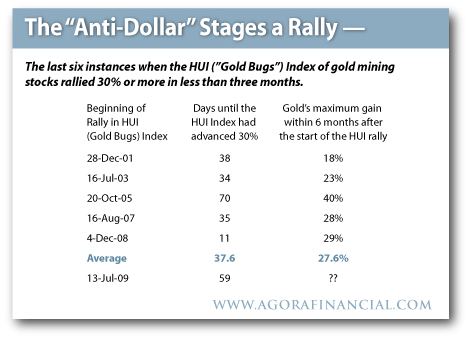
As the nearby table illustrates, rapid 30% rallies in the HUI tend to bode very well for the gold price. The five prior instances in which the HUI rallied more than 30% in a very short timeframe, the gold price subsequently jumped an average of 27%. A similar advance this time around would land gold at $1,160 an ounce by Christmas – or about $140 higher than today’s price.
No such rally is certain, of course. But the monetary stars seem to be aligning for both a short-term and a long-term advance in the gold market.
Joel’s Note: With so much tumult in the markets right now, it can be difficult knowing exactly how and, perhaps more importantly, when, to buy gold. Has China created an impenetrable floor? Or will the September rally swoon, giving you a better opportunity a few weeks or months from now? Or, will the gold bull have already bolted by then? There’s plenty to doubt…
Eric J. Fry, has been a specialist in international equities since the early 1980s. He was a professional portfolio manager for more than 10 years, specializing in international investment strategies and short-selling. Mr. Fry launched the sometimes abrasive, mostly entertaining and always insightful Rude Awakening. His views and investment insights have appeared in numerous publications including Time, Barron’s, Wall Street Journal, International Herald Tribune, Business Week, USA Today, Los Angeles Times, San Francisco Chronicle and Money. He appears regularly on business news stations including CNBC and Fox.
Technical Action Yesterday
Technical action by S&P 500 stocks remains bullish. Forty S&P 500 stocks broke resistance and one stock broke support (Qwest). The Up/Down ratio rose from 11.83 to (423/32=) 13.22, an all time high. Notable on the list of stocks breaking resistance were chemical, utility, and financial service stocks.
Technical action by TSX Composite stocks also remains bullish. Six TSX stocks broke resistance and none broke support. The Up/Down ratio increased from 5.36 to (120/20=) 6.00.
ETF News
The latest gold ETF was launched last week. Symbol is SGOL. Gold underlying the ETF is held in Zurich Switzerland.
Matt Blackman’s New Blog
Macro Market Monitor
* Markets on the move – Is this a ‘made in China’ recovery?
* Carry on currencies – Does the carry trade still moves stocks?
* Market Mythbusters – Do high price stocks really perform best?
Markets on the move…
Is this a ‘made in China’ recovery?
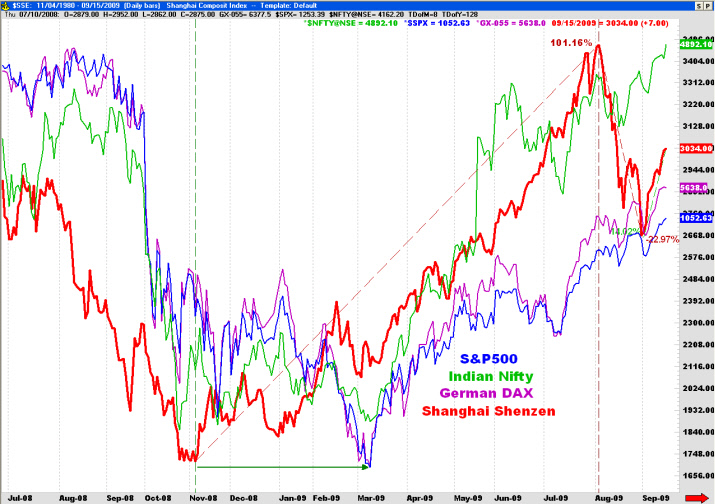
Since the turn of the millennium, China has been a rapidly growing economic powerhouse that has increasingly impacted markets around the world. In October 2007, stock markets were soaring and the S&P500 Index (SPX) hit a new all-time high of 1565 on October 9. Exactly one week later on Tuesday October 16, the Chinese Shanghai Composite (SSE) hit its all-time high of 6124.
Although the SPX high was never bested, the index stayed above 5000 until January 2008 but then rallied back above this psychological level again into May before falling off a cliff in September.
However, once the Chinese SSE had peaked, it wasted no time in heading for the basement. A year later it had lost a whopping 72% compared to a loss of 41% for the SPX over the same period.
….read more HERE and view 6 larger charts
With the Dow continuing its steady climb into September, economists are giddy with enthusiasm as they usher forth a stream of emotional pontification throughout the news media. Calls for a new bull market and an end to the recession are increasing with the rising levels of optimism (see: MarketWatch). How anyone can be bullish on stocks despite the innumerable economic warning signs is beyond my comprehension.
The recent figures in the Daily Sentiment Index reporting that traders are 89-90% bullish is a testament to human emotion as a market mover and the efficacy of state-run propaganda. Do economists really believe in the power of green shoots? Incidentally, the college term “green shoot” represents a different kind of stimulus. Maybe that explains it.
But one man’s bull market is another man’s gilded rally, as the mania always peaks at the end.
This mania has been especially intriguing to observe among gold bugs, presently vindicated by gold’s heroic push into four-figure territory. Some claim gold is “finally” on the verge of breaking out, as though the yellow metal hasn’t spent the entire decade breaking out.
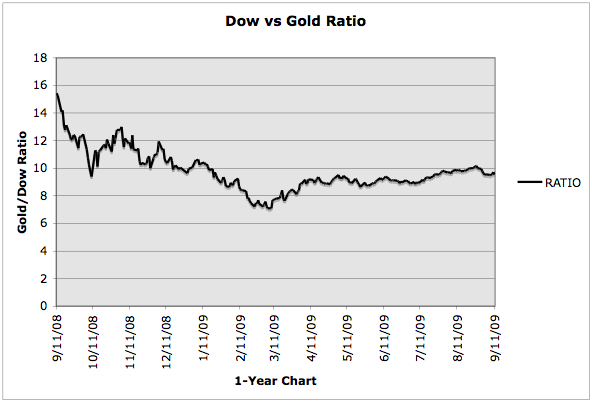
But the dollar price of gold, while important, is only a secondary consideration to its value against all other assets, hence the reason that many, like me, favor a strong gold position in a deflationary or hyperinflationary environment. Since gold is true money, and intrinsically, fiat currency is hardly worth the paper it is written on, then the value of assets in terms of gold is a better barometer of gold’s performance than its price in dollars. While gold’s push above $1,000 has been exciting for many, it is worth noting, as a rudimentary comparison, that gold has actually lost ground to the Dow in the last six months.
….read more HERE.
-
I know Mike is a very solid investor and respect his opinions very much. So if he says pay attention to this or that - I will.
~ Dale G.
-
I've started managing my own investments so view Michael's site as a one-stop shop from which to get information and perspectives.
~ Dave E.
-
Michael offers easy reading, honest, common sense information that anyone can use in a practical manner.
~ der_al.
-
A sane voice in a scrambled investment world.
~ Ed R.
Inside Edge Pro Contributors

Greg Weldon

Josef Schachter

Tyler Bollhorn

Ryan Irvine

Paul Beattie

Martin Straith

Patrick Ceresna

Mark Leibovit

James Thorne

Victor Adair