
Daily Updates
Ed Note: Some great links to explore
When everyone is a contrarian, no one is a contrarian. I consider this a corollary to the famous quote from Humphrey Neill: “When everyone thinks alike, everyone is likely to be wrong” (from a book I really enjoy but inconsistently apply “Art of Contrary Thinking“).
For the past several weeks, I have read and heard all types of conflicting interpretations about market sentiment as different kinds of contrarians attempt to prove their case.
Let’s begin with some of the data:
1. The American Association of Individual Investors recently reported that bullish sentiment is 42%, not an extreme, but part of a steady trend upward from the March lows.
2. The proprietary indicators at sentimenTrader indicate that both short-term and long-term sentiment are bullish and borderline extreme.
3. Short interest is at its lowest level since Februrary, 2007.
4. Insider stock sales peaked in August but remain higher than levels last seen in the second quarter of 2007. Add to this the massive amounts of stock companies are unloading into the market via secondaries and IPOs.
Jon Markman (Markman Capital Insight) recently argued that the Dow will hit 14,000 in two to three years. He dismisses sentiment indicators that include retail investors since they have (relatively) little money at stake. He claims that the “big money” is the dumb money and is extremely pessimistic. He cites a recent Goldman Sachs Group dinner where 14 out of 15 large hedge fund managers concluded stocks are overvalued. (This video explains Markman’s more nuanced perspective: a cyclical bull within a much larger secular bear market).
Finally, we have options expert Bernie Schaeffer who warns that anecdotal sentiment remains very bearish. Schaeffer references institutional money market funds, a survey of macro managers, hedge fund exposure, cash flows into stock mutual funds, and even the above Investor’s Intelligence survey (which was less bullish at the time he wrote) to support his case. He makes an excellent point about the self-reinforcing psychology of major market rallies: “Major stock market rallies have a way of causing bulls to become that much more bullish and bears to become weak and wobbly in their conviction level, as the opinions of the former group are reinforced by market action while the latter group is being regularly beaten up by Mr. Market.”
I am sure you can add your own many references to this soup!
As if it is not already difficult enough to sort out the sentiment story, insert the U.S. dollar into this mix. It is now well-recognized that the stock market rally is riding the back of a weak dollar. It now appears that the extremely cheap U.S. dollar is even caught up in the carry trade vortex that puts additional pressure on the currency. All the selling and fresh multi-month lows have generated quite a consensus that the dollar will continue to fall and has encouraged aggressive shorting of the dollar. This bearish sentiment on the dollar should imply bullish sentiment on the stock market given the mechanics of the current carry trade.
So, if market sentiment does indeed remain too skeptical, a contrarian would bet against this crowd but would also bet with the crowds stomping on the dollar’s neck. If market sentiment is actually very bullish, a contrarian would bet against this crowd and bet against the crowd shorting the dollar. I am biased to believe the latter scenario. I am still anticipating a relief rally in the dollar by shorting the British pound (and soon the Canadian dollar). To be consistent, I have to assume that such a rally will be precipitated/accompanied by a significant correction in the stock market. I currently do not think that either counter-trend move will be substantial in duration, just sharp in direction. Of course contrarians in the former camp could always assume that somehow the dollar and the market will finally follow each other higher.
Overall, no matter how we define the sentiment backdrop, it seems to me that as this stock market continues to press onward and upward, more and more people feel most comfortable dressing their opinion, bearish or bullish, in contrarian garb. And I am guilty as charged.
Be careful out there!
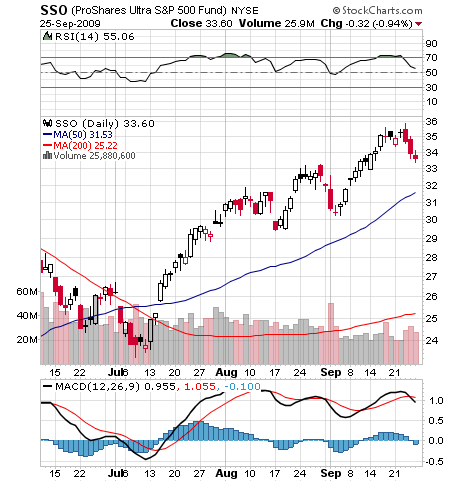
Full disclosure: long SSO puts
Dr. Duru is not a real doctor, but he played one in school. After getting a B.S. in Mechanical Engineering (and an honors degree in Values, Technology, Science and Society – now simply STS) from Stanford University, he decided to plow on and get his Ph.D. in Engineering-Economic Systems (now Management, Science, and Society…for now!). He has done a few gigs doing some independent consulting in mathematical modeling, slogged through management consulting in product development and technology strategy, and is now pounding the pavement helping companies to improve the pricing of their products through analytic software and rigorous analysis. In his personal life, he eats too much chocolate and still finds time to work-out and enjoy traveling. My website is dedicated to my varied and broad interests. While I do not perform miracle surgeries or cure world hunger, I am a self-proclaimed expert on money, knowledge management and organizational learning (or at least as of 1999!), and Kim Fields. You can find material on my site on all these topics. Finally, note that Dr. Duru serves as my name, the name of this site, and it happens to be a registered trademark.
Editor Note: Highly recommend that you take a monday morning visit to Don Vailoux’s monday report where he analyses an astonishing 40 plus Stocks, Commodities and Indexes.
History shows that September is the cruelest month of the year for equity markets.
Will equity markets weaken again this September?
Seasonal Influences
September historically has been the weakest month of the year for North American equity markets. During the past 10 Septembers, the S&P 500 Index dropped an average of 2.76% per period, the Dow Jones Industrial Average fell an average of 3.02% and the NASDAQ Composite Index plunged an average of 5.35%. Worst performing sector was the Semiconductor sector with an average drop of 12.35% per period. In Canada, the TSX Composite Index dropped and average of 3.28% per period.
Weakness in equity markets in September is universal:
The Nikkei Average dropped 2.21% per period, the London FT Index gave up 3.38%, the Frankfurt DAX Index lost 4.72%, the Frankfurt DAX plunged 4.72% and the Paris CAC fell 3.91%.
Fundamental influences
A series of annual recurring events tend to influence equity markets negatively in September:
• Institutional investors have a history of adjusting their equity portfolios after returning from holidays. In particular, many U.S. investment funds are looking for ways to improve tax efficiency of their portfolio prior to their fiscal year ending in October. They do so by liquidating underperforming securities prior before the end of October.
• Fundamental analysts tend to reduce earnings estimates for the current year prior to release of third quarter results. Analysts have a history of over-estimating annual results in the first half of the year following positive guidance offered in annual reports and annual meetings. By the third quarter, they realize that all of their projections are unlikely to be achieved by yearend and they respond accordingly. Also, September frequently is the time when analysts either reveal or refine their earnings estimates for the following year. Initially, analysts tend to be conservative.
What about this year?
The 50% gain by the S&P 500 Index and TSX Composite Index since March 9th has been partially in anticipation of at least a mild recovery in third quarter earnings on a year-over-year basis followed by a strong recovery in the fourth quarter. In fact, consensus earnings estimates for major companies on both sides of the border already are suggesting a much slower recovery. Consensus estimates for the 30 Dow Jones Industrial companies calls for an average (median) 18% decline. Consensus estimates for the fourth quarter calls for only a 4.4% gain. Look for analysts to lower third and fourth quarter estimates in September implying no recovery until at least the first quarter of 2010.
Post U.S. Presidential Election Influences
History is repeating itself!
History shows that U.S. equity markets tend to move higher in a post Presidential election year during the political “honey moon” period from March to July and tend to move lower from August to mid November after the political “honey moon” period is over. The August to mid November period focuses on uncertainties caused by the President’s inability to achieve key election promises. Sound familiar?
Technical influences
Technical indicators for most equity markets either are significantly overbought or have rolled over from overbought levels. Technical indicators, that are intermediate overbought, include Bullish Percent Index, Percent of stocks trading above their 50 and 200 day moving averages, Relative Strength Index, Moving Average Convergence Divergence and Stochastics.
What to do
Equity markets are overdue for at least a shallow correction into September. Preferred strategies include taking trading profits on investments with a short term time horizon and selling at the money calls against optionable longer term holdings. Calls expiring in October and November are preferred.
Don Vailoux wrote this piece in a Full Castlemoore report titled “Wasting Away” HERE.
The report titled “WASTING AWAY”includes a lot of charts and the following:
By Ken Norquay, CMT & Partner
Learning from our investment mistakes is challenging, especially if we think later, once the pain is gone, that we don’t have to learn anything.
MARKET RALLIES AND TIMEFRAME
By Robert “Hap” Sneddon, PM, FSCI, President & Founder
The 2000-2003 bear market is very similar to the current state of markets and economics, yet it has some deeper issues that weren’t around back then.
THE CHART PAGES
A visual observation of some canaries in the coal mines, a few things we watch that maybe portend of the state of affairs down in the deep.
LIQUIDTY
By Sheldon Liberman, PM, CCO
There’s been lots of talk liquidity and cash on the sidelines, both oft talked about current and future drivers of markets, but what do they really mean now and in the future.
Don Vialoux, Chartered Market Technician is the author of a free daily report on equity markets, sectors, commodities, equities and Exchange Traded Funds. Reports are available at www.timingthemarket.ca . Mr. Vialoux does not own Exchange Traded Funds or indices mentioned in this report.
Don Vialoux has 37 years of experience in the Investment Industry. He is a past president of the Canadian Society of Technical Analysts (www.csta.org) and a former technical analyst at RBC Investments.
Impossible! That’s what institutional investors say about “Timing the Market”. Mr. Vialoux will explain that, indeed, it can be done with the appropriate analysis. He also will explain why timing the market will be important during the next decade. Buy and Hold strategies are not working anymore; Investors are looking for alternatives. Mr. Vialoux will demonstrate four techniques that can be used to time intermediate stock market swings lasting 5-15 months. The preferred investment vehicles for investing in intermediate stock market swings are Exchange Traded Funds.
Comments in Tech Talk reports are the opinion of Mr. Vialoux. They are based on technical, fundamental and/or seasonal data that is believed to be accurate. The comments are free. Mr. Vialoux receives no remuneration from any source for these services. Comments should not be considered as advice to buy or to sell a security. Investors, who respond to comments in Tech Talk, are financially responsible for their own transactions.
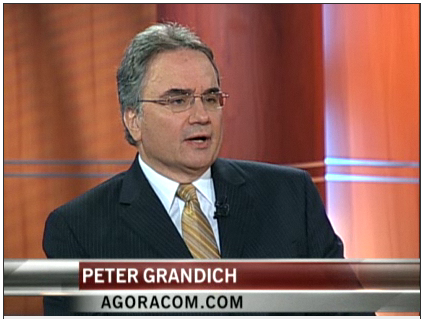
BNN speaks to Peter Grandich, chief market commentator, Agoracom.com. FOCUS: North American resource stocks (plus Gold). Click on Image or HERE.
Peter Grandich also shares his top picks…. 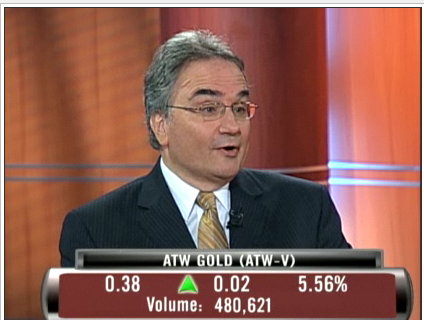
Peter Grandich, chief market commentator, Agoracom.com, shares his top picks. Click on the image or HERE.
On Major Moves, Grandich has been very right and not only saved many investors fortunes, but expanded them dramatically. On November 3, 2007 at the MoneyTalks Survival Conference, Peter Grandich of the Grandich Letter warned that “an unprecedented economic tsunami will hit American beginning in 2008”. Peter advised publicly to short the US market two days from the top in October, 2007 and stayed short until the last week of October, 2008. He began to buy stocks in March 7th, 2009. He also bought oil and oil related investments near the lows after the dive from $147.
….go to visit Peter’s Website.
This is a snippet from a recent issue of the Gold Forecaster with Subscriber-only parts excluded.
As an almost revered subject, the question of whether central banks across the world will be buyers or sellers of gold is one usually left until after the event. Central Banks themselves are usually very unhappy to talk about their gold policy. When they do it is a once-in-several-years-event. As a result we watch the behavior patterns of the last decade to see what lies ahead.
First we look at the I.M.F and look at just how it will support gold.
The I.M.F. Gold Sales.
We have been waiting so long for clarity on the policy the I.M.F. are to adopt with the sale of their 403.63 tonnes of gold. The IMF Executive Board has now approved the sale of 403.3 metric tons. The head of the I.M.F., Strauss-Kahn said, “These sales will be conducted in a responsible and transparent manner that avoids disruption of the gold market. Most importantly, the sales are strictly limited to 403.3 metric tonnes, which is one-eighth of the fund’s total holdings, so the IMF will continue to hold a relatively large amount of its assets in gold.”
Prior to selling the gold on the market, the I.M.F. is prepared to sell the gold directly to central banks or other official sector holders. These sales to official sector holders will be conducted at market prices and would shift official gold holdings without changing total official gold holdings.
Any gold sales on the market would be phased over time, the I.M.F. said. Regular external reporting on gold sales will also be provided to assure markets that gold sales are being conducted in a responsible manner.
Let’s be clear on this, if the I.M.F. are to offer this gold to other central banks before offering the gold to the ‘open market’ they are likely to receive bids that would certainly confirm that central banks [whether few or many is irrelevant] value gold in their reserves and are prepared to buy it in even at these prices! If all the 403 tonnes is sold this way, then that confirmation will elevate gold as a reserve asset and a measure of value.
If there is an amount left over, it will be sold in a manner that will not bring the price down brutally [avoids disruption of the gold market].
Which large $ surplus holding nations can afford this? Far more than just China or Russia! We expect the I.M.F. is already receiving offers from these central banks. So will any of this gold make it to the open market? What if only 100 tonnes are left for the market, what if none is left? Sales of this gold to any central bank will be positive for the gold price. Sales of all of it will bring a confidence to the gold price that will send it to new heights!
We believe that this statement from Strauss-Kahn, in itself is extremely positive for the gold price and will represent confirmation of gold’s role in the monetary system.
The New Central Bank Gold Agreement
Take a look at the Table above, on the tonnages of gold selling by the Central Bank Gold Agreement Signatories [in the latest Gold Forecaster – Subscribers only], over the last five years. With the final week of this Agreement on us, the future of European central bank selling becomes very clear to us.
As you can see, the original intention of the signatories to the Agreement was that they wanted to bring transparency to their gold sales, so as to make it clear to the world that they were not going to dump gold onto the market, a fear that had persisted for the previous 20 years prior to the “Washington Agreement”. To that end, they announced the amounts they were going to sell in the future. It was not an announcement to sell an amount during the five years of the agreement, but an announcement of their total future sales, as you can see in the Table.
Some countries made no announcement and made unexpected sales. The E.C.B., Spain and Belgium were the only countries that did this. But Belgium has not sold any gold since 2006 and Spain has not sold since 2007.
However, it became clear that these were limited, with the exception of the E.C.B. who confirmed they had sold, after the event. They have sold each year of the Agreement. The question is, “will they sell under the new Agreement starting September 26th 2009” [next week].
More importantly, since Switzerland’s announcement to sell an extra 150 tonnes, no announcements to sell have been made by any country that signed the Agreement. Take another look at this Table and you will see that the residual amounts still to be sold are very small and lie in the hands of countries that have not sold for the last three and two years respectively. Now add to that, that the number of signatories has increased substantially [with signatories who hold barely any gold anyway and with no announcements being made to sell from them] and you have a remarkable picture emerging. There appear to be no sellers among the signatories at all!
Yes, the agreement allows for up to 400 tonnes a year to be sold. But as we mentioned in an earlier essay, this 400 tonne limit allows for the I.M.F. to sell its 403 tonnes anyway it wishes under this agreement, in one shot, or over the period in dribs and drabs, whichever way they want to go. So this 400 tonnes is for the benefit not of the signatories, but for the I.M.F.!
But will they buy? Two points must be made here: –
1. The Agreement is an agreement to limit sales of gold and makes no reference to buying of gold.
2. The original purpose of selling the gold was in support of a newly launched currency, the €. Now it is well established there is no reason to sell more, particularly when one considers how against national interests past sales have been shown to be by a rising gold price.
With gold having risen nearly fourfold since the first European central bank gold agreement [the “Washington Agreement”] gold has proved itself as an invaluable reserve asset since the turn of the century. The problem is that the States and Europe are totally committed to paper currencies, with only a hidden and almost unrecognized backing of gold. Gold in this role is only designed for use in case of emergency [in extremis]. For the States or Europe to be seen to be buying gold would be seen as an admission of failure of the paper currency system. So while they will no longer be sellers of gold, we doubt they will be buyers in the next couple of years.
Their support of the gold price comes then from the termination of their sales, removing what was up to 400 tonnes supply from the market?
Russia
So will any central banks will be buyers? Russia has stated it wants to see 10% of its reserves in gold, but that is now several thousand tonnes of gold, just not available at anywhere near current prices. But they are on record as having bought in the ‘open’ market. They have bought up to 4 tonnes a month this year [9 tonnes in August] and from the end of last year. But they have made no announcement on whether they have been buying gold from local producers, before it reaches the open market. If they are buying locally, then the amount of 1 tonne a week they are buying in the open market must be in addition to this. We will have to wait until the evidence is before us before we can say they bought over 300 tonnes this year.
China
At one point China held only 300 tonnes in the gold and foreign exchange reserves. Then an announcement was made that they had doubled this to 600. Now this year they again announced that they had been buying gold at the rate of 91 tonnes a year since then. At the moment this reserve level is 1,054 tonnes. The Chinese way of accounting and buying allows for this to be hidden. This past week we heard from Mr. Cheng of the Chinese government who made this extraordinary comment to Mr. Ambrose Evans-Pritchard of the Daily Telegraph, “Gold is definitely an alternative, but when we buy, the price goes up. We have to do it carefully so as not stimulate the market,” he said. Why is this extraordinary? Because China produces the most gold in the world and can also buy from local producers, without a ripple in the market place. Unless it buys in the ‘open’ market, China cannot ‘stimulate the market’ except in the longer term because of the reduction in supply. It certainly does not make sense to buy in the ‘open’ market without buying local production too. While it is an assumption, at the moment, it appears that China is buying at least 91 tonnes a year [as they reported] and with local production of over 270 tonnes, it looks like they are buying around 90 – 360 tonnes a year?
Will other central banks start to buy gold? We know that South Africa has stated that they are gold buyers, but not the amount. We believe that other central banks will become buyers, if they are in a surplus position to do so. We could not say when. If the $ does crash [$1.60+: €1] it is more than likely than many central banks will become buyers, but we will only know after the event.
But while Russia and China are buying, the pressure on other banks to buy gold is growing as the $ and other currencies become subject to difficult questions.
So we do believe that gold already is attractive to central banks. They will keep silent on this at all times because of the fear of “stimulating’ the market. Nevertheless their actions and inactions are supporting if not raising the gold price!
The Impact on the Gold Price in price terms?
For Subscribers only!
To subscribe go HERE.
In Global Watch – The Gold Forecaster, we present the global picture as it relates to gold and while synthesising these factors to forecast the gold price.
The price of gold is an amalgam of diverse and changing influences. From different world urrencies to jewellery, from investors to speculators, from the U.S. to India, from Australia to Canada, from South Africa to Asia, the gold price is of interest to all. It cannot be seen in isolation as a metal, but must be understood as a Global Thermometer measuring monetary, political, and economic stability.
These factors do not merely add up to the price but interact -in sometimes irregular ways- to produce the gold price. For example, rising prices often lead consequently to rising demand, as the appetite for the metal grows. Its price may rise in one currency and simultaneously fall in another. The price of gold reacts sensitively to the overall level of global stability.
It is our task in this letter to track these different features, giving you both the Technical Analysis and the Fundamental features impacting the gold price each week. It is our goal to help you to understand and profit from this market, wherever you are on this globe. We welcome any input or observations you may have, which contribute to the enhancement of this service.
Read this full 22 page report HERE.
TWO OUT OF THREE AIN’T BAD
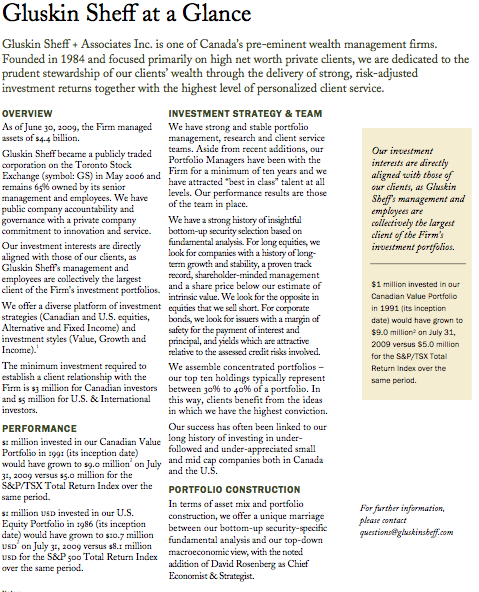
Now to be fair, while I was never bullish enough at the lows, I never advised clients to stay in cash either. There is more than one way to skin a cat, and frankly, even at the lows I never did consider equities to possess greater return potential than corporate bonds, which were priced for a much worse economic outcome (and that remains the case today, though the gap has narrowed). There was more than one report I wrote on this file in my last few months at Merrill Lynch, and several thereafter at my new digs, though the portfolio managers at Gluskin Sheff were on top of this story long before I came on board and our clients have been served well by this income-oriented strategy, especially for the comparable risks involved.
In fact, looking at the U.S. data, investment-grade credit — not junk, but good quality credits — have actually moderately out-returned the equity market so far this year. We doubt that is a factoid that you will hear on Fast Money!
And, I also published a series of positive commentaries on the outlook for commodities, and indeed, the CRB index, so far in 2009, is up more than 20% and the Goldman Sachs Commodity Index has rallied 30% — both outpacing the S&P 500.
So, I did miss the magnitude of the equity bull-run, but as Meatloaf said, “two out of three ain’t bad.”
BULL MARKET IN COMMODITIES = CANADA TO OUTPERFORM THE U.S.
We believe that commodities are in a secular bull market, and this is where Canadian outperformance relative to the United States comes into play — nearly 45% of the TSX composite index is in resources; almost triple the share in the U.S. Almost 60% of Canada’s exports are linked to the commodity sector, roughly double the U.S. exposure. This explains how it is that the Canadian equity market has managed to outperform the S&P 500 this year by a cool 2,000 basis points (in this sense, Canada is basically a low-beta way to play the emerging markets via commodity exposure).
-
I know Mike is a very solid investor and respect his opinions very much. So if he says pay attention to this or that - I will.
~ Dale G.
-
I've started managing my own investments so view Michael's site as a one-stop shop from which to get information and perspectives.
~ Dave E.
-
Michael offers easy reading, honest, common sense information that anyone can use in a practical manner.
~ der_al.
-
A sane voice in a scrambled investment world.
~ Ed R.
Inside Edge Pro Contributors

Greg Weldon

Josef Schachter

Tyler Bollhorn

Ryan Irvine

Paul Beattie

Martin Straith

Patrick Ceresna

Mark Leibovit

James Thorne

Victor Adair