
Daily Updates
Ed Note: Tyler Bollhorn gave superb insights into how to trade in the Money Talks in the Money Talks Super Summit last weekend available by video HERE.:
When to Sell
Stockscores.com Perspectives for the week beginning Nov 2nd, 2009
![]()
Knowing when to sell is one of the four things that you need to master if you are to trade the market successfully. Selling is challenging because we get wrapped up in the emotions of taking a loss or not maximizing our profit. Ultimately, it is fear and greed working against us to hurt our trading performance.
Having a succinct set of rules and processes is a big help for any decision that can be affected by emotion. Everyone should establish their rules for entry, risk management and exit as part of their trading plan. Here are some things to consider to help with the exit decision.
First, we need to understand what trend lines, support, resistance, price volatility and trigger candles are. These are each relatively simple concepts of technical analysis which help to provide the signals to exit a trade.
A trend line defines the general movement of the market over time. An upward trend is in place when the bottoms are rising from left to right. These bottoms are the points where price stops going down and starts going up, I often refer to these as inflection points. By drawing a line across the inflection point lows, you can define the upward trend line.
- Get the StockSchool Pro Free

- DisnatDirect named the number one Canadian brokerage for Traders by Surviscor! Open and Fund a brokerage account with DisnatDirect and receive the StockSchool Pro home study course free, including special Pro level access through the DisnatDirect client website. Offer only available to Canadian residents. For information, click here
Support and resistance are similar in concept to trend lines; they act as floors and ceilings on price movement. Support is a floor that the market has established over time, it is a low point that demonstrates the minimum investors are willing to accept for the current fundamentals of the company.
Resistance is the opposite, it is a ceiling price which demonstrates the maximum amount investors are willing to pay for the fundamentals over time.
How much price changes over time defines the price volatility for the stock. The more price volatility, the more uncertainty investors have about the value of the company’s fundamentals. Investors are confident about the stock’s price when a stock is trading with very narrow price volatility. So, a stock breaking from low price volatility is an indication that there is new information that justifies the change in price.
Finally, trigger candles are something that I have defined in the StockSchool course material. They are candles whose range are taller than most of the candles before it. These candles represent a period of time when the buyer or sellers were motivated to push price beyond its normal range. Trigger candles occur on days when the market has a strong opinion.
So, how do we use these tools to tell us when to sell? Here are some rules for buying, you can reverse them for short selling:
– Plan to take a loss on a stock if its price falls and closes below the support price established before the entry signal.
– Upward trends take time to develop which means we have to be patient with stocks early in their upward trend. I find it is best to not look for an exit signal (unless you are getting stopped out at a loss) until the stock has doubled its risk amount. The risk amount is the difference between the entry price and the stop loss price.
– Once the stock is in an upward trend and has doubled its risk amount, exit the trade if an orderly, linear upward trend line is broken.
– If the stock runs far above its upward trend line, the market has become emotional and a pull back to the trend line is likely. To protect profits in this situation, plan to exit if the stock closes below the low of the last green trigger candle.
– A new rule that I am giving some consideration to now is to use a more aggressive exit strategy if the overall market is showing signs of abnormal selling. Since the overall market can drag even the strongest of stocks lower, it is a good idea to dance close to the exit door when the market is suffering a break down.
While these rules are quite simple, they do require some practice to see effectively. I expand upon these rules in the Exit Signals video available in the Online Video Training area of Stockscores.com.
![]()
The market has broken some support levels and is showing signs that it may go lower from here. With that in mind, I applied the Reversal of Fortune Strategy this week to find some stocks that have good potential to go lower. You can trade these stocks by going short or considering Put options which will gain in value as prices fall.
I would watch for a confirming entry signal on the intraday, 15 minute charts for all these trade ideas as there is a chance that the market will bounce back early next week, although it is not the probable outcome.
![]()
1. WIT
WIT broke its upward trend line on Friday with strong volume, indicating the sellers are finally motivated to take some money out of this stock. Resistance at $19.25.

2. XLK
Play weakness in the overall technology sector with a short on the XLK ETF which is breaking down from a rising wedge pattern. Resistance at $21.25
Click HERE for the Speaker Lineup and to REGISTER if you want to learn from some of the worlds best traders.

Tyler Bollhorn started trading the stock market with $3,000 in capital, some borrowed from his credit card, when he was just 19 years old. As he worked through the Business program at the University of Calgary, he constantly followed the market and traded stocks. Upon graduation, he could not shake his addiction to the market, and so he continued to trade and study the market by day, while working as a DJ at night. From his 600 square foot basement suite that he shared with his brother, Mr. Bollhorn pursued his dream of making his living buying and selling stocks.
Slowly, he began to learn how the market works, and more importantly, how to consistently make money from it. He realized that the stock market is not fair, and that a small group of people make most of the money while the general public suffers. Eventually, he found some of the key ingredients to success, and turned $30,000 in to half a million dollars in only 3 months. His career as a stock trader had finally flourished.
Much of Mr Bollhorn’s work was pioneering, so he had to create his own tools to identify opportunities. With a vision of making the research process simpler and more effective, he created the Stockscores Approach to trading, and partnered with Stockgroup in the creation of the Stockscores.com web site. He found that he enjoyed teaching others how the market works almost as much as trading it, and he has since taught hundreds of traders how to apply the Stockscores Approach to the market.
References
Get the Stockscore on any of over 20,000 North American stocks.
Background on the theories used by Stockscores.
Strategies that can help you find new opportunities.
Scan the market using extensive filter criteria.
Build a portfolio of stocks and view a slide show of their charts.
See which sectors are leading the market, and their components.
Disclaimer
This is not an investment advisory, and should not be used to make investment decisions. Information in Stockscores Perspectives is often opinionated and should be considered for information purposes only. No stock exchange anywhere has approved or disapproved of the information contained herein. There is no express or implied solicitation to buy or sell securities. The writers and editors of Perspectives may have positions in the stocks discussed above and may trade in the stocks mentioned. Don’t consider buying or selling any stock without conducting your own due diligence.
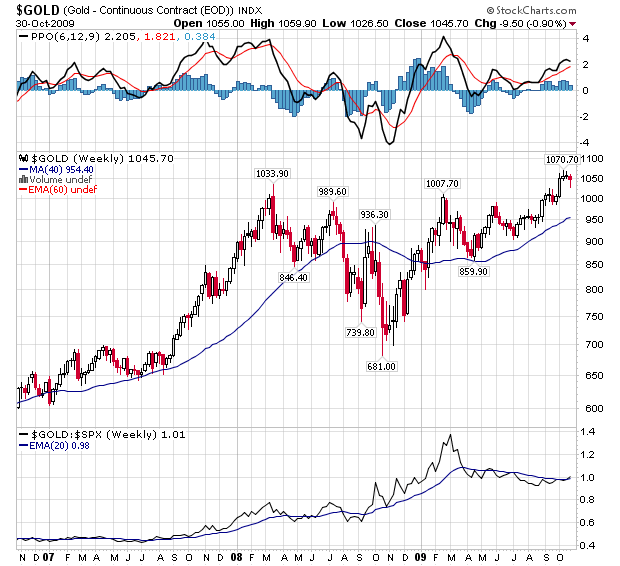
Ed Note: Below is a very small excerpt from Mark Leibovit’s tremendous 11 page VR Gold Letter. The VR Gold Letter is published WEEKLY. This excerpt from 01/11/09.
Recall, I flashed TIMER DIGEST ‘Sell’ signal (for Stocks) on October 15! TIMER DIGEST reports in its most recent edition (October 26), that I hold the #2 national Market Timer slot for the past 3 months!
Let me say, first, that the current decline in Gold (and other precious metals) is a GIFT! It has been predicted by the Annual Forecast Model (above in his letter) and you should use any and all weakness to consider adding to your positions on the long side. Assuming the Annual Forecast Model is ‘spot-on’ and we hit our nadir in late November or early December – all the better, but markets can turn early and we have to watch the chart patterns (including the formation of Positive Volume Reversals ™ carefully) between now and then.
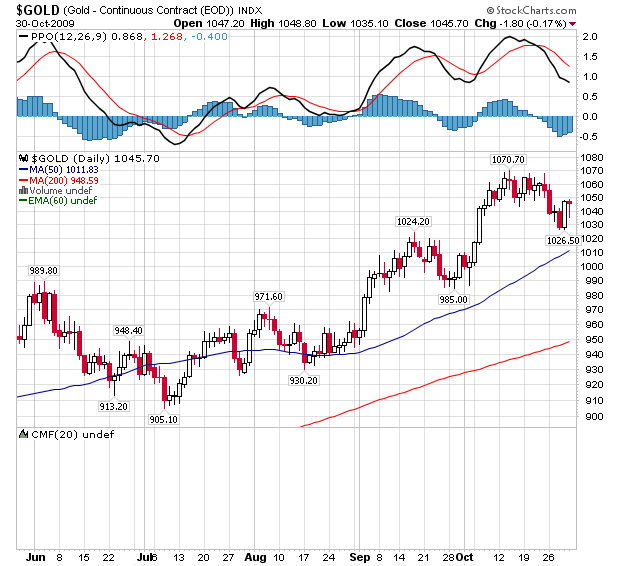
The big picture remains the same. I’ve often alluded to my ’ten-times’ rule, i.e., identifying that some markets increase by the power of 10, especially over a 10 or 20 year period. The classic examples are the Dow Industrials from 1000 to 10,000 plus and home prices which in some markets increased ‘ten-times’, e.g., $50,000 to $500,000+. Gold’s low of 290 back in 1999 multiplied by ten equals 2900.
I have read that noted trader/investor Paul Tudor Jones (a former subscriber to my newsletter) feels that “on a macro perspective how gold is not consumed but rather accumulated, and as a store of value as it has been a medium of exchange for over 5,000 years. Ed Note: read Paul Tudor Jones The Next Boom -Gold article HERE.

From David Einhorn at Greenlight Capital (October 19, 2009) (posted in Mark’s 01/11/09 VRTrader Newsletter)
“In the context of the recent economic crisis, a highly motivated and organized banking lobby has demonstrated enormous influence. Bankers advance ideas like “without banks, we would have no economy.” Of course, there was a public interest in protecting the guts of the system, but the ATMs could have continued working, even with forced debt-equity conversions that would not have required public funds. Instead, our leaders responded by handing over billions of taxpayer dollars to protect the speculative investments of bank shareholders and creditors. This has been particularly remarkable, considering that most agree that these same banks had an enormous role in creating the mess which has thrown millions out of their homes and jobs. Like teenagers with their parents away, financial institutions threw a wild party that eventurally tore up the neighborhood. Government chose to bail them out, but then the question becomes, once you bail them out what do you do to discipline the misbehavior…..
The VR Gold Letter is available to Platinum subscribers for only an additional $20 per month, while for Silver subscribers the price is only an additional $70.00 per month. Prices are going up very shortl, so act now! Separately, the VR Gold Letter retails for $1500 a year! The VR Gold Letter is published WEEKLY. It is 10 to 16 pages jam-packed with commentary and charts. Please call or email us right away. Tel: 928-282-1275. Email: mark.vrtrader@gmail.com .

Marks VRTrader Silver Newletter covers Stock, TSE Stocks, Bonds, Gold, Base Metals, Uranium, Oil and the US Dollar.
More kudos – Mark Leibovit was named the #1 Intermediate Market Timer for the 10 year period ending in 2007; the #1 Intermediate Market Timer for the 3 year period ending in 2007; the #1 Intermediate Market Timer for the 8 year period ending in 2007; and the #8 Intermediate Market Timer for the 5 year period ending in 2007. NO OTHER ANALYST SURVEYED APPEARED IN ALL FOUR CATEGORIES FOR INTERMEDIATE MARKET TIMING AS PUBLISHED IN TIMER DIGEST JANUARY 28, 2008!
For a trial Subscription of The VR Silver Newsletter covering Stocks, Bonds, Gold, US Dollar, Oil CLICK HERE
Home foreclosures have leapt into the hundreds of thousands…
….and experts predict that it will be worse next year. These foreclosed homes go to the banks. They tend to put banks in the real estate business, which is the last thing the banks want. So the banks sell or dump foreclosed homes at whatever price the market will bring.
My test of values in homes is as follows (it costs you 10% a year to carry a home) — when you can buy a home and immediately rent it out and make a profit on you original purchase plus expenses, that house is a value. Right now, real estate is hated. Too many people have lost their life savings in real estate. But the fact is that many foreclosed homes are now selling below the cost of replacement. And as commodity prices rise, this disparity will grow.
My conclusion is that many homes foreclosed by the banks and purchased from the banks are bargains. Today’s disaster may be tomorrow’s winner.
Stocks– Without a strong November and December, this decade will be the worst decade in stock market history. The decade from Jan. 1930 to Dec. 1939 showed a net loss of -1.7%. From Jan. 2000 to the present the S&P 500 has lost 13.8%. It will take a big November and December to take the current decade out of the “worst in history” class (statistics courtesy of InvestTech Research).

Sundry items — Without a strong November and December, this decade will be the worst decade in stock market history. The decade from Jan. 1930 to Dec. 1939 showed a net loss of -1.7%. From Jan. 2000 to the present the S&P 500 has lost 13.8%. It will take a big November and December to take the current decade out of the “worst in history” class (statistics courtesy of InvestTech Research).
By 2040 senior citizens will comprise 40% of the US population. Japan has 40,000 individuals over 100. (fish and very little meat?)/
The US has the highest fertility rate of any developed nation — 2.1, partly due to immigration groups. In the US unmarried women now give birth to four out of every ten kids.
More people in the US live alone than at any other time in US history. Now that women are working, many would rather live alone than with an “unsatisfactory” mate. Women no longer need a husband to support them. And many don’t want one.
How big is Russia? Russia is 17,075,000 square km. The US is 9,372,000 sq.km. China is 9,561,000 sq. km. about the same as the US. Brazil is 8,512,000 sq. km. Saudi Arabia is 2,200,000 sq. km.
Headline article in the current Newsweek magazine — “Working Women Are Poised To Become the Biggest Economic Engine the World Has Ever known. . . The vast majority of new income growth will go to women, due to a narrowing wage gap and rising female employment. . . . Women already control $12 trillion of the world’s $18.4 trillion in annual consumer spending. And that proportion will likely rise.”
Russell Comment — Follow the money. Subscribers know that I believe this century will be known as “the world rise and empowerment of women.” Women are so important to a nation’s welfare that pressure will now come to all undeveloped nations who “keep women down.” The state of civilization can be judged by how a nation treats its women. Women all over the world (including African women) are rising and fighting for equality. Even Saudi Arabia is giving in to what I call the “women force.” I, Russell, have four daughters, so of course I’ve always been an advocate for women’s rights.
In thinking over the weekend, it occurred to me (light bulb turns on) that everyone has a THEME that, in some ways, dominates and directs their lives. That theme is the driving force, the core of a lifetime’s desire, that runs through every person’s life. After pondering over the idea for hours, it occurred to me that my own theme is “staying alive.” I was born struggling to stay alive. That theme colored my life. My fascination with Cacti fits into my theme. Cacti are the ultimate survival plants. The stock market — learning to read the stock market gives one the advantage of possibly knowing what lies ahead. The theme of staying alive has entered into everything I do. It’s the reason why, in investing, I’m so careful to avoid taking the big loss. “He who sells and runs away, lives to invest another day.” If you invest intelligently and systematically over the years and avoid the big loss, you’ll probably end up at least prosperous.
You might think about a theme in your own life. Is your theme success, domination, making money, leadership, happiness, conquest, curiosity, helping others, adventure? Ask the average person what the theme of their life is, and they’ll look puzzled. They never thought about their life having a theme. Every person has a theme in their life. It’s worth knowing what that theme is. If you’re honest with yourself, you can identify your theme.
A brief excerpt of the lengthy daily internet comment by Richard Russell of Dow theory Letters. One of the best values anywhere in the financial world at only a $300 subscription to get his report daily for a year. HERE to subscribe.
The 84 yr. old writes a market comment daily since the internet age began. In recent years, he began strongly advocated buying gold coins in the late 1990’s below $300. His position before the recent crash was cash and gold.
There is little in markets he has not seen. Mr. Russell gained wide recognition via a series of over 30 Dow Theory and technical articles that he wrote for Barron’s during the late-’50s through the ’90s. Russell was the first (in 1960) to recommend gold stocks. He called the top of the 1949-’66 bull market. And almost to the day he called the bottom of the great 1972-’74 bear market, and the beginning of the great bull market which started in December 1974. He loaded up on bonds in the early 80’s when US Treasuries where yielding 18%.
“I have never been a gold bug,” he says in the letter. “It is just an asset that, like everything else in life, has its time and place. And that time is now.”
In his latest letter to investors, hedge fund manager and legendary trader Paul Tudor Jones outlines his firm’s thoughts on the topics of equities, bonds, and currencies. Tudor’s letter is one of those ‘must reads’ as his macro sense is phenomenal and he is one of the greatest traders of all time (performance returns summary here). What’s interesting about his latest letter is the fact that they included a special section addressing the all too talked about precious metal.
Gold
The macro perspective section of their letter notes how gold is not consumed but rather accumulated as a store of value as it has been a ‘medium of exchange for over 5,000 years.’ What’s interesting is that they plot out inflation-adjusted gold prices and note that we are still far off from the highs seen over 2 decades ago. Tudor puts the inflation-adjusted peak price of gold to be between $1,600-$2,400, with the previous high coming in at $2,422. While Tudor says he has never been a gold bug, he says all assets have a time and a place. And conveniently enough, he says now is gold’s time. Tudor joins an army of other prominent hedge fund managers bullish on the precious metal including David Einhorn of Greenlight Capital who has gone as far as storing physical gold. Additionally, John Paulson of Paulson & Co has $4 billion in gold investments, among many other managers.
Tudor’s econometric model has determined that gold is 20% undervalued over the next 24 months. This takes into consideration real rates on the price of gold, inflation, and M2 growth. Tudor expects the velocity of money to rise over the next two years, enhancing the bullish case for gold. Additionally, they also cite the supply/demand equation and prudently bring up the fact that a new class of investors has arrived: retail investors gaining access to the metal through exchange traded funds (most notably GLD). Tudor then presented these amazing facts: “The trailing 12-month ETF accumulation has “bought” the equivalent of 25% of new mine production consistently since the beginning of the year. By year-end 2009, the total ETF gold position will hold 3% of global available supplies, making ETFs the sixth largest holder of gold in the world.” Tudor expects inflows into these vehicles to continue, furthering the case for a position. Lastly, Tudor highlights another important factor in the gold equation: central banks. He notes that in the second half of this year, the ‘official sector will become a net buyer of gold.’ We also yesterday posted up an excellent technical analysis video on gold which concurs that gold is in a long-term uptrend. The video outlines $1000 as a key level to stay above and outlines buy points at support as well as price targets going forward.
Curve Flatteners
Turning to the bond markets, Tudor has found it difficult to find good risk/reward setups, with only the curve flattener seen as appealing. This is very interesting to note given that we’ve covered prominent hedge fund player Julian Robertson had previously been in the opposite trade – a curve steepener. It’s always great to see two prominent minds in hedge fund land differ in this ongoing debate. (Interestingly enough, Robertson also disagrees with Tudor in regards to gold, as he favors gold miners instead).
Tudor notes that curve flatteners provide ‘tail risk insurance’ against the trades of long gold, short the US dollar, and long equities. Tudor writes, “As deflation recedes to the background, market participants will start expecting a removal of policy accommodation. If the markets begin to price early, fast and large tightening before inflationary expectations are allowed to take hold, then curves could bear-flatten significantly from current historically high levels.”
Currencies
On the topic of currencies, Tudor shares the views of many other hedge fund managers in that they feel currencies of commodity producing nations should benefit, specifically citing the Australian Dollar. And, of course, we would be remiss not to mention that Tudor thinks the dollar will continue its decline.
Equities
Turning his focus to equities in the letter, we found this paragraph on the technicals to be intriguing:
Technical considerations can be characterized as suggesting that near-term risk should be limited at worst. Market breadth has remained mostly favorable, even rendering a third “thrust” signal of the rally in early September. These are noteworthy not only because they are rare, but more importantly, because they indicate a level of demand that typically proves sustainable. Within the half-year following such signals it is unusual to see corrections of even 10%. Seasonally, equity markets will soon exit a period of traditional weakness to enter one flattened by the impulse to chase performance and generate returns by year-end. While many of our surveys of aggregate hedge fund positioning would say net long exposure has rebounded to late 2007 percentages (though on a smaller base), and mutual fund cash/asset ratios have come in significantly, markets continue to trade as if most are not satisfied with their current commitment to equities.
Great insight from Tudor and we’ll have to see if that pans out. As far as their equity selections go, they favor emerging markets – in particular Brazil and Taiwan.
Overall, great insight and it’s definitely interesting to see an in-depth presentation on gold from the global macro specialists. In the letter, we also find out that Tudor is up 14.88% year to date for 2009 and currently has over $11 billion in assets under management. Jones has somehow managed to perfectly summarize the market action, labeling it “The Great Liquidity Race: Wall of Money Climbs Wall of Worry.”
Embedded below is Tudor’s Q3 letter, courtesy of Dealbook where we recommend using the full-screen option for reading:
After oscillating within a trading range for several weeks, the price of crude oil has recently broken out to a new recovery high. Now, you will recall that we have been firm believers of ‘Peak Oil’ since 2003 and we were expecting this bullish resolution.
Look. Skeptics can say what they want; it does not change the fact that our world is struggling to maintain daily flow-rates. Whether you agree with us or not, the energy reality is that the supply of conventional crude oil is very close to its peak and no other fuel source can easily fill the supply gap.
Yes, various governments are now promoting alternative sources of energy and over the following years, we expect this drive to intensify. But those sources will provide too little, too late. So there remains, today, an unbelievable degree of denial when it comes to ‘Peak Oil.’ Most people simply dismiss it as a conspiracy. Others gleefully point to alternative sources of energy, whereas some believe that the vast improvements in oil drilling technology will save the day. Do not be seduced by these delusional hopes.
Remember, crude oil is the lifeblood of the global economy and roughly 70% of it is used to power transportation. Moreover, a vast amount of crude oil is also used up by agriculture (production of fertilizers, pesticides and irrigation systems). In fact, modern-day agriculture can be best described as a process of converting hydrocarbons into calories. Without cheap energy, the world would certainly have trouble producing half of the current food supply and the result could be far worse.
Thus, crude oil is a key ingredient in two of the most critical processes which make modern life possible – transportation and agriculture. And shortages of this vital natural resource will result in extreme pain. In the initial stages, the price of crude oil will rise remorselessly and eventually, we will face rationing.
Now that we have established the importance of crude oil, we will explain why new drilling technology and alternative sources of energy will not make this problem go away.
First, as far as drilling technology is concerned, it is worth noting that America is home to the best oilfield technology on this planet. However, its oil production peaked in the early 1970s and has been in a relentless decline. Furthermore, apart from America, other technologically advanced nations in the world have also failed in maintaining their daily flow-rates. For instance, after exporting crude oil for over two decades, Britain is now a net importer and its production is in a state of permanent decline. Hard data confirms that two of the most advanced countries in the world now live in a post ‘Peak Oil’ era, so what are the odds that other less fortunate nations will succeed in averting ‘Peak Oil’?
Secondly, as far as alternative sources of energy are concerned, they represent a drop in the energy ocean and will not be able to offset the depletion in crude oil. Despite all the euphoria surrounding renewable energy, the ‘sources’ like ethanol and solar panels are net energy losers. In other words, it takes more energy to produce ethanol and solar panels than the energy you obtain from them. For sure, hybrid and electric cars will help us to some degree but you must keep in mind the fact that electricity is not a source of energy; it is a carrier of energy. Even if electric cars become popular, how will we generate sufficient electricity?
Elsewhere in the alternative energy patch, a lot of hopes currently rest on unconventional sources of oil (especially tar sands and shale oil). Once again, this optimism is misplaced, as the increased supply from the unconventional sources will not even make a dent in the overall energy picture. The nearby chart confirms that our world currently produces roughly 85 million barrels per day of total liquids and out of this gigantic sum, only 13 million barrels per day of oil is derived from unconventional sources. So, when the production of conventional crude oil finally declines due to ‘Peak Oil’, it is extremely improbable that unconventional supply will be able to rise to the challenge.
Source: Oilwatch Monthly, IEA and EIA
As far as Canada’s tar sands are concerned, Alberta currently produces roughly 1.4 million barrels of oil per day and under the best case scenario, this figure is expected to rise to just 3.5 million barrels per day by 2020. To complicate matters even further, the tar sands require huge amounts of water and natural gas. In addition to this, the mining procedure is extremely polluting. For example, the process of extracting ‘oil’ from bitumen releases at least three times the amount of carbon dioxide emissions as regular oil production. Accordingly, we have no doubt in our minds that Canada’s tar is not the Holy Grail.
Finally, the new oil shale discoveries in America are not going to help us either because the ‘oil’ trapped in the shale is in fact kerogen – a precursor to oil. So far, all major oil companies have struggled to convert the kerogen into usable oil and it will be interesting to see whether any of them succeeds in the future. In any case, this conversion process is extremely expensive and we can assure you that shale will not be producing any oil at today’s prices. Recent studies reveal that the price of oil will have to rise to several hundred dollars per barrel to make this process economically feasible.
Well, now that we have covered the supply side, let us briefly discuss the demand side of the equation. According to the IEA, global oil usage in 2009 will amount to 84.4 million barrels per day and it will rise to 85.7 million barrels per day in 2010. This means that oil demand will rise by 1.5% over the next twelve months which is in line with the growth rate over the past two decades. If this growth rate continues over the next 4-5 years, there is no way our world will be able to ramp up production.
Unfortunately, positive thoughts and wishful thinking will not change the equation. Precious time has been wasted and we have no margin of safety. We must prepare ourselves for sky-high commodity prices and periods of acute shortages, which will make wartime conditions seem rosy. In fact, we believe we are already a decade into this painful transition but let us warn you that we have seen nothing yet.
If our assessment is correct, it seems prudent to make a sizeable allocation to the energy sector. However, given the realities of ‘Peak Oil’, we do not recommend exposure to the oil majors, as their reserves and production are in decline. On the contrary, we urge you to invest your capital in quality upstream oil/gas companies and businesses involved in the energy services sector.
Regards,
Puru Saxena,
Puru Saxena is the founder of Puru Saxena Wealth Management, his Hong Kong based firm which manages investment portfolios for individuals and corporate clients. He is a highly showcased investment manager and a regular guest on CNN, BBC World, CNBC, Bloomberg, NDTV and various radio programs.
He also publishes a widely read economic report, Money Matters, which is available from www.purusaxena.com
SPECIAL REPORT: The Most Aggressive Wealth Creation in History: 47 New Millionaires Every Day… and a New Billionaire Every Month
-
I know Mike is a very solid investor and respect his opinions very much. So if he says pay attention to this or that - I will.
~ Dale G.
-
I've started managing my own investments so view Michael's site as a one-stop shop from which to get information and perspectives.
~ Dave E.
-
Michael offers easy reading, honest, common sense information that anyone can use in a practical manner.
~ der_al.
-
A sane voice in a scrambled investment world.
~ Ed R.
Inside Edge Pro Contributors

Greg Weldon

Josef Schachter

Tyler Bollhorn

Ryan Irvine

Paul Beattie

Martin Straith

Patrick Ceresna

Mark Leibovit

James Thorne

Victor Adair