
Daily Updates
The Bottom Line
The “Buy when it snows, Sell when it goes” strategy has started to work once again. Overbought intermediate technicals suggest that magnitude of an advance between now and year end is likely to be muted, but positive. Accumulation of broadly based equity index ETFs as well as sector ETFs with favourable seasonal characteristics makes sense during the next few weeks (particularly on any weakness). Sectors with favourable seasonal influences at this time of year include Information Technology, Consumer Discretionary, Industrials (including Transportation), Canadian Financial Services and Basic Materials.
….go HERE to get extensive analysis and ove 45 Chart and of the more interesting and profitable seasonal trades at this time of year historically has been a trade in Canada’s Financial Services sector. Will the trade work this year?
Editor Note: Highly recommend that you take this monday morning visit to this Don Vailoux monday report where he analyses an astonishing 40 plus Stocks, Commodities and Indexes.
Don Vialoux has 37 years of experience in the Investment Industry. He is a past president of the Canadian Society of Technical Analysts (www.csta.org) and a former technical analyst at RBC Investments. Now he is the author of a daily letter on equity markets available free on the internet. The reports can be accessed daily right here at www.dvtechtalk.com.
Impossible! That’s what institutional investors say about “Timing the Market”. Mr. Vialoux will explain that, indeed, it can be done with the appropriate analysis. He also will explain why timing the market will be important during the next decade. Buy and Hold strategies are not working anymore; Investors are looking for alternatives. Mr. Vialoux will demonstrate four techniques that can be used to time intermediate stock market swings lasting 5-15 months. The preferred investment vehicles for investing in intermediate stock market swings are Exchange Traded Funds.
Comments in Tech Talk reports are the opinion of Mr. Vialoux. They are based on technical, fundamental and/or seasonal data that is believed to be accurate. The comments are free. Mr. Vialoux receives no remuneration from any source for these services. Comments should not be considered as advice to buy or to sell a security. Investors, who respond to comments in Tech Talk, are financially responsible for their own transactions.
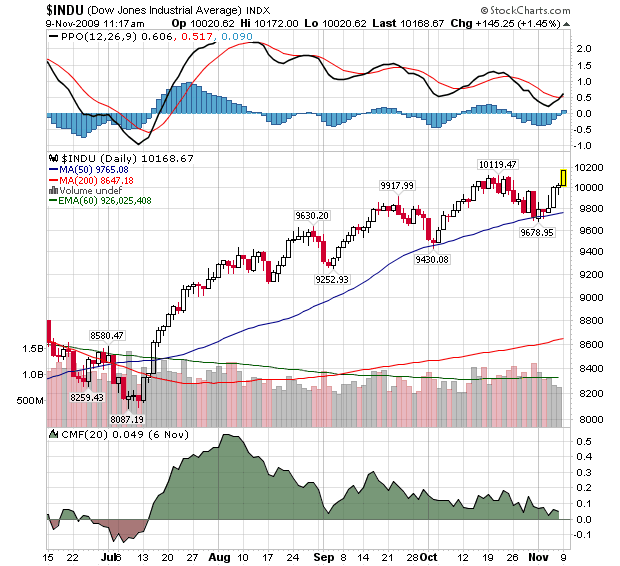
U.S. Stock Market – As noted in my interview with George on Friday, the fact that the market didn’t sell off after the unemployment report was very bullish and my belief was the path of least resistance is up. While some technical charts were/are bearish, some sentiment indicators (commentary below) are very bullish.Individual investor polls of late showed widespread bearishness. I continue to believe the mini melt-up I’ve spoken about from a 1,000 DJIA points lower continues to unfold. I wait with bated breadth for DJIA 10,500 – 11,000.
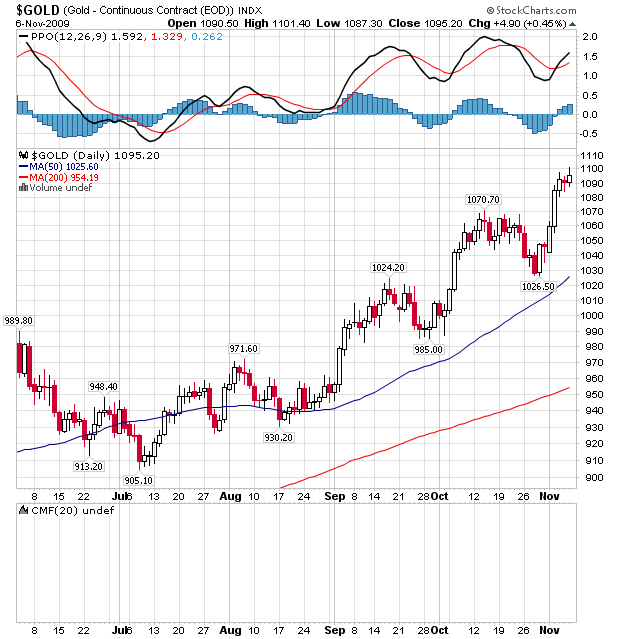
Gold – What can I say that I haven’t said already? The J__ N_____ of the world continue to be wrong, wrong, wrong and are the best contrarian indicators money can’t buy. Sure, somewhere out there is consolidation and a correction but as I’ve constantly stated since just above $300, staying long and strong is the best course of action when it comes to gold. Despite one new record nominal high in gold after another, the mood around gold is subdue and the badly beaten up bears continue to be the main voices heard crying wolf to the media. Thankfully, we’ve saw through their empty and wrong views and have sang the following to every line in the sand top they’ve predicted at round number from $400 up to now.
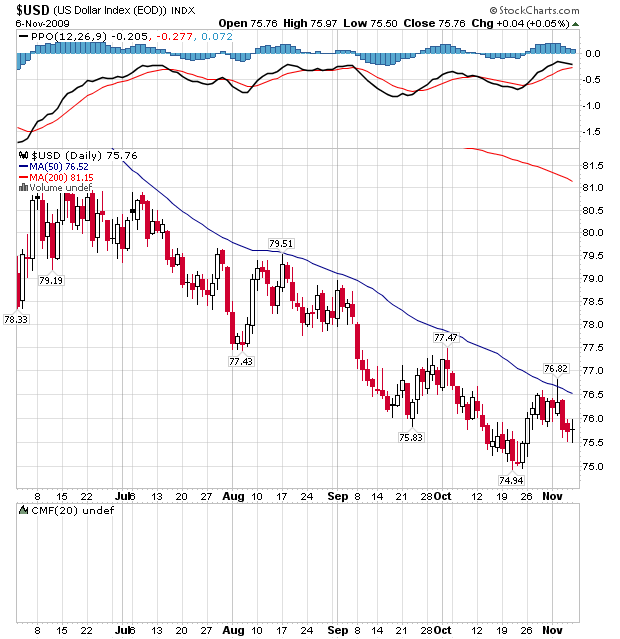
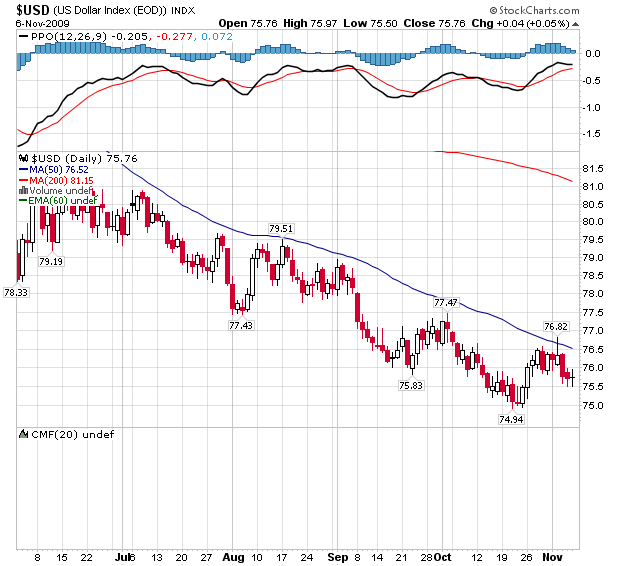
U.S. Dollar – Despite historically low bullish sentiment indicators, terminally ill Uncle Sam can’t even muster up a technical bear market rally. Once again it’s getting slaughtered in the Forex markets. The long-term downtrend remains intact and a test of the low 70s appears in sight.
A bucking bronco market
Commentary: Volatility has scared many away from stock market
Perhaps the best analogy I can think of for the stock market’s recent behavior is a bucking rodeo bronco.
Just as a rodeo bronco attempts to buck everyone off of its back, the stock market likes to rise with as few investors as possible on board.
And it’s doing one heck of a job: The stock market is back to within shouting distance of where it stood on Oct. 19, its previous rally high, and yet there are far fewer bulls today than then.
In fact, the level of bullishness right now among short-term stock market timing services has fallen back to levels last seen in March, when the Dow Jones Industrial Average (INDU 10,168, +144.50, +1.44%) was more than two thousand points lower.
This is all good news, according to contrarian analysis, since the market likes to climb a wall of worry.
Consider the latest data from the Hulbert Financial Digest: The average recommended equity exposure among a group of short-term market timing services is just 3.2% right now. The last time the Dow was above 10,000, two weeks ago, this average stood at 25.8%.
So the net effect of the stock market’s bucking-bronco-like behavior over the last couple of weeks has been to throw almost all the remaining bulls off the bandwagon and into the hands of the bears.
That’s amazing enough, but there’s more.
Consider that the last time the average recommended equity exposure among these same market timing services was as low as it is today was March 24, a day when the Dow closed at 7,660. The market is more than 30% higher today than then.
So, in effect, the market has figured out how to gain more than 30% while simultaneously preventing any net new converts to the bullish camp.
I’d have never thought it possible if you had presented me with such a scenario in advance.
A similarly bullish message is being told by the weekly survey of American Association of Individual Investors members. The latest survey, released Thursday, shows the lowest number of bulls since the week ending March 5, four days before the March 9 bear market low.
Some day, we don’t know when, bullish sentiment will rise to dangerously high levels. And that’s when contrarians will want to be pulling money off the table.
Until then, the sentiment winds continue to blow in the direction of higher prices.
Mark Hulbert is the founder of Hulbert Financial Digest in Annandale, Va. He has been tracking the advice of more than 160 financial newsletters since 1980.
This brief initial comment from the Legendary Trader Dennis Gartman. For subscription information for the 5 page plus Daily Gartman Letter L.C. contact – Tel: 757 238 9346 Fax: 757 238 9546 or E-mail:dennis@thegartmanletter.com HERE to subscribe at his website.
THE WEEK BEGINS AS LAST WEEK ENDED, WITH THE DOLLAR TRADING LOWER ONCE MORE and for lack of something more fundamental to “pin” that dollar weakness upon we shall “pin” it upon the passing, Saturday night, of the House’ health care legislation that we find wholly disconcerting at a minimum and manifesting depressing and anti- capitalist at its worst. We discuss this legislation below to some degree, but given that the legislation is more than two thousand pages long, writing a page or two or three about it does not do the bill’s left-of-centre damage to the US economy even modest justice. As we write, the dollar is weak and heading toward new lows relative to the EUR, and gold is rising, moving upward through $1100 at the same time as money is leaving the dollar and looking to find a home in anything else that it may deem even reasonable secure. How sad is this and how terribly depressing is it to watch as this once great country that attracted capital from around the world has now become the country from which capital flees at a moment’s notice… or at a bill’s passing?

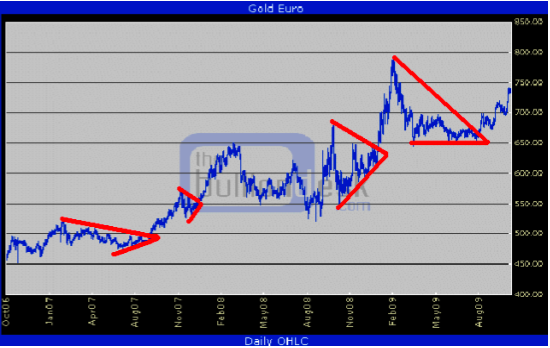
GOLD IN EUR TERMS: Good bull markets in gold take place in all currency terms, and in terms of the EUR it is clear that gold’s trend is higher… rather relentlessly so.
Dennis Gartman spoke about his timeless trading strategy at the Super Summitt go HERE for the Speaker Lineup and REGISTER HERE, Much more from some of the worlds best traders including:

Mr. Gartman has been in the markets since August of 1974, upon finishing his graduate work from the North Carolina State University. He was an economist for Cotton, Inc. in the early 1970’s analyzing cotton supply/demand in the US textile industry. From there he went to NCNB in Charlotte, N. Carolina where he traded foreign exchange and money market instruments. In 1977, Mr. Gartman became the Chief Financial Futures Analyst for A.G. Becker & Company in Chicago, Illinois. Mr. Gartman was an independent member of the Chicago Board of Trade until 1985, trading in treasury bond, treasury note and GNMA futures contracts. In 1985, Mr. Gartman moved to Virginia to run the futures brokerage operation for the Virginia National Bank, and in 1987 Mr. Gartman began producing The Gartman Letter on a full time basis and continues to do so to this day.
Mr. Gartman has lectured on capital market creation to central banks and finance ministries around the world, and has taught classes for the Federal Reserve Bank’s School for Bank Examiners on derivatives since the early 1990’s. Mr. Gartman makes speeches on global economic and political concerns around the world.
Ed Note: Tyler Bollhorn gave superb insights into how to trade in the Money Talks in the Money Talks Super Summit last weekend available by video HERE.:
Listening to Stockscores Users
Stockscores.com Perspectives for the week beginning Nov 9nd, 2009
![]()
Do you want to trade the stock market professionally? I must tell you, although it is not an easy thing to do, it is definitely something worth pursuing. The financial potential is what attracts most people to trading but for me it is the freedom that it offers. Trading is a perfect profession for someone with a young family that requires time or that person who likes to travel. Your boss, the market, never gets upset if you need to take a little time off.
However, we should go back to the second sentence from the paragraph above. Trading is not easy and I will never give anyone the impression that it is. I have a lot of people who want me to teach them to trade and I always try to be pretty straight with them so they don’t have unreasonable expectations. While it is possible to make a living trading after just a month of study, it is highly unlikely. For most, it takes time to learn how to trade and how to get control over their emotions.
- Get the StockSchool Pro Free

- DisnatDirect named the number one Canadian brokerage for Traders by Surviscor! Open and Fund a brokerage account with DisnatDirect and receive the StockSchool Pro home study course free, including special Pro level access through the DisnatDirect client website. Offer only available to Canadian residents. For information, click here
The greatest hurdle for aspiring traders is their own limiting beliefs. Anyone can learn what support and resistance are or how one chart pattern might be better than another. But, it is reprogramming their mind that takes the most time. From a young age, we are taught to think in ways that are destructive to trading.
We are taught to pursue percentage or dollar gain. We are taught that we need to be right more than we are wrong. We are taught that taking losses is bad and should be avoided. We are taught that we can only make money by buying good companies.
All of these things are not valid to an experienced trader. I only judge success by the amount of reward I get for the risk I had to take to get it. I know that you can be wrong more than you are right and still do very well in the market. I have learned, the hard way, that you have to take the loss when the market tells you that you are wrong. I have become cynical about what makes a company good; I now prefer to typify a good company as one whose stock goes up after I buy it.
To trade well, you need a strategy that gives you an edge. You need mathematical proof that your set of trading rules will consistently make money over a large number of trades. The first thing that every trader should do is test their rules to establish this proof.
Strategy testing is one of the things that I enjoy doing most. I actually find trading kind of boring (although I do like what it provides) and so I tend to spend probably too much time testing and developing strategies.
This past week, a coupe of our readers sent me emails discussing their success with one of the strategies that I teach in the StockSchool Pro course. This day trading strategy, called Superheroes, has rules that I have tested and found to have an edge. However, it is one thing for me to tell everyone that my strategy has an edge, it is another to have students that have taken my course find the same results. That is what I like about the two emails that I received this past week.
“I have learned to see the trades not in dollar and cents terms but in risk units.(ie 2 risk units won for 1 risk unit loss)
Here are some stats that I have compiled.
July 2009 62 trades 42 wins 20 loss 97 units wins 20 units loss net 77 units 0 days no trades
Aug 2009 52 trades 40 wins 18 loss 117 units wins 18 units loss net 99 units 1 days no trades
Sep 2009 48 trades 35 wins 16 loss 73 units wins 16 units loss net 57 units 2 days no trades
Oct 2009 36 trades 26 wins 10 loss 36 units wins 10 units loss net 26 units 5 days no trades
I shared these stats in a recent daily newsletter and it brought a response from another reader,
“Since we’re in the sharing mood, here are my stats in a similar format to your reader for the last 6 months for the superhero strategy specifically:
Trades Wins Losses Units Won Units Loss Net Units Days no trade
May-09 24 15 9 42.00 -8.23 33.77 9
Jun-09 14 12 2 18.93 -1.33 17.60 11
Jul-09 31 23 8 57.85 -9.14 48.71 7
Aug-09 50 35 15 85.35 -15.43 69.92 3
Sep-09 56 36 20 80.13 -21.39 58.74 3
Oct-09 39 25 14 52.47 -13.54 38.92 7
Both of these examples show a success rate of just fewer than 70% which is what I have also found. But what stands out is the number of profit units versus the number of loss units and how this strategy consistently provides a positive expected value. That is what you need to make money as a trader.
![]()
I receive a lot of stock “tips” from our users and even the companies themselves, each telling me about the great potential in the stock they are interested in. The stories always sound great but, since I never make a trade based on the story, I don’t usually do too much on them.
I do like to check the charts of these stocks; in about 3 seconds I can tell if there is something worth considering. This week, I thought I would review the thought process I go through when I receive a stock tip. Since I know many of you are also getting tips, hopefully this process will help you with your evaluation.
This past week, two of our users sent me stocks trading on the TSX Venture. This is the market I grew up trading (then it was the Vancouver and Alberta stock exchanges). I like these stock for their ability to make considerable percentage moves but I tend to not trade them much any more because of their lack of liquidity. It is harder to move in and out of big positions in stocks that trade less actively.
However, for many traders, these stocks are a good way to get started, provided you understand the risks that come with less actively traded stocks. You have to play them when they are in play and get out before the dust settles. They will often move very quickly, but can die off just as fast.
The first stock I was “informed” of what V.MMC. This company caught my interest because they make a product that I actually use; something called Poynt which is a search engine for mobile phones. With it, you can find movies and businesses in your area, it uses your GPS location to identify the relevant businesses near to you. I installed it on my Blackberry some time ago and I use it quite often.
The second stock is another good sounding story. V.APH is benefitting from the H1N1 pandemic because they make cleaners and disinfectants which kill viruses and bacteria. They are actually the “Official Hand Sanitizer for the 2010 Olympic Games” which I thought was kind of funny.
Those of you who know me will know that I don’t care about the story. I only give you this information because that is the kind of information people send to me. I only read the information that I got because I wanted to write this column for the newsletter. Usually, I just skim through to get the symbol so I can check the chart.
So, with that preamble, let’s consider those charts:
![]()
1. V.MMC
V.MMC is not trading with great liquidity but it has made a noticeable increase in trading volume over the past two months. That tells me that something is happening with the stock to get people’s attention. I don’t really care what that something is, but it is a good sign.
The chart shows rising bottoms indicating investors are optimistic in the stock and the buyers are in control. Over the past few weeks price has been trading sideways indicating the stock is stable and has a good base. The sellers have not found much motivation to act yet.
What I would like to see is for this stock to break out of this trading range with a jump in volume. That would be a good entry signal for those comfortable with these kinds of stocks. Right now, support is at $0.16.
2. XLK
Play weakness in the overall technology sector with a short on the XLK ETF which is breaking down from a rising wedge pattern. Resistance at $21.25
2. V.APH
I sent an email back to the person who told me about V.APH advising that the stock looked good but it appeared to be a bit too late to enter. The stock is strong and I think it has priced a good deal of the story in already. The main problem right now is that it has run away from its upward trend line. I would like to see it pull back to that upward trend line, perhaps around the $0.55 price mark, before I would consider it for entry.
The good entry point was October 14th when it broke through resistance and out of an ascending triangle pattern with volume support. I missed that but I think there is a good chance we will get a second opportunity on a pull back.
Click HERE for the Speaker Lineup and to REGISTER if you want to learn from some of the worlds best traders including Tyler Bollhorn.
Tyler Bollhorn started trading the stock market with $3,000 in capital, some borrowed from his credit card, when he was just 19 years old. As he worked through the Business program at the University of Calgary, he constantly followed the market and traded stocks. Upon graduation, he could not shake his addiction to the market, and so he continued to trade and study the market by day, while working as a DJ at night. From his 600 square foot basement suite that he shared with his brother, Mr. Bollhorn pursued his dream of making his living buying and selling stocks.
Slowly, he began to learn how the market works, and more importantly, how to consistently make money from it. He realized that the stock market is not fair, and that a small group of people make most of the money while the general public suffers. Eventually, he found some of the key ingredients to success, and turned $30,000 in to half a million dollars in only 3 months. His career as a stock trader had finally flourished.
Much of Mr Bollhorn’s work was pioneering, so he had to create his own tools to identify opportunities. With a vision of making the research process simpler and more effective, he created the Stockscores Approach to trading, and partnered with Stockgroup in the creation of the Stockscores.com web site. He found that he enjoyed teaching others how the market works almost as much as trading it, and he has since taught hundreds of traders how to apply the Stockscores Approach to the market.
References
Get the Stockscore on any of over 20,000 North American stocks.
Background on the theories used by Stockscores.
Strategies that can help you find new opportunities.
Scan the market using extensive filter criteria.
Build a portfolio of stocks and view a slide show of their charts.
See which sectors are leading the market, and their components.
Disclaimer
This is not an investment advisory, and should not be used to make investment decisions. Information in Stockscores Perspectives is often opinionated and should be considered for information purposes only. No stock exchange anywhere has approved or disapproved of the information contained herein. There is no express or implied solicitation to buy or sell securities. The writers and editors of Perspectives may have positions in the stocks discussed above and may trade in the stocks mentioned. Don’t consider buying or selling any stock without conducting your own due diligence.
On October 07 The Gold Report conducted an interview with me just after gold broke out to new news above $1030. During that interview I made the case for $1300 gold by spring next year and advocated to be invested in high quality juniors which are poised for a multi year bull run that could even surprise the staunchest junior investors. This piece is an update on that interview and shines a light on how to approach investing in junior gold mining shares.
Gold poised for correction? Not now!
On October 07 with gold prices just above $1030 The Gold Report asked me if I had one more final thought for the reader. I said:
Excerpt TGR Interview October 07, 2009
TGR: Any final thoughts you’d like to give our readers?
EH: Yes, most likely you’ll be hearing bearish gold tunes in coming months from the traditional gold institutions, saying that gold’s rise is not justified by its fundamentals and therefore bound to fall. They did so in 2003, they did so in 2005 and now they are at it again. The traditional gold institutions simply don’t appreciate the fact that gold is money and how it has been manipulated over the years. Traditional gold institutions in 2005, with gold prices at $425, were saying that increased gold production would bring down gold prices; that certainly didn’t boost their credibility. Still many analysts quote these very same institutions today for the very same argument— that increased gold production will bring down gold prices in the years ahead. GATA, on the other hand, said in 2001 that gold was going to $850 and that central bank selling wouldn’t be an issue anymore within seven to ten years from then. We find ourselves right in the middle of that projection and gold is trading well above $850 and central bank sales have dried up completely. You are not going to hear these kind of predictions from the traditional gold institutions. No one has been right on the money more than GATA. It’s therefore no wonder that GATA’s credibility is rising fast. To give you an example here, the Chinese sovereign wealth fund ,which manages over $200 billion, has held already three teleconference calls with GATA—they wanted to know what GATA knows. We all know now that China has been accumulating gold for years; we all know now that China wants a new world reserve currency. This, of course, won’t happen overnight, but it’s quite obvious that the U.S. dollar as a world reserve currency is not going to survive. Gold will continue to rise until something new has been put in place on the monetary front and I think we are years away from that. So what I’d say is. “Stick to it and stay the course. “
END.
Well, we are just one month further now and $50 closer to our $1300 target by spring next year, this despite the many calls for $680 gold that have been aired since then through the traditional bear channels.
Now does it come as a surprise to see gold holding up so well after breaching the $1000 mark and marching into higher grounds?
No, of course not, when The Gold Report asked me about a potential pull back I said:
TGR: Given the recent run-ups, would you expect a pullback before the price rises again?
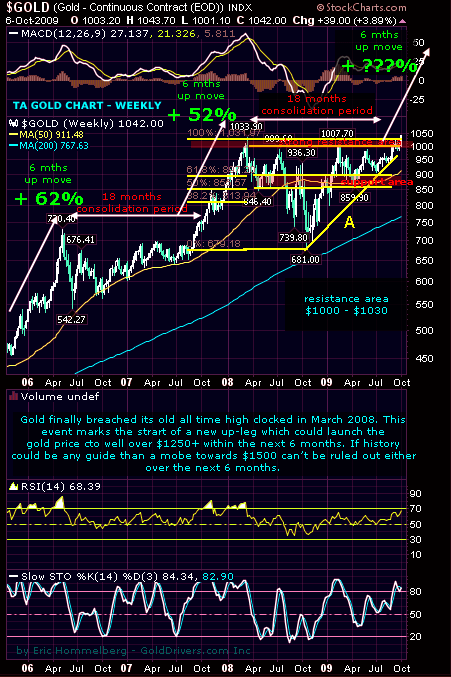
EH: I don’t expect a sharp pullback; nothing like the correction last year. That’s not going to happen. Since gold breached the $1,000 mark for the first time in March 2008, the $1,000 area had been a resistance area. It took about five attempts to slash the $1,000 mark. A long-time resistance area becomes a support level once that level has been breached to the upside. That’s exactly what happened a few weeks ago, when we saw our first weekly close above the $1,000 mark in history. Furthermore, we had our highest monthly close ever as well and this marks the beginning of a new up leg. The charts leave no doubt; they point to gold prices of $1250+ within the next six months. When you analyze the long-term charts you’ll notice a pattern of long consolidation phases followed by sharp up moves. The consolidation phases last for about 18 months, the sharp up moves last for about six months, whereby gold can appreciate by 50% or more. We saw it in 2005 when gold just finished an 18-month consolidation period and then it shot up within six months from $430 to $730. That move started with a commercial signal failure, today with record high commercial shorts outstanding we could be on the verge of a commercial signal failure again
END.
Here we are, gold shooting up by $40 in the face of all nay sayers just like it did in 2005. The odds of a massive commercial signal failure are increasing by the day. Certainly the Indian bombshell of buying 200 tons of IMF gold wasn’t exactly the kind of news the commercial short traders were waiting for. And yes, the FED not willing to defend the dollar won’t be giving much comfort either, and yes, the fact that more and more investors are demanding the real metal instead of paper gold substitutes like GLD (see also my entire interview with The Gold Report) is making things worse for the commercial short traders. So yes, we are on our way to $1300 gold which is consistent with previous patterns of consolidation phases followed by sharp up moves. The chart below which we’ve send out to our members on Oct 07 visualizes this pattern:
TA GOLD CHART – WEEKLY (Oct 07)
Now fast forward to today with gold clocking $1080. Is it overbought now? Time for a correction? Don’t think so!
….read more HERE to read more including Junior Mining Companies Poised for Historic Bull Run
Eric Hommelberg is the founder and chief editor of GoldDrivers.com Inc, a Caribbean based gold company. Hommelberg served as a writer on gold markets since 2002 with a strong focus on junior mining gold companies. In June 2009 Hommelberg conducted an exclusive deal with Valcambi Suisse and launched the GoldDrivers Bullion Store. The GoldDrivers Bullion Store thereby became the first on-line retail seller that deals with Valcambi Suisse directly. The Bullion Store offers 999.9 Fine Gold Bars from 1 to 100g to investors/collectors world wide
-
I know Mike is a very solid investor and respect his opinions very much. So if he says pay attention to this or that - I will.
~ Dale G.
-
I've started managing my own investments so view Michael's site as a one-stop shop from which to get information and perspectives.
~ Dave E.
-
Michael offers easy reading, honest, common sense information that anyone can use in a practical manner.
~ der_al.
-
A sane voice in a scrambled investment world.
~ Ed R.
Inside Edge Pro Contributors

Greg Weldon

Josef Schachter

Tyler Bollhorn

Ryan Irvine

Paul Beattie

Martin Straith

Patrick Ceresna

Mark Leibovit

James Thorne

Victor Adair