
Daily Updates
Richard Russell has made his subscribers fortunes. One of the best values anywhere in the financial world at only a $300 subscription to get his DAILY report for a year. HERE to subscribe. Amongst his achievements Richard was in cash before the 2008/2009 Crash and he has been Bullish Gold since below $300
Ed Note: Richard Russell is bullish Silver and holds one of the largest single positions he has held since the 1950’s in the precious metals.
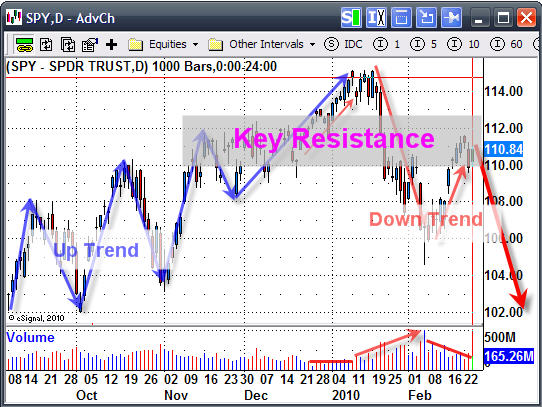
The following study points to a phenomenon that nobody seems to have noticed. I’ve posted below the Dow yearly low closes during the last ten years.
2000 — 9796.03
2001 — 8235.81
2002 — 7286.27
2003 — 7424.06
2004 — 9749.99
2005 — 10012.36
2006 — 10667.39
2007 — 12050.41
2008 — 7550.29
2009 — 6747.05
Note that at the 2009 (March 9) low the Dow had violated all previous lows going back to the year 2000 — this was a violation of nine previous yearly lows. Did anyone realize the bearishness of the 2009 violation? If ever there was a bearish signal that was it. The 2009 break might have been followed by a stock market crash. But at the March 9 low, the stock market was severely oversold. On top of that, the Fed had opened the liquidity spigots and Fed funds were lowered to zero. That combination was enough to halt the bear market decline and send the stock market into a bear market upward correction.
My belief is that the 2009-2010 upward correction is now in the slow and tedious process of breaking up. For that reason, I have suggested my subscribers to be out of stocks and on the sidelines. Because the primary bear market has been halted or bottled up since March 2009, I suspect that the coming bear leg will be particularly vicious. It will be brutal because the Fed has already “shot its load,” and further activity from the Bernanke Fed will be limited and fiercely opposed by many.
The 85 yr. old writes a market comment daily since the internet age began. In recent years, he began strongly advocated buying gold coins in the late 1990’s below $300. His position before the recent crash was cash and gold. There is little in markets he has not seen. Mr. Russell gained wide recognition via a series of over 30 Dow Theory and technical articles that he wrote for Barron’s during the late-’50s through the ’90s. Russell was the first (in 1960) to recommend gold stocks. He called the top of the 1949-’66 bull market. And almost to the day he called the bottom of the great 1972-’74 bear market, and the beginning of the great bull market which started in December 1974.
Gold, Silver & Stock Indices on the Verge of Rolling Over?
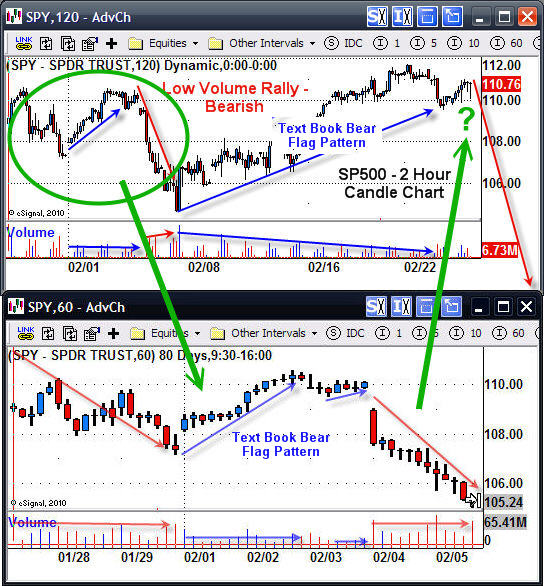
This week has been playing out as we expected. Last week we saw the market rally on light volume into a resistance zone on the daily chart. Light volume rallies are always a warning sign, much like the “Calm before a Storm”.
The way I look at bearish price action:
The First Heavy Selling Volume Day – I see this as large institution selling massive amounts of investments (stocks & commodities) because prices have risen enough for them to book profits OR they know something we don’t and they are getting out before the majority of traders find out.
Light Volume Rally/Drift Higher – After a heavy volume sell off we tend to see prices drift higher on light volume. This is when the institutions stop dumping investments and allow the retail investors (Un-educated Traders) to buy the market back up.
Bear Market Trend – In a down trend we see these two phases enter and exit the market. These patterns happen on every time frame from tick charts to yearly charts. Trends vary in length from 1-2 cycles and sometimes 10-20 cycles and more…
Current Market Conditions
So far this week we have seen the market sell down on increasing volume which is bearish and is pointing to lower prices. On Wednesday we saw prices move up on light volume with volatility rising into the close with a short wave of selling. This was indicating to me that sellers were starting to enter the market again.
The daily chart below clearly shows the heavy selling and drift higher on declining volume. The market is now trading deep into a resistance zone and looking ready to drop.
SP500 Intraday 2 Hour Candle Charts
You can see the same selling patterns repeat themselves. Since the Feb 5th bottom we have been forming a much larger bear flag which makes me think a BIG drop is only days away.
SP500 Trend Trading Conclusion:
Both stocks and precious metals are trading with the same chart patterns and volume levels. So if you are wondering about gold, silver and oil, I am seeing a similar scenario playing out for them also.The reason I keep bringing these bearish patterns up in my reports is because once you master trading in a down market then you can make money during some of the fasted moving times in the market. I have always preferred shorting the market because prices drop much quicker then they rise. So profits are made quickly.
Also, if the broad market does eventually roll over later this year, and I am not saying it is, but “IF” it does, then you will feel somewhat comfortable with the positions we will be taking.
If you would like to receive these Free Bi-Weekly Trading Reports please visit my service for TheGoldAndOilGuy at: www.TheTechnicalTraders.com
Chris Vermeulen
Go Ahead… Take the Next 30 Days to Decide if TheGoldAndOilGuy
Newsletter Works for You
Zero-Risk, 100% Money-Back Membership Guarantee
Your membership is guaranteed with a 30 day full refund for first-time subscribers. If for any reason at all, you’re not 100% satisfied with your membership, simply notify me, and I’ll personally, courteously refund 100% of your subscription price.
No questions asked, no hard feelings and we’ll still part as friends. It’s as simple as that.
Sign up HERE
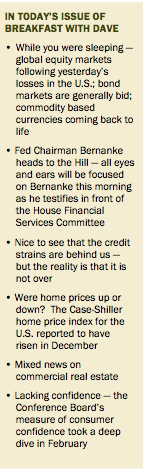
BEN GOES TO THE HILL
All eyes and ears will be on Ben Bernanke today as he testifies in front of the House Financial Services Committee at 10 a.m. Topics beyond the economic outlook, which remains murky, will be the Fed’s planned exit strategy in detail and what last week’s hike in the discount rate symbolized. The Fed has implemented no fewer than 10 different facilities as part of its rampant balance sheet expansion since the TALF was unveiled in late 2007. Dismantling this infrastructure will undoubtedly be complicated and take time to evolve.
What was interesting, and a possible sign that the Fed will be slow to withdraw from its QE program, was the announcement by the Treasury that it will revive the Supplemental Finance Program that was initiated during the peak of the financial crisis. The program was used as a means to get the Fed cash/liquidity quickly to fund the programs it used during the liquidity crisis. As the Fed (as of now) does not issue bonds, the program worked as follows — Treasury issues short term debt and moves the cash onto the Fed’s balance sheet as reserves. The short term debt is issued to the primary dealer community and the cash is placed on reserve at the Fed in the Treasury’s account. The cash can be used now to fund continued purchases of MBS from the GSEs (as there is still $200 billion left to be purchased) and this is done without printing more money (raises the debt level of the Treasury, but does not increase the circulation of the fiat currency).
In addition, as the primary dealers are taking Treasury debt for cash there is less cash in the system. In effect, this can permit the Fed to raise capital to buy GSEs, RMBS, and drain some cash from the primary dealers — this may involve tightening of conditions in the primary dealer area, but allows the Fed to continue to support the housing market by maintaining its MBS purchase program. In any event, Bernanke has a tough task ahead of him, which is to explain in simple terms just how monetary policy is going to be shifting in the near future but without any move in the Fed funds rate.
….read more commentary HERE
….read more commentary HERE
Don Luskin says now is not the time to invest overseas: Thinking of Investing Abroad? Think Again:
“All I’m saying is that you’re making a huge mistake if you mindlessly send all your money overseas — just because all those other economies are the devil you don’t know. The devil you do know may be your best bet.”
Luskin’s track record and forecasting history suggest he is a reliable one man contrary indicator.
Contrary-interpretation of Smart Money article: One of the greatest overseas investing trades — in the history of mankind — is very likely about to begin.
You read it here first . . .
Welcome to The Big Picture!
This site is written by and for investment professionals, as well as anyone else interested in investing, markets, and the economy. We key in on what you should — and more importantly, what you should not — do with your money. I have been writing about these topics for ~15 years, and blogging since 2003.
By sheer accident, it has become one of the best reviewed finance blogs on the web.
This is NOT a business cycle: this is a one-time reversal of twenty years of inflation of the household balance sheet. An aging populationneeds a 10% savings rate (at least) to meet minimum funding requirements for the biggest retirement wave in US history (comparable to Japan’s retirement wave during the “lost decade” of the 1990s). With 17% effective unemployment, many Americans are dis-saving, after a $6 trillion shock to home equity.
10) There is no recovery at all in Europe. European growth ground to a halt during the fourth quarter and German busines confidence unexpectedly fell in February.
9) China won’t collapse, but government efforts to stop overheating by raising reserve requirements make clear that the world’s second-largest economy can’t be the locomotive for world growth.
….read 8-1 HERE
-
I know Mike is a very solid investor and respect his opinions very much. So if he says pay attention to this or that - I will.
~ Dale G.
-
I've started managing my own investments so view Michael's site as a one-stop shop from which to get information and perspectives.
~ Dave E.
-
Michael offers easy reading, honest, common sense information that anyone can use in a practical manner.
~ der_al.
-
A sane voice in a scrambled investment world.
~ Ed R.
Inside Edge Pro Contributors

Greg Weldon

Josef Schachter

Tyler Bollhorn

Ryan Irvine

Paul Beattie

Martin Straith

Patrick Ceresna

Mark Leibovit

James Thorne

Victor Adair