
Daily Updates
Ed Note:An Excerpt from Bert Dohmen’s Wellington Letter
“Since mid-October, the stock market rally has been on thin ice. But it has gone longer than technical analysis implied. In October there was an important change in the character of the up move: suddenly the short-term pullbacks were marked by rising volume, and the rises had declining volume instead of vice-versa.
That means “distribution.” In other words, stocks were going from the smart money to the unsophisticated money, such as mutual fund manager. Eventually, that leads to a meaningful downward adjustment.
The general perception is that the stock market has been soaring over the past four months. Well, the S&P 500 rose only 5.4% in that time.
Mutual fund cash is now near the lowest level in about 50 years. As you know, mutual fund managers are very poor market timers. In fact, they will tell you “no one can time the markets.” They rely on lagging metrics which can never catch important turns. For example, at important stock market tops, everything looks most bullish, earnings are soaring, and all these money managers are fully invested just at the wrong time.”
“Experienced technical analysts, and there are not that many, would see the important technical warning signals and be able to see the declining buying power. That allows them to get ready for an important trend change. Technical signals are often early because they are sensitive. Volume leads, prices react slower.”
What To Do
“We would eliminate any exposure to the long side. The market will face some strong headwinds in the near future.”
Bert Dohmen
Bert Dohmen’s Wellington Letter
Dohmen Capital Research Institute, Inc.
P.O. Box 49-2433, Los Angeles, California
310-476-6933
www.dohmencapital.com
Is Something Big In The Market Coming?
“A good friend, and long-time reader, was kind enough to pass along these thoughts yesterday. Basically, the stars are starting to align for something really big to happen…..
….read more HERE
Global Macro Update
Big sell-off yesterday in Treasuries had a lot of people puzzled about whether this is the start of more or just a one off….
…..read more HERE
Chart via Money Talks
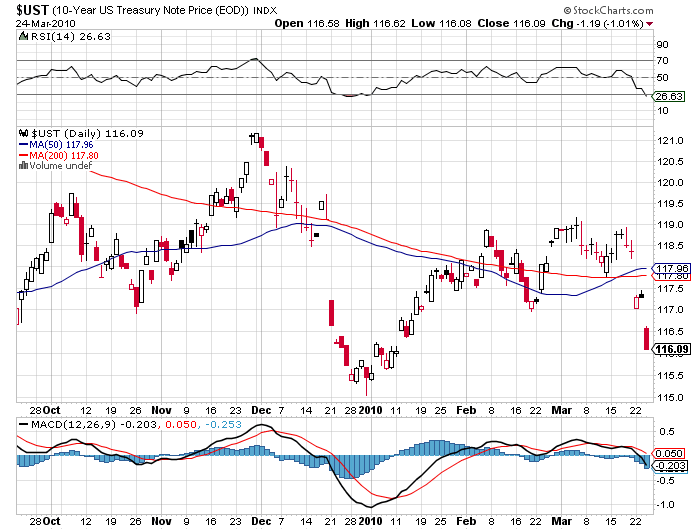
Guess what? The bond market is now very close to saying, “We’ve had enough.” The problem can be illustrated by one chart. Below I include the key chart, courtesy of the Chart Store. Here we see the yield on the “long” 30-year Treasury bond. The long end of the bond market is not controlled or manipulated by the Fed, it’s a free market.
What we see on the chart is a huge well-defined head-and-shoulders bottom formation. The formation is very close to breaking out, and if it does this it means automatic higher interest rates. What would an upside breakout of this formation mean? I believe it would mark the end of the 25 year bull market in bonds. That bull market (a trend of lower interest rates) has been a major force for the great bull market in stocks and the economy that began in the early 1980s. The current yield on the 30-year Treasury bond is 4.62%. Technically, this chart implies that the yield on the long bond could rise to near 7%.
Richard Russell has made his subscribers fortunes. One of the best values anywhere in the financial world at only a $300 subscription to get his DAILY report for a year. HERE to subscribe. Amongst his achievements Richard was in cash before the 2008/2009 Crash and he has been Bullish Gold since below $300
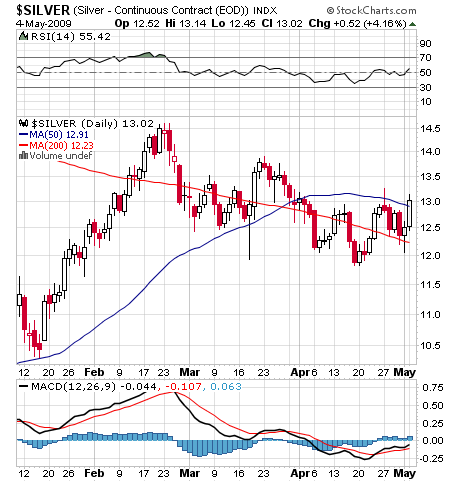
Ed Note: Richard Russell is bullish Silver and holds one of the largest single positions he has held since the 1950’s in the precious metals.
Sure Looks Like A Top? VIX, NYSE, DOW & GOLD
I think many of you will find this article interesting as I show several different indicators which point to an imminent correction for stocks and precious metals.
Last Wednesday’s report I showed how the current price of the index was almost identical to the January peak from where prices dropped nearly 10%. The report was called “28 Day Sector Rotation, Commodity & Index”. We did get the first sign of toppy market last Friday with the sharp one day sell off as I expected.
Today, one week later we are now that much closer to a 3-8% drop which is shown in the charts below. It’s important to remember that bottoms tend to happen quickly while a market topping is more of a process which is why so many people take big losses trying tip a top.
The market will continue to move up even when it is way overbought. It’s only when extreme levels are reached that tops can try to be played.
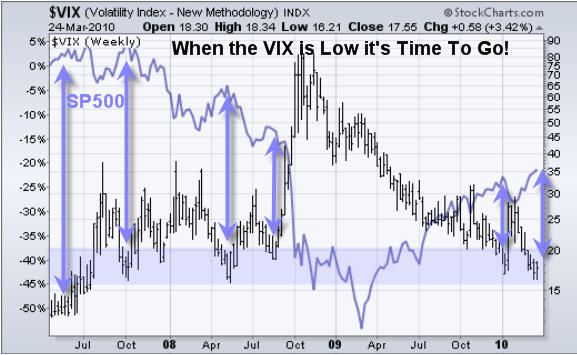
The Volatility Index – Measures Fear & Complacency in the Market
While the VIX is not something I follow on a daily basis it is important to keep an eye on it. When extreme low levels are reached we know the market (John Dow traders) are feeling confident and buying up everything they can get their hands on.
I like to trade with the trend but when extreme levels are reached I start looking for a low risk setup to the short side (profit in a falling market) using leveraged ETFs.
As you can see from the chart of the VIX and SP500 below, each time the VIX tested the support level the market made a top. Again the VIX is not a great timing tool but it helps me decide which trading strategy I should focus on (swing or day trading) and if I should be looking to buy or selling the market.
.
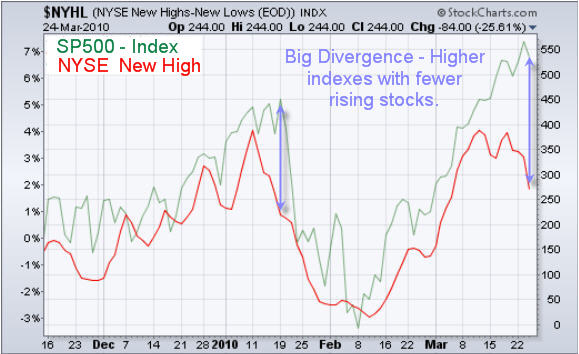
NYSE New Highs-Lows Index
If a chart is worth a thousand words then this chart is worth 2000. It cannot get any simpler that the NYSE new high-low index.
The green line is the SP500 index which is straight forward. The Red line is the number of stocks on the NYSE which have reached a new high.
How strong is the market if is keeps going up while the underlying stocks are getting weaker? Something has got to give and it will most likely be to the down side.
.
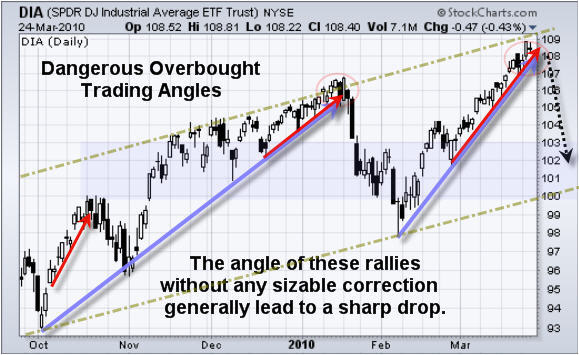
Dow Jones Industrial Average – Daily Trend Chart
This chart adds another layer of clarity. You can see what happened last January when everyone was buying stocks thinking life is good, trading is easy. As my trading buddy David Banister from ActiveTradingPartners.com always says “Buy when the Cry, Sell when they Yell”and that’s what I am looking to do.
Today the Russell 2000 index (small cap stocks) sold down very hard. These stocks tend to lead the market both up and down. So the red flag is up and I am just waiting for the market to show me its hand so we can catch the next big move.
Coles Notes on Chart:
• Market is over bought and in dire need of a pullback
• The length of this steady rally is much longer than a normal rally
• The rate as which prices are rising is much to steep to be maintained
• The market is trading at the parallel trend line
• VIX is tell us people are buying and not worrying about any possible drop
• NYSE divergence is screaming Overbought…
.
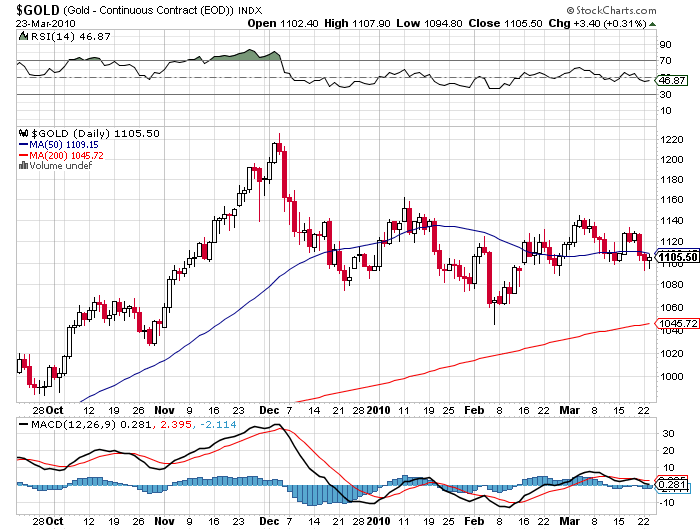
GLD Gold Fund Trading
Gold is still in a major bull market but the recent price action from Dec up until now has been down as gold consolidates the large rally from 2009.
Looking at the chart below you can see the mini Head & Shoulders pattern. The neckline has now been broken and prices are falling. I almost had a buy signal for gold two days ago with the small move up and the candle closing above the previous days high. But because the price was still under the neckline (resistance) I decided to stand aside and live another day.

Mid-Week Gold Newsletter Conclusion:
In short, the market looks very strong but from a technical point of view it’s about to die of exhaustion in my opinion.
Gold, silver and oil I figure will move together which is sideways or down.
I am keeping a very close eye on things hoping prices unfold in a manor which will allow us to spot a low risk setup in the coming days as I would like to catch this drop if it happen. With any luck we could make 10-15% within a couple days using a leveraged ETF.
If you would like to get my Real-Time ETF Trading Signals please check out my website: www.TheGoldAndOilGuy.com
Get my FREE Weekly Reports – HERE (down the right side)
U.S. Stock Market – I’ve been saying DJIA 11,000 is a question of when, not if. A pullback today is possible but the technicals suggest we can get even higher before it’s all said and done. This by no means suggests you go out and buy the market but instead prepare for the day the “Fat Boy” (not so fat these days and hopefully even thinner in the weeks and months ahead) from Freehold puts his bear suit back on.
Charts via Money Talks
Gold and Silver – Disappointing to a degree that they were not able to break out as thought. But, after watching the paper hangers on the CrimeNex, nothing surprises me anymore. Bullish sentiment, especially among retail investors, has evaporated and a sense of inevitably lower prices seemingly has gripped these investors. I love it when a plan comes together. This is what has occurred for almost a decade in this secular bull market before we went to much higher levels and I believe it should do so again.
Charts via Money Talks
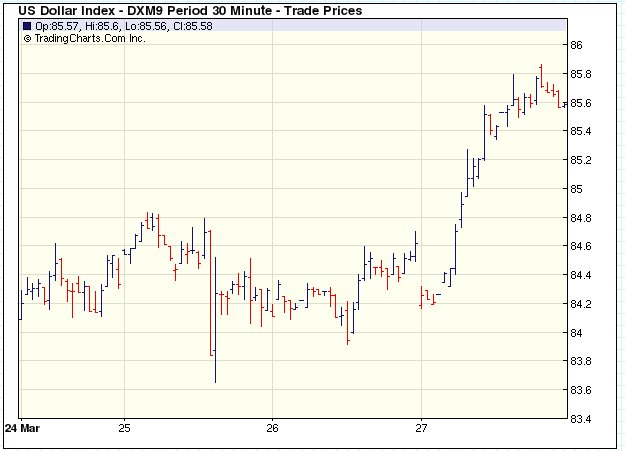
U.S. Dollar – I continue to look for 83-84 on the U.S. Dollar Index and believe we can see it in the 2nd quarter.
Charts via Money Talks
U.S. Bonds – Avoid!

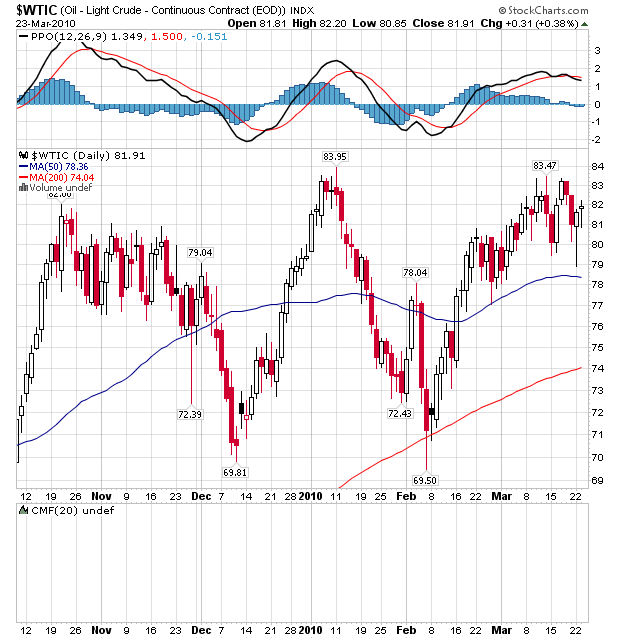
Oil & Gas – No interest either side of things.
On Major Moves, Peter Grandich has been very right and not only saved many investors fortunes, but expanded them dramatically. On November 3, 2007 at the MoneyTalks Survival Conference, Peter Grandich of the Grandich Letter warned that “an unprecedented economic tsunami will hit American beginning in 2008”. Peter advised publicly to short the US market two days from the top in October, 2007 and stayed short until the last week of October, 2008. He began to buy stocks in March 7th, 2009. He also bought oil and oil related investments near the lows after the dive from $147.
….go to visit Peter’s Website
To HERE Peter speak and others speak on Trading go HERE:  .
.
-
I know Mike is a very solid investor and respect his opinions very much. So if he says pay attention to this or that - I will.
~ Dale G.
-
I've started managing my own investments so view Michael's site as a one-stop shop from which to get information and perspectives.
~ Dave E.
-
Michael offers easy reading, honest, common sense information that anyone can use in a practical manner.
~ der_al.
-
A sane voice in a scrambled investment world.
~ Ed R.
Inside Edge Pro Contributors

Greg Weldon

Josef Schachter

Tyler Bollhorn

Ryan Irvine

Paul Beattie

Martin Straith

Patrick Ceresna

Mark Leibovit

James Thorne

Victor Adair