
Daily Updates
Looking back to last year, it would have been inconceivable to be talking about a Canadian economic miracle, but that is exactly what we have on our hands today; a classic V-shaped recovery with a 5% real GDP growth performance in the fourth quarter — a pace that will likely be surpassed in Q1. Unlike the nascent U.S. rebound, the Canadian bungee-jump has occurred with no arithmetic support from inventories and also with a lot less intervention in the form of fiscal stimulus. The National Bureau of Economic Research (NBER) is still unsure of when (or whether) the recession ended south of the border, but Statistics Canada boldly told us a little more than a week ago that the domestic downturn was officially terminated back in the third quarter of last year.
This begs the question as to what has been the principal factor underpinning this impressive Canadian economic revival, especially in relation to what is happening in the United States, where this goes down as the second weakest recovery in real final sales on record. In the U.S., only the 2002 experience — recall the growth relapse in the second half of that year — was softer.
We can answer the question in one word: housing. The housing sector is the quintessential leading indicator of the economy, and true to form, it caught fire before the overall economy did — after a brief, but sharp, turndown in the latter part of 2008 and into those dark opening months of 2009. The U.S. market has stabilized at best, with the help of massive doses of government support, but in Canada, housing activity has absolutely been ripping.
• Canadian housing starts in March were up 38% on a YoY basis and up a resounding 75% from the February 2009 trough.
• Real-estate sensitive retail sales have risen nearly 15% YoY as of February, the fastest pace in seven years.
• Existing home sales are up over 60% from the December 2008 bottom.
• On an annualized basis, real residential construction is up about 20% since the recession ended furniture up 14%, appliances up 9%, and financing/legal services up nearly 5%. The spreading impact across domestic industries linked to the residential real estate market has been considerable.
• Construction employment has jumped 6% (or up 66k) from the July 2009 low. Construction employment only represents a 7% share of the overall employment pie but has been responsible for nearly 40% of the aggregate increase in employment since the recession bottom.
….read pages 2-5 HERE
We oppose the imposition of taxes on banks that the Obama and Brown Administrations so openly support, and we applaud the rather open opposition to these taxes that the government in Ottawa so openly is opposed to. Canada has run its banking situation far better than has any other of the G-7 or G-10 nations, and now these other countries wish to force Canada’s banks to “pay” for the collective lunacy of the rest of the world’s financial idiots. Stand tall, Canada, and oppose this issue – Dennis Gartman of the Gartman Letter 04/23
(Last time we heard from “Cameroni,” his downbeat economic forecast for Canada drew a deluge of responses in the forum, both pro and con. Things have only gotten worse since, he says, and Canada has now edged perilously close to the deflationary abyss that threatens to engulf so many other countries. Below is Cam’s up-to-date assessment of Canada at-the-brink. RA)
Several weeks ago I wrote a letter that was published on Rick’s Pick’s under the headline “Canada Won’t Escape Drag of a Slumping U.S.” Since that time there has been a torrent of media analysis of Canada’s housing bubble from both within this country and from U.S. media. There has been a surprising and candid response by the Chief Economists of TD Canada Trust and the CIBC, two of Canada’s large banks. Who knew that Rick’s site was that influential?

There is clearly a keen interest in the U.S. about the state of the Canadian economy, and until now few have questioned how we Canadians have achieved so much, so fast and turned in such an impressive economic performance, particularly as it occurred during a major global downturn. These additional remarks will hopefully shed some light on those questions and, while written for a Canadian audience, will likely resonate with our Southern neighbors who have already seen this story play out in their own backyard.
….read more HERE
Let me start off by saying the market should be correcting. Sentiment has reached ridiculous bullish extremes, the kind of extremes that led to the January /February correction.
That correction separated the second leg of the bull from the third. But let’s face it, sentiment has been in this condition for several weeks now and the best we could muster was a minor correction of 30 points on the news the SEC was filing charges against Goldman Sachs for fraud.
We’ve had three opportunities to “sell the news” with the April jobs report and recently with INTC and AAPL earnings. None of them have panned out. The market could use the Greek excuse as a downside catalyst, the same as it did in January. And now Greek short term bonds are tanking as the EU waffles about writing that check in front of the German elections in May.
All in all it boils down to the market has had every chance to correct and it has failed to do so.
Last month I speculated that we were On the Brink of an Asset Explosion. Well, we may not be on the brink anymore. We may very well be moving into the heart of the explosion right now.
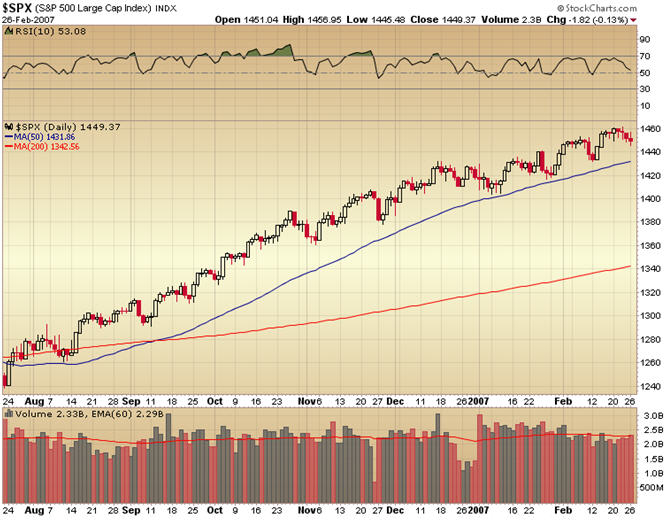
We’ve just seen one of the most powerful rallies out of a corrective low in many years. Until Friday the market had held above the 10 day moving average 42 days in a row. That’s the longest stretch in over 10 years. Since the February 5th low the market has risen 71% of the time. That’s the kind of stuff parabolic blow off tops are made of.
I don’t really think we are in a parabolic blow off top just yet. What I do think is that we may have entered a runaway move similar to the August 06 to February 07 time frame.
……read much more and view 6 more charts HERE
by Toby Connor of GoldScents
A financial website dedicated to analyzing the stock market and the secular gold bull market.
Milton Friedman said, “a central bank can control its exchange rate, it can control its interest rates, and it can control its money supply/inflation. But it can’t control all three at the same time.” Maybe we need to add an addendum: Too much emphasis on price stability will not allow a central bank to see asset bubbles coming at them from a mile away. China is doing a good job with inflation and its exchange rate, thanks to capital controls and its peg. But bubble-iscious it has become.
Plus
Financial reform bill could be written on a napkin. Anyone with a brain knows it.
1. Taxpayer backed institutions should not be allowed to play it both ways — reap rewards of massive risk-taking and have no downside for failure.
2. Derivatives must move from over-the-counter to exchange-traded [and Credit Default Swaps should be banned outright].
….read more HERE
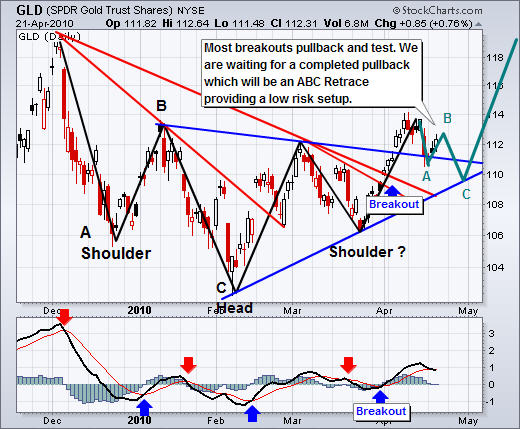
It’s been, an interesting week as stocks and commodities claw their way back up after the end of week sell off on Friday. Most of the chart technical are pointing to another wave lower for gold, silver, oil and the broad market.
This next wave of selling would form an ABC retrace pattern on the commodity charts and this pattern is bullish. Also commodity prices would drop to key support levels which would most likely provide a low risk entry point depending on the price and volume action at that time. So lower price is good for the big picture which is higher prices.
The charts below are a quick visual of what I am seeing and thinking…
GLD – Gold Exchange Traded Fund Trading Chart
The gold etf trading fund is getting closer to completing is 4 month correction and start another rally if all goes well in the coming week or two. What I am looking for is gold to hit resistance at $113 and then drop to the $110 level which is a key support level.
SLV – Silver Exchange Traded Fund Trading Chart
SLV etf fund looks ready for a pullback also. Both gold and silver tend to move together and support would be tested here also.
…..read and view more charts HERE
-
I know Mike is a very solid investor and respect his opinions very much. So if he says pay attention to this or that - I will.
~ Dale G.
-
I've started managing my own investments so view Michael's site as a one-stop shop from which to get information and perspectives.
~ Dave E.
-
Michael offers easy reading, honest, common sense information that anyone can use in a practical manner.
~ der_al.
-
A sane voice in a scrambled investment world.
~ Ed R.
Inside Edge Pro Contributors

Greg Weldon

Josef Schachter

Tyler Bollhorn

Ryan Irvine

Paul Beattie

Martin Straith

Patrick Ceresna

Mark Leibovit

James Thorne

Victor Adair