
Daily Updates
Market Buzz – Strong Q1 Growth as Simple as “ABC”
In what proved to be one of the worst months in the past 14 months, the S&P/TSX composite index closed out the month on Friday down 77.68 points to 11,671. Despite what turned out to be a negative close this Friday, the S&P TSX Composite Index stemmed, if only momentarily, the 6.5 per cent sharp drop we had witnessed since May 12.
Toronto’s main index ended the week up 1.3 per cent following a string of volatile sessions. North American indexes are down sharply from the 2010 highs at beginning of the month. The financial media will tell you the market’s May swoon is mainly due to worries about Europe’s debt crisis. But a large part of the drop was overdue based on the entirely overly optimistic outlook broader market gains had baked into valuations.
Again, the market had recovered 60 per cent from its March lows in a one year span and a pause was necessary. As May draws to a close, the Toronto market’s main index is 5 per cent from its 2010 highs (posted April 26), while the Dow Jones industrials average has fallen almost 10 per cent – it should not be shocking.
This past week saw Asia Bio-Chem Group Corp. (ABC:TSX-V) report a solid set of Q1 2010 numbers. The company, a solid gainer from our Canadian Small-Cap Coverage Universe (www.keystocks.com ), is a China-based manufacturer of cornstarch and related by-products including: corn germ, gluten, and fiber for the Chinese domestic market.
Revenues for the quarter ended March 31, 2010, jumped 109.8 per cent to $39.9 million from $19.03 million in the same period of the prior year. Net income for the quarter was $2.1 million, or $0.028 per share, compared to net loss of $0.8 million for the corresponding period of 2009, an increase of $2.9 million.
Looking ahead to next week, thirty-two of 40 forecasters polled by Reuters expect the Bank of Canada to raise rates by 25 basis points (on June 1, 2010) to 0.50 percent. Canada’s 12 primary securities dealers were unanimous in that view. Eight of the 40 saw rates staying on hold next week.
Yields on overnight index swaps, which trade based on expectations for the key central bank rate, suggested investors see a 77 per cent chance the policy rate will rise to around 0.50 percent on June 1.
An expectation that the bank will hike rates on June 1 is already helping boost the Canadian dollar, which climbed to a one-week high early Friday. The currency could strengthen further if the predictions materialize. Good for purchasing power, but bad for Canadian exporters, a group we are largely cautious on.
Looniversity – What’s in a Beta?
How much volatility can you expect from a given stock? That’s well worth knowing if you want to avoid being shocked into panic selling after buying it – which, particularly in the volatile small-cap segment, is a good thing. Some stocks trend upward with all the consistency of a firefly. Others are much steadier. Beta is what academics call the calculation used to quantify that volatility.
The beta figure compares the stock’s volatility to that of the S&P 500 index using the returns over the past five years. If a stock has a beta of 1, for instance, it means that over the past 60 months, its price has gained 10 per cent every time the S&P 500 has moved up 10 per cent. It has also declined 10 per cent on average when the S&P declines the same amount. In other words, the price tends to move in synch with the S&P and it is considered a relatively steady stock.
The more risky a stock is, the more its beta moves upward. A figure of 2.5 means a gain or loss of 25 per cent every time the S&P gains or losses just 10 per cent. Likewise, a beta of 0.7 means the stock moves just 7 per cent when the index moves in either direction. A low-beta stock will protect you in a general downturn; a high Beta means the potential for outsize rewards in an upturn.
Of course, that’s how it’s supposed to work in theory. In practice, unfortunately, past behaviour offers no guarantees about the future. If a company’s prospects change for better or worse, then its beta is likely to change too. So, use the figure as a guide to a stock’s tendencies, not as your own personal “Kreskin.”
Put it to Us?
Q. Can you explain the concept of a “yield curve”?
– Eric Anderson; Vancouver, BC
A. Outside of “stopping short to watch Beyonce walk by,” the “yield curve” can best be described through two examples.
1. A measure of the income generated by a bond. It is calculated as the amount of interest paid on a bond divided by the price.
2. The rate of return on an investment, usually expressed as an annual percentage rate.
The yield curve is a graphic line chart that shows interest rates at a specific point for all securities having equal risk, but different maturity dates. For bonds, it typically compares the two or five year treasury with the 30 year.
Securities with longer maturities usually have a higher yield. If short-term securities offer a higher yield, then the curve is said to be inverted. We do not suggest picturing Beyonce that way!
KeyStone’s Latest Reports Section
- China-based Athletic Apparel Manufacturer Posts Solid Q1, Strong Cash Flow, $68.3 Million or $1.10 per share in Cash, No Debt – Reiterate BUY (Focus BUY) (Flash Update)
- Q1 2010 Revenues Jump 109.8% for China-based Agricultural Manufacturer – BUY on Share Price Correction (Flash Update)
- Infrastructure Construction Company Receives Takeover Bid at $17.14, Shares Surge & KeyStone Clients Pocket 114.25% Gains in One Year, Close out Position – SELL (Flash Update)
- Healthcare/Hospitality Service Trust Posts Solid Q1 2010, Total Return Approaching 100%, Yield Remains Solid at 7.23%, Near-Term Organic Growth Challenging – Rating Maintained (Flash Update)
- Alternative Financial Services Provider Posts Solid Q3 2010 Revenue & EPS Growth, Aggressive Growth Plan Intact, Stock Gains Over 152% in 10 Months – Near-Term Rating Change (Flash Update)
Blowing Bubbles
BIG PICTURE – Let’s face it; central banks are blowing another asset bubble. As if two burst bubbles in the prior decade are not enough, the money maestros have decided to fuel another speculative orgy.
Let there be no doubt, both the technology and real-estate bubbles were spawned by cheap credit and it is now clear that the central banks have learned nothing from those two episodes. Despite the fact that near-zero interest-rates caused the previous mishaps, the central banks are (once again) pursuing a suicidal monetary policy. By keeping interest-rates well below the rate of inflation, the officials are encouraging speculation, thereby sowing the seeds of yet another asset bubble.
At present, the yield curve is steep in most nations and the cost of borrowing is low, so is it any surprise that asset markets are rallying? All over the world, asset prices are inflating again and dangerous excesses are around the corner. Only this time around, the public sector in the West is already over-leveraged and when the next asset bubble bursts, governments will not be able to come to the rescue.
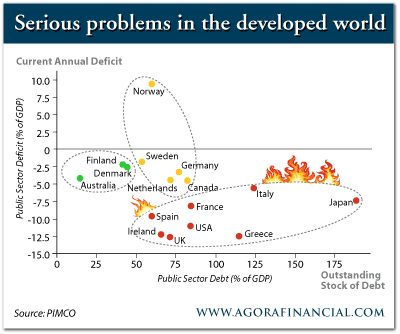
Today, most of the developed world is drowning in debt and various industrialised nations face severe deficits (Figure 1). Moreover, these over-indebted economies are struggling to grow, therefore it is highly unlikely that their stock markets will provide leadership.
Now, given the fact that the developing world is growing much more rapidly, it is highly probable that the emerging market equities will benefit the most from asset inflation.
Apart from sporting superior growth rates, it is worth noting that the developing nations have relatively low debt levels. It is our contention that this combination of strong economic growth and compressed leverage will be sure to catch investors’ attention.
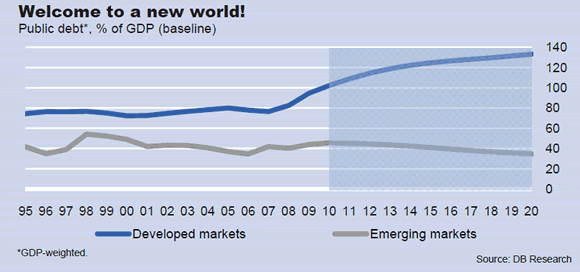
Figure 2 highlights the huge discrepancy between the fiscal health of the industrialised and developing nations. As you can see, public debt relative to the economy is already very high and likely to surge in the developed world, whereas this ratio is expected to decline in the developing world. Therefore, over the next decade, we can expect more and more investors to shift their capital from the debt plagued developed nations to the healthy developing economies.
Historically, the developing markets have traded at a valuation discount when compared the developed markets. However, over the coming years, we suspect that the ‘risky’ developing markets will command a valuation premium relative to the industrialised world. Put simply, when you factor future earnings growth and an expansion in valuations, the developing markets are prime candidates for the next asset bubble.
Since the turn of the millennium, we have favoured the developing countries in Asia and we continue to like China, India and Vietnam. In our view, these economies will prosper for different reasons and their stock markets will reward long-term investors. Now, there can be no doubt that both China and Vietnam have been disappointing over the past few months, but we view the ongoing consolidation as a fabulous buying opportunity.
In addition to the developing nations in Asia, we believe the energy sector is also a worthy candidate for the next asset bubble. In fact, when the realities of ‘Peak Oil’ dawn in investors’ minds, we could witness an outright mania in conventional and alternative energy stocks.
Although we recognise that the developed world faces some serious economic problems, we are positive about asset prices for the next 2-3 years. In our view, monetary policy determines the fate of every asset-class and as long as interest-rates are low, the ongoing bull-market should continue. In fact, history has clearly shown that each bear-market in the past was preceded by a period of significant monetary tightening. In every previous bull-market, rising interest-rates was the straw which broke the camel’s back.
Figure 3 shows the Fed Funds Rate since 1998 and plots the two most recent US recessions (pink shaded areas on the chart). As you can see, prior to the 2001 recession, the Fed Funds Rate peaked in mid-2000 and it is this monetary tightening which caused the NASDAQ-bust and the 2000-2003 bear-market. Furthermore, prior to the most recent recession, the Fed Funds Rate peaked in mid-2007 and this monetary tightening was responsible for the credit-bust and the 2007-2009 bear-market.
At present, the Fed Funds Rate is extremely low and if the economic recovery remains intact, then over the following months, interest-rates will rise. In our opinion, the next bear-market will only occur when the Federal Reserve is done raising its benchmark rate for this cycle. Now, given the precarious state of the US economy, we suspect that the Federal Reserve will increase interest-rates in baby-steps and the next monetary tightening cycle should last for at least 2-3 years. If our guesstimate turns out to be correct, the next significant correction in asset prices will occur around 2012-2013 and until then, we intend to enjoy the benefits of cheap money.

Now, before you get excited, we want to caution you that the next bear-market has the potential to be as equally traumatising as the previous one. Remember, when the bear returns in 2-3 years time, governments in the West will be unable to provide more ‘stimulus’. By then, their balance-sheets will be in a terrible state and during the next bear-market, sovereign default risk will be the Achilles Heel. So, in the next bear-market, instead of financial institutions going bust, entire nations are likely to default.
Given the ominous scenario outlined above, we want to re-iterate that we have no intention of suffering during the next bear-market. Accordingly, we will endeavour to re-position our clients’ capital towards the end of this bull-market, so that we are able to preserve our gains over the full business cycle.
If our assessment is correct, towards the end of this bull-market, we are likely to see the following red flags –
- Rising interest-rates
- Surging inflationary-expectations
- Deterioration in the market’s breadth
- Diminishing new highs and expanding new lows
- Increasing credit spreads
- Credit concerns
- Spike in the price of crude oil
- Inverted yield-curve
- Extreme investor optimism
When the above warning lights start to flash in tandem, the next recession/bear-market will be around the corner and we will switch from ‘capital growth’ to ‘capital preservation’ mode. However, as we have explained above, this bull-market should continue for the next 2-3 years and as long as the primary trend is up, we will remain fully invested in our preferred growth-producing assets.
Puru Saxena publishes Money Matters, a monthly economic report, which highlights extraordinary investment opportunities in all major markets. In addition to the monthly report, subscribers also receive “Weekly Updates” covering the recent market action. Money Matters is available by subscription from www.purusaxena.com.
An investment adviser based in Hong Kong, he is a regular guest on CNBC, BBC, Bloomberg, NDTV Profit and writes for several newspapers and financial journals.
Governments Are Born Stoic And Die Epicurean
Committee for Monetary Research and Education (cmre.org)
May 20, 2010
The phrase modifies an observation by Will Durant, who was an historian practical enough to appreciate the irony often found in history. More specifically, the long history of those who keep coming up with claims that financial history can be successfully altered provides exquisite irony. Over and over again.
In response to the liquidity crisis in the early 1620s, Edward Misselden, personally decided that throwing credit at a credit contraction would make it go away. Despite 400 years of history laughing at this notion, Chairman Bernanke is the latest acolyte of the desperate need to do something about an almost typical post-bubble contraction.
This time around, interventionists have more than bet the farm on the ancient notion that throwing credit at a contraction will make it go away. Misallocation of capital is the problem, not the solution. This brings us to the greatest irony of all. Only those who have not thoroughly read financial history are capable of concluding that financial history can be altered.
Two of the longest running policy blunders will help make the point. In the late 1940s as long-dated treasuries rose above 3 percent there was a concerted effort to keep rates down. The theory was that the Treasury would buy enough bonds out of the market that rates could be lowered. As the saying goes “Nonsense so blatant that only an intellectual would fall for it”.
Not too daunted by trying to keep rates at 3 percent, a massive effort was made in the 1960s to keep rates from rising above 6 percent. Despite being aggressively promoted as “Operation Twist” and due to the currency issued rates soared to 15 percent in 1981.
The next monstrous failure was the long official bear raid on gold that culminated with the then Chancellor Brown selling UK reserves down to the low at 252 dollars. The recent high has been 1249. For a grand name, perhaps the failed policy could be called “Operation Barbarous Relic”.
How could such blunders be made?
Let me illustrate with a traveling salesman story from the 1930s:
This takes place as a guy who knows little about cars is driving along a remote country road. Naturally, his troubles begin as daylight is fading and eventually the engine dies.
Compelled to do something, he lifts the hood and with a dim flashlight stares at the engine. Suddenly from the field beside him, he hears a very deep voice saying, “Tap the fuel pump with your flashlight and if it goes click, click, click, you’ll get your fuel pressure back.”
Startled, he looks into the gloom and all he sees is a horse. Nevertheless, he tries it and before driving away looks around again and sees nothing but the horse.
Somewhat shaken, he stops at a tavern to calm his nerves. A local sitting next to him at the bar inquires about his distress and he tells the story.
The local, after a considerate pause, asks him what colour the horse was.
Our friend says “white”. The local says “You’re lucky, the black horse knows diddly-squat about cars.”
The guys running things know diddly-squat about the markets.
Particularly that the history of financial manias shows a methodical transition from boom to bust. As Fed chairman, Alan Greenspan, naively advised that a bubble could not be identified as such until it was over. The next official blunder was when a bubble was finally recognized judicious application of yet more credit would prevent serious adversity.
Even cartoonists during the 1720 bubble had no problem calling that speculative fury a bubble.
To be serious, the mob of policymakers are in hot pursuit of another major blunder which is “Stimulus”, or as the Trillion Dollar Euro bailout is being called “Shock and Awe”. With little doubt this will eventually be seen to be just as foolish as “Operation Twist” or the mindless bear raid on gold.
The reason why this mob of policymakers is in hot pursuit of yet another blunder is that from time to time society needs a “philosopher king”. What’s worse – there will always be someone who would be a philosopher king and the charismatic Obama literally forced Germany to go along with the scheme to bailout Greece. As Zorba said in the movie, this will be the “full catastrophe”.
There is long history to such disastrous leadership.
In the 1970s, Barbara Bell published some papers on drastic setbacks in ancient Egyptian central government under the relentless pressure of declining harvests from declining Nile floods. She pointed out that the pharaoh was a type of divine king who “holds his sovereignty by virtue of his magic powers”. Sounds like the regard for Greenspan and Bernanke.
At the height of the manias in 1873 and in 1929, the commanding skills of the treasury secretary were celebrated. This was the ability to buy bonds out of the market to prevent bad things from happening, or when a crash is on to prevent it from running forever. The amazing thing about the body of interventionist thought is that it does not understand that markets clear – eventually and always – no matter how arbitrary governments are.
Of course, the power behind the pharaoh was a priesthood of advisors. Who, as poorer seasonal floods brought hardship and eventually famine would promote a new pharaoh who was sure to fix the problem. What follows bears upon the fall of the Berlin Wall in 1989.
The ancient governing classes were protected by palace guards, who were not of the governing classes. With mounting popular dissatisfaction the guards joined the public and laid down their spears. Smaller and more fractured central government followed.
Authoritarian politics thrives during booms and loses ground during contractions. There was an important high in commodity prices in 1988 and the subsequent decline signaled the possibility of change. The Berlin Wall came down in November 1989 registering extreme dissatisfaction with corrupt and fat government. The underlying condition was that the guards protecting the governing classes were of the oppressed public and laid down their rifles when East Germans wanted to go shopping in West Germany. With this the dictator, Erich Honecker, had to change the law permitting the state to murder Germans when they wanted to go to another part of Germany.
That attempt to reform a murderous police state saw no bloodshed and has been remarkably successful. It marked the end of a long and particularly nasty experiment in authoritarian government.
As ugly as they are, there has been only three great experiments in bullying government. In the Third Century Rome was corrupted from a republic to a brutal police state. All it took was two great wars with the state not relinquishing its authority in between.
In the Sixteenth Century the prevailing organization was the Catholic Church and it was also corrupted by authoritarian ambition.
In the Twentieth Century, bureaucracies and their politicians in all countries became ambitious. Inspiration was provided by Marx, Lenin, Roosevelt and Keynes. Ideas of command and intervention are nothing new and one of the great examples was the New Deal run in Old Rome. Price and wage controls were backed by the sword. In a series of crackpot controls, Rome was “New Dealed” to death.
The other characteristic of each Tyrannical Century was chronic monetary depreciation. Tribute and taxation, even confiscatory taxation, could not satisfy the demands of unlimited government.
As if a century of intrusive and at times murderous governments is not bad enough. Each has been accompanied by chronic inflation. In the Third Century the best estimate is a forty-times increase in basic prices. In 1900, England was the senior economy and by late in the century prices had been inflated by a factor of forty.
There seems to be two kinds of severe inflation. Those that afflicted the Weimar Republic, or banana republics. Then there is the one that afflicts the senior economy. In their own way, each can be considered as a hyperinflation.
But before expanding this, I would like to address some comments to the liberals at this meeting, who may be upset with having Roosevelt and Keynes mentioned with Marx and Lenin.
Murray Gell-Mann, the modern physicist, crafted a remarkably elegant definition of an authoritarian or totalitarian system:
“That which isn’t prohibited is compulsory.”
And that pretty well describes the intrusive politics of Marx and Lenin, Roosevelt and Keynes and any other charismatic missionary of big government.
There is another common feature. Each great experiment lasted for around one hundred years. Ours started in the early 1900s which was the height of disciplined classical liberalism. In so many words, limited and therefore stoic government. It was also the end of that Great Depression and with the prospect of a long expansion ahead there would have been some trend towards collectivism of some kind.
But, even with knowledge of previous tyrannical centuries, there is no way of knowing that the next one hundred years would provide such a political horror show.
Fortunately, there is enough of a recurring pattern to recognize the symptoms of ending action. The main ending event is that even with the ability to depreciate the state will run out funds. As attributed to Margaret Thatcher, “Eventually, socialists run out of other people’s money”.
Our research team’s approach is to anticipate change in financial markets. On April 22 we published our check list for an important top.
It seems appropriate to make a check list for the end of a Tyrannical Century.
First point, has government been expanding relative to GDP? Yes – in 1900 all levels of government were taking about 5 percent of GDP. Stoic was good, and now the take is around 40 percent, with the current administration growing at a destabilizing rate. This is becoming very much “in-your-face” as the private sector has been suffering rising unemployment and lower wages as government expands its employees and their wage rates. Government is now epicurean.
At the end of the Third Century, the population of Rome itself was almost one million, with almost 500,000 on welfare. Rome’s corruption from a republic to a police state was assisted by confiscatory taxation and chronic depreciation. Much of it to support a greedy bureaucracy and its clamoring dependents. Quite like the Twentieth Century.
Second check, in the past hundred years the trend has gone through and beyond the brutality of Orwell’s “Big Brother” in Russia to the bitter comedy of “Animal Farm” with the current administration.
Third, have there been signs of political excess? The left is saying that America has become ungovernable. No, it is the administration that has become ungovernable. Naturally, the Democrats and the mainstream media consider that energetic opposition is seditious or rebellious. I wonder if political scientists are working on a term to describe a popular movement determined to get the federal government back to the constitution?
Fourth, each great experiment in central control has ended when the markets would no longer tolerate deliberate currency depreciation, dislocating intrusions and confiscatory taxation. Markets are no longer tolerating endless debt issue. This is now the case for sovereign debt and will soon be the case for more senior countries.
There is an old saying from the old and notorious Vancouver Stock Exchange, and is that so long as it is going up the public will believe the most preposterous story. Then, when the price fails belief fails and is followed by remorse.
It is not too big a step to consider that so long as government credit is expanding too many will believe in its bounty and blessings. Or will be complacent. However, the changes in the financial markets that began in 2007 are reducing the market’s abilities to fund ambitious government. In April our work noted the change in the money markets that would soon afflict corporate bonds, stocks and commodities.
This week’s setback is likely the next step in the typical post-bubble credit revulsion, which on the near term is an impartial adjudication on the great European bailout. President Sarkozy’s notion that a Trillion dollar fix would “confront speculators unmercifully” reveals bureaucratic hostility to market forces rather than understanding.
With considerable volatility, global markets are step by step taking away the ability to fund reckless government. In the US, the Tea Party movement is beginning to instruct Washington on the abuse of the thrifty tax payer. As the success of the movement builds, the Tea Party will find its leader. In the 1770s it was George Washington; a well-to-do farmer. Perhaps on this reformation the leader could be the equivalent of Lech Walesa in Poland; a stalwart from the union movement.
By way of summary, the forces in play are immense, and a hundred years of unfettered credit expansion culminated in the biggest financial mania in all of history. Going into the top of the bubble the establishment ignorantly boasted that the false prosperity of the boom was sustainable and problems could be isolated. The rebound out of the initial crash has been natural and exaggerated by the “stimulus” laid on by ambitious leaders.
It seems very likely that the big “Stimulus” will be as successful as earlier grand schemes such as “Operation Twist” to keep rates from rising to 15 percent, or the endless bear raid on gold now named “Operation Barbarous Relic”.
The markets can no longer afford the debt that was issued during the voluntary mania and will not be able to service recent excesses that have been coercively imposed. All five previous post-bubble contractions changed the world and this one will continue to the point of forcing a bear market in ambitious government. Think of it as a bear market for epicurean governments.
On the positive side, the thwarting of centrist ambition will release another renaissance of thinking independent of serving statist ambition. In the Sixteenth Century, ambition often use astrology to back its weighty decisions and as the one of the biggest banks in history noted in a few of its market letters – it was mainly the state that funded alchemy.
Over time, all the institutions of authority were examined. Impartial inquiry turned astrology into astronomy and alchemy into chemistry. Eventually, independent research will fully understand that interventionist economics is just a front for the ancient need for astrology and alchemy.
History is reentering an exciting period for the individual and regionalism. It will be challenging and rewarding for thrift and prudence. It will also be intellectually rewarding for those who are independent of state corruption.
What about those who are eagerly predicting the collapse of America? They will be the losers, as “America” has been the recent holder of the baton of freedom and prosperity. Originally it was held and passed on from Greece to Rome. As Rome became corrupt the baton moved to Northern Italy as the financial center also moved to Northern Italy. In the Fifteenth Century the money center voluntarily moved to Augsburg, a great silver mining camp – as was ancient Athens.
Compelled by trade, it moved to the Netherlands with Bruges, Antwerp and Amsterdam. Then the baton of freedom and prosperity moved to London and New York.
America is unlikely to collapse and be encompassed by unrelenting globalism. That is the old story.
Quite likely it will be the long experiment in authoritarian government that is exhausting itself as it demands ever-greater amounts of money as politicians jump from one crisis to the next. Quite likely this will also exhaust the thrifty taxpayer and markets that will eventually become increasingly critical of financial adventurers in policy.
As in past examples, the trappings of big government that have been so un- American will be thrown off.
These conclusions may prompt incredulity, but as we used to say on the old Vancouver Stock Exchange – “Remember where you heard it.“
![]()
At a MoneyTalks Conference in Nov. 2007, Independent analyst Bob Hoye of Institutional Investors warned that a contraction of credit would reap havoc with all financial assets. Bob Hoye warned again at the World Outlook Conference on Feb. 2008 when he said, “We are experiencing the beginning of the greatest train wreck in the history of credit.”
Free Trial HERE.
SPECIFIC USERS: Our models cover the yield curve, credit spreads, industrial commodities, and the stock markets. We have integrated these essential items into unusually reliable strategies and perspectives for Chief Investment Officers, Portfolio Managers and on the medium to shorter term opportunities, our research is used by stock, bond and metal trading desks.
In a very compact form, we offer advice on overall investment strategy for CIOs including investment managers in Asia, Australia, Canada, Europe, the U.K and the U.S. as well as some government treasury and/or pension fund operations in Canada.
The term “investment managers” also includes hedge funds as well as pension funds running some rather aggressive fixed income and equity desks.
Some international mining companies are also subscribers, whose treasury operations, long range planning departments, or metal trading desks use the research.
Our value-added contribution to investment management is that during the expected increase in volatility, our models have anticipated most of the major trend changes.
That’s usually with enough time and with a confidence sufficient to implement policy in an anticipatory manner rather than in an ad hoc rush.
Our overall model is based upon the main financial characteristics of previous New Eras, their dramatic climaxes, and subsequent developments.
This makes our long term view rather unique in the history of investment research and the original conclusion that our uniquely thorough research would provide the most reliable guidance through a new financial era has been confirmed.
Subscription fees are negotiable depending upon the size of the account and the services required and we do provide service to non-institutional high net worth individuals worldwide.
We publish generally every Monday and Thursday as well as when opportunities are identified and the market prompts. By way of “proof of the pudding”, we will provide you with a FREE TRIAL SUBSCRIPTION.
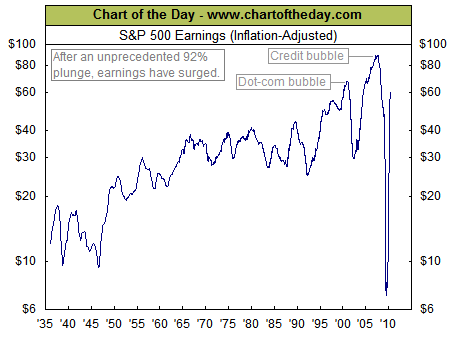
With first-quarter earnings basically in the books (99% of S&P 500 companies have reported for Q1 2010), today’s chart provides some long-term perspective to the current earnings environment by focusing on 12-month, as reported S&P 500 earnings. Today’s chart illustrates how earnings declined over 92% from its Q3 2007 peak to Q1 2009 low — the largest decline on record (the data goes back to 1936). Since its Q1 2009 low, S&P 500 earnings have surged (up over 700%) and currently come in at a level that has only been exceeded during the latter years of the dot-com and credit bubbles.
How do I get my free Chart of the Day?
Simply enter and submit your email address HERE (we won’t share it with anyone) and you will receive one free chart per week and instantly receive the latest free Chart of the Day.
The equity market has found some critical support after what can only be described as a manic May. In fact, in 16 of the past 23 sessions (or 70% of the time), we have seen the Dow moved 100 points or more (in fact, the Dow has posted an amazing 16 straight sessions of 200+ point intra-day swings). So whether one is a bull or a bear there is one fact that is not disputable, which is the degree of the volatility we are dealing with. As an aside, these wild swings are characteristic of a bear market, not the hallmark of a bull market, and to make the point clear, the last time we saw this much volatility (16 triple digit swings in 23 days) was back in the depths of despair in that post-bazooka period in November-December 2008.
We should add here that despite the hefty gains posted yesterday, volume fell across the board. In other words, we have a bounce going as the gaps get filled but there is little conviction that this thing has any legs. As the front page of the Investors Business Daily attests, there is now a huge public backlash against more fiscal stimulus, and yet, it has been this unprecedented incursion by the government into the economy and the capital markets that ignited the green shoots in the data and all the investor enthusiasm in the equity market. Amazingly, the current stimulus bill making its way through Congress is now in the process of being cut back — the ‘blue dog’ Democrats are back (ostensibly much to Mr. Summers’ and Ms. Romer’s chagrin).
Let’s not take our eye off the oil spill ball, either (now being dubbed “Obama’s v Katrina”) — the decision to suspend all offshore oil and gas drilling will surely exert an economic impact that is downward in nature. We can hear it now —“the problems in Mississippi and Louisiana shall remain contained” (as they were in Greece … right).
In today’s issue of Breakfast with Dave
• While you were sleeping; global equity markets are broadly firm; government bond yields have stopped surging; euro remains weak; commodities and commodity currencies are bouncing back
• A golden letter: Every now and again, I like to reprint pithy thoughts from our readership
• May day! The equity market has found some critical support after what can only be described as a manic May
• Surprising downside GDP revision: U.S. real GDP for Q1 was clipped to a 3.0% annual rate versus 3.2% in the advance reading
• U.S. labour market sputtering? The improvement in the second half of last year that led the turnaround in payrolls this year has completely stalled out
• U.S. CPI in pictures: Who has pricing power and who does not
Sign up to read the full article HERE
-
I know Mike is a very solid investor and respect his opinions very much. So if he says pay attention to this or that - I will.
~ Dale G.
-
I've started managing my own investments so view Michael's site as a one-stop shop from which to get information and perspectives.
~ Dave E.
-
Michael offers easy reading, honest, common sense information that anyone can use in a practical manner.
~ der_al.
-
A sane voice in a scrambled investment world.
~ Ed R.
Inside Edge Pro Contributors

Greg Weldon

Josef Schachter

Tyler Bollhorn

Ryan Irvine

Paul Beattie

Martin Straith

Patrick Ceresna

Mark Leibovit

James Thorne

Victor Adair