
Daily Updates
Market Buzz – China Slows, Boyuan Still Grows
Toronto’s main index closed up 31.07 points to 11,666.92 this past Friday and posted a rebound week, despite the fact the U.S. Commerce Department reported that retail sales for May were down 1.2 per cent – the largest amount in eight months – against expectations for a gain of 0.2 per cent.
The data is key because U.S. consumer spending accounts for three quarters of the country’s economy and a fifth of global economic activity. It added to disappointment over U.S. job creation in May and worry about how Europe’s fiscal crisis could impact the global economic rebound.
But stateside, the Dow Jones industrial average logged its first winning week in a month.
The Dow rose 39 points Friday and ended the week with a gain of 2.8 per cent, its best weekly advance since mid-February. The market slid in morning trading on disappointing retail sales numbers but started to pare its losses after a report found consumers are gaining confidence in the economy. The market climbed in the last hour of trading to end near the highs of the day.
In the face of the retail sales data, the market found confidence in the preliminary Reuters/University of Michigan consumer sentiment index for June, which showed consumer confidence rose to its highest level since January 2008 and came in well ahead of forecasts. This was a bit of a surprise in our view.
Switching gears, we look to the East where, despite fears of China’s infrastructure build coming to a screaming halt, Canadian-listed Boyuan Construction Group Inc. (BOY:TSX), which is based in Jiaxing City, China and in the business of commercial and residential building construction, municipal infrastructure, and engineering, recently posted a strong set of quarterly growth.
Recently, Boyuan announced that its total contract revenue earned jumped 71.24 per cent to $103.6 million for the nine month period ended March 31, 2010, from contract revenue of $60.5 million for the same period last year. Q3 net income rose 86 per cent to $2.1 million, or $0.08 per share, from $1.16 million, or $0.05 per share, in the same period last year.
While we agree that the pace of growth is rightfully being slowed, the long term (three to ten years and beyond) continues to look bright for companies supporting this infrastructure build.
Finally, see the “Put it to Us” section below for further positive news from one of last year’s top recommendation’s from our Canadian Small-Cap Universe (www.keystocks.com), The Cash Store Financial Services Inc. (CSF:TSX).
Looniversity – Dollar Cost Averaging
Dollar Cost Averaging (DCA) — purported to cure the sick, feed the hungry, make Paris Hilton tolerable, and, of course, produce tremendous investment returns. While claims of its all-encompassing power tend to be exaggerated, DCA can help reduce your risk, which is no small feat.
Essentially, DCA is a systematic investment plan under which investors make predetermined periodic purchases of a fixed amount on a monthly, quarterly, or even yearly basis. The strategy protects your portfolio by forcing you to buy more shares when the market is falling and fewer shares when the market is rising. In the end (assuming markets increase over time), your cost per share is lower than the average price per share.
The true beauty of DCA can be found in its stone cold, emotion free structure and is often realized during a down market. When the market is falling, investors tend to believe it may fall indefinitely, and find it difficult to make purchases. Conversely, when the market is rising, investors tend to believe it will go up forever, and go on a buying spree. In most cases, this is exactly the opposite of what should be done. A DCA strategy forces you to put aside your “gut reaction” and continue investing periodically no matter what the current market psychology.
Caveat – If your plan to use the DCA method, make sure to look at that stock you are investing in and ensure that the basic reason you originally bought the stock (i.e. It is a great business, profitable, growing at above average rates or with a solid yield, limited debt, and trading at reasonable valuations) remains in place. If it does not, consider selling rather than dollar cost averaging.
Put it to Us?
Q. I am a long-time subscriber (client) of yours (www.keystocks.com) and bought The Cash Store Financial Services Inc. (CSF:TSX) on your recommendation at $7.00 last summer. We are very happy with it now trading at $16.75 and it keeps paying us dividends! This week I heard it was to list on the New York Exchange. How will this affect my stock and will I have to trade it on the NYSE now?
– Roy Arnold; Toronto, Ontario
A. Roy, you are correct. We are happy to report that on June 3, 2010, one of our Focus BUYs from 2009, The Cash Store Financial Services Inc. (CSF:TSX), Canada’s largest alternative financial services company, announced that its common shares have been authorized for listing on the New York Stock Exchange (NYSE). The company shares began trading on the NYSE on June 8, 2010, under the symbol “CSFS.” You may continue trading it on the TSX as well as the company has retained its primary listing on the Toronto Stock Exchange. As far as the impact on the stock, there is nothing really business wise (with respect to earnings or revenues) that the NYSE listing creates. However, the listing does represent an opportunity for the company to reach a broader investment base in the United States and will help to gain greater exposure in this critical investing market. Ultimately, its continued success will continue to come down to management’s execution on its growth strategy and continued efforts to growth cash flow, earnings, and your dividend.
KeyStone’s Latest Reports Section
- IP Company’s Q4 EPS Exceed Expectations, Solid Fundamentals, Strong Cash Position & Yields 4.6% – Near-term Rating Upgrade (Flash Update)
- Western Based Financial Service Provider Posts Solid Start to 2010 – Near Term HOLD (Flash Update)
- Pure Play Chinese Construction Company Reports Strong Q3 2010, Solid Backlog, PE of under 6, Yet Shares Drop? – Update Rating (Flash Update)
- Canadian Rare Earth & Magnetic Powder Processor Posts Strong Q1 from Pent-up Demand, Cash Rich ($0.55 per share), Strong EPS Growth Long term (New Buy Report)
- China-based Athletic Apparel Manufacturer Posts Solid Q1, Strong Cash Flow, $68.3 Million or $1.10 per share in Cash, No Debt – Reiterate BUY (Focus BUY) (Flash Update)
Stockscores.com Perspectives for the week ending June 11, 2010
The Stock Doctor
In this week’s issue:
Weekly Commentary
Strategy of the Week
Stocks That Meet The Featured Strategy
![]()
Have you ever thought about breaking your trading decision down the way a doctor looks at a problem? Imagine if a doctor made decisions on your health using the same process as you use to make trading decision. I am quite sure that many people make “instinctive” trading decisions that hurt their financial health, so let’s consider a series of steps that should be taken in the trading process.
Diagnosis
The first thing you need to do is figure out what the situation is. Are the buyers or sellers in control? You answer that question by looking at the stock chart and whether there are rising bottoms on the chart or falling tops. Rising bottoms means the buyers are in control while falling tops show the sellers are strong. Look at six month time frame to judge the near term sentiment but also look at a two year chart to get a feel for the longer term sentiment.
Have they just taken control or are we nearing the end of their reign? For this, check the two year chart and see how long one side or the other has been in control of the market. Keep in mind that one side could be in control in the relative short term while the other side could be dominant in the longer term. This can set up a good opportunity since the longer term time frame will usually win over the shorter, providing a trading opportunity for someone who times the reversal back in favor of the longer term time frame.
Is the stock trading rationally or emotionally? A rational market will be in a linear trend. An emotional market will be much steeper, more of a curve. Emotional markets usually regress back to the linear trend line, setting up another type of trading opportunity.
Finally, is the stock trading in a way that provides opportunity? Most stocks, most of the time do, not provide a good trading opportunity because they are efficiently priced. However, a great trading opportunity may exist in cases where the market is trading emotionally or where there is important new information coming in to the market.
Prognosis
With diagnosis you can make a prognosis, a telling of what will happen in the future. A stock that has gone up with emotional buying will eventually correct. A stock breaking down from a pessimistic trading pattern will likely go in to a downward trend. Abnormal buying on strong volume out of a period of sideways trading often leads to a strong upward trend.
Verification
Correct Prognosis is only profitable if it is well timed and it is the timing of trade entry that is the most difficult. You can go broke by making the correct diagnosis and prognosis if you don’t time the entry correctly. I always look for a trigger to prove my Prognosis correct. If I am considering shorting a stock that has gone up with emotional buying, I want to see a break of the upward trend line as the trigger to take the short. For me to take a trade, the market has to show a little hint that I am right. This means I will get in just slightly late but it also dramatically increases the probability that I am right.
Execution
With Verification comes the cue to execute the trade. With good diagnosis and prognosis, this is a simple matter of completing the transaction. However, with every execution you must also know under what conditions your diagnosis or prognosis has been proven wrong. This is the stop loss point, the price level where the market has told you to exit the trade and go back in to diagnosis mode. You must know your stop loss point at the time you execute the entry for your emotional self will change your interpretation of what the market is telling you once you are in the trade.
Evaluation
As the market evolves and prices change, always evaluate. Remember that the market is not a perfect pricing mechanism, there is a lot of uncertainty and that causes price fluctuations around the general price move. Buying a stock with the correct diagnosis, prognosis and verification does not mean that it will instantly go in to an upward trend and a failure to do so means you were wrong in some way. Expect and accept some deviation from the plan but if the stock goes off course to the point that you have been proven wrong, get out of the trade.
Completion
If everything works out and you make the right trade, the winning trade, then there will come a time when the trade will have played itself out and it is time to exit. The completion is the most difficult step in the process because it requires the patience to wait for the play to develop. You must work to maximize profit when you are right and minimize loss when you are wrong.
Take these trading elements to heart and work through them individually every time you trade. Whether I am doing a day trade to hold for the next 10 minutes or a position trade to hold for the next 10 months, I always break the trade down in to these steps. Actually, there are times when I make mistakes and don’t do each step, and when I do, it always seems to cost me money.
![]()
This past week was an important one for the stock markets. On Tuesday, stocks found support at the same place that they found support on May 25th and bounced. That is not enough for a reversal, I wanted to see a break of the downward trend line that had been in place since late in April. A late day rally Friday accomplished that for the Dow and S&P 500 indexes who both made the important break through support at the downward trend line.
This means we have likely see the low and the market is now more likely to go higher than lower. The US markets fell harder than the Canadian so they will have more to gain. However, I think the Canadian markets have more potential longer term, provided the US dollar can back up after its extreme strength relative to global currencies.
- Get the StockSchool Pro Free

DisnatDirect named the number one Canadian brokerage for Traders by Surviscor! Open and Fund a brokerage account with DisnatDirect and receive the StockSchool Pro home study course free, including special Pro level access through the DisnatDirect client website. Offer only available to Canadian residents. For information, click HERE
- Get the StockSchool Pro Free
![]()
1. T.NSU
Cup and handle breakout on T.NSU (which also trades on the AMEX as NSU) on strong volume. Support at $2.85.

2. NOVL
Good break through resistance on NOVL today, not an ideal situation because of resistance from 2008 and volume was not too strong. I would look for a confirmation signal for entry on the 15 minute chart. Support at $5.75.

References
Get the Stockscore on any of over 20,000 North American stocks.
Background on the theories used by Stockscores.
Strategies that can help you find new opportunities.
Scan the market using extensive filter criteria.
Build a portfolio of stocks and view a slide show of their charts.
See which sectors are leading the market, and their components.
Click HERE for the Speaker Lineup and to Purchase the video if you want to learn from some of the worlds best traders including Tyler Bollhorn.

Tyler Bollhorn started trading the stock market with $3,000 in capital, some borrowed from his credit card, when he was just 19 years old. As he worked through the Business program at the University of Calgary, he constantly followed the market and traded stocks. Upon graduation, he could not shake his addiction to the market, and so he continued to trade and study the market by day, while working as a DJ at night. From his 600 square foot basement suite that he shared with his brother, Mr. Bollhorn pursued his dream of making his living buying and selling stocks.
Slowly, he began to learn how the market works, and more importantly, how to consistently make money from it. He realized that the stock market is not fair, and that a small group of people make most of the money while the general public suffers. Eventually, he found some of the key ingredients to success, and turned $30,000 in to half a million dollars in only 3 months. His career as a stock trader had finally flourished.
Much of Mr Bollhorn’s work was pioneering, so he had to create his own tools to identify opportunities. With a vision of making the research process simpler and more effective, he created the Stockscores Approach to trading, and partnered with Stockgroup in the creation of the Stockscores.com web site. He found that he enjoyed teaching others how the market works almost as much as trading it, and he has since taught hundreds of traders how to apply the Stockscores Approach to the market.
Disclaimer
This is not an investment advisory, and should not be used to make investment decisions. Information in Stockscores Perspectives is often opinionated and should be considered for information purposes only. No stock exchange anywhere has approved or disapproved of the information contained herein. There is no express or implied solicitation to buy or sell securities. The writers and editors of Perspectives may have positions in the stocks discussed above and may trade in the stocks mentioned. Don’t consider buying or selling any stock without conducting your own due diligence.
When gold hedge won’t do, consider investing in silver
If you’re a gold investor, you have to be worried about an unwonted outbreak of good news. What if the economy doesn’t enter hyperinflation? What if peace breaks out, or the world’s terrorists scare themselves to death?
Gold rarely thrives on good news, so you might consider adding silver to your portfolio. Like gold, silver is a good investment if paper money collapses. But unlike gold, silver is also an industrial metal, and demand for silver should rise in an economic recovery.
As an added bonus: An ounce of silver is far cheaper than an ounce of gold. Like gold, silver is widely used as a medium of exchange when paper money loses its value. It’s a good store of value, and easier to carry around than chickens or canned hams. Silver and gold have been rising in the past few years, and with good reason:
…..read more HERE
The single most common emailed question I’ve gotten — from readers, from clients, from the media — is “Do you buy BP? If so, when, where and how?”
Before we proceed, please understand what my thought process is: I want us to consider, weigh and try to determine what the possible risks are versus the potential reward is in this stock.
I suggest those of you who are considering buying or selling BP think about the following ten issues:
1) BP’s Stock is in Freefall: As the nearby chart shows, BP is down more than 50% from recent highs. Its 200 day moving average is up ~45% from current prices — near 55. Click Chart for larger BP Chart.
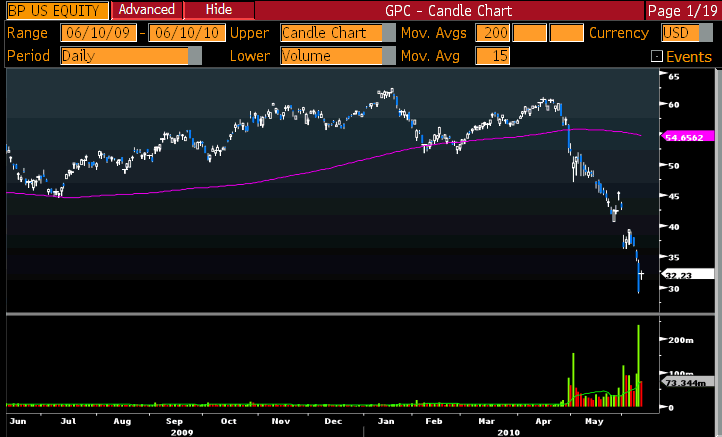
The current market cap is about $100B, almost 40% below its Enterprise Value of $141.65B.
When making a trade in a stock like this, you want to do more than merely hope for a binary outcome – i.e., Make money or Lose money. The goal is to understand what the risks and rewards are, predetermine the losses/downside, and put ion the best risk/reward you can.
There is intelligent speculation and outright gambling. If this trade fits your profile, aim to do the former and avoid the latter.
Research project: In distressed companies, at what levels have we seen ideal entries — in terms of price off of highs, below enterprise value, percentages below 50 and 200 day MA, dividend yields, and P/E ?
2) Is this a Trade, or an Investment? : There are different rules for Trading than Investing. Before you step into a name in distress, be sure to understand exactly what your goals are, your risk tolerances, and your time horizon.
My guess is the vast majority of the huge volume spike in BP are stat arbitrage (between the common stock and bonds, there are apparently no convertibles) and a mix of day traders and hedgies. If you plan on making BP a long term investment, then you should be thinking in terms of a longer holding period — years, not months.
A universal rule: Never allow a trade to become an investment.
….read 3-10 HERE
-
I know Mike is a very solid investor and respect his opinions very much. So if he says pay attention to this or that - I will.
~ Dale G.
-
I've started managing my own investments so view Michael's site as a one-stop shop from which to get information and perspectives.
~ Dave E.
-
Michael offers easy reading, honest, common sense information that anyone can use in a practical manner.
~ der_al.
-
A sane voice in a scrambled investment world.
~ Ed R.
Inside Edge Pro Contributors

Greg Weldon

Josef Schachter

Tyler Bollhorn

Ryan Irvine

Paul Beattie

Martin Straith

Patrick Ceresna

Mark Leibovit

James Thorne

Victor Adair