
Daily Updates
So now we have a fiercely oversold market sparked by a Dow Theory non-confirmation.
This should revive bullish sentiments although I believe only sharp traders and speculators will profit from this “sudden” rally. As I see it, the bear is passing time and having a little fun with the stock market crowd. And all the time, the top of this rally from the June low grows bigger and bigger. By the way, now you see why I warned subscribers to avoid selling short. If you’re short, you can be killed by a rally of this intensity. – Richard Russell July 7th Dow Theory Letters
This article by MoneyWeek. Try out their three-week free trial
The shipping index has dropped 50%. What does it mean?
Stock markets have had a rough week or so. But that’s nothing compared to what’s been happening in a slightly more obscure market.
Yesterday, the Baltic Dry Index saw its 27th consecutive day of losses. That’s the longest continuous slump for five years.
The Baltic Dry measures the cost of shipping dry bulk goods – commodities such as iron ore and coal, for example. The index fell off a cliff during the credit crunch in 2008, as credit to finance global trade froze.
So what is the current sell-off telling us about the state of the global economy?
Should you worry about the shipping index sell off?
The Baltic Dry Index (BDI) has fallen almost in half since the end of May – as you can see on the chart below:
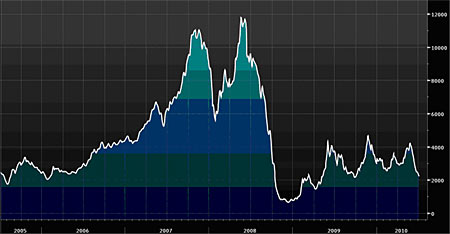
Wow. That looks nasty.
But let’s put it in perspective. This is nothing compared to the 95% drop the index saw before and during the financial crisis of 2008, as you can see.
And by and large, analysts are saying that we don’t need to get too worried about this sell off either. Why not?
The BDI measures the cost of shipping raw materials from one place to another. If the price of moving raw materials falls, then you’d assume that people are moving less stuff around the world. Presumably, that’s because demand for finished goods is also slowing down. Therefore, a drop in the BDI suggests that the global economy must be slowing down.
That’s all very logical. But it misses one point – the supply side. Because it measures the cost of shipping, the BDI might also be saying that there are simply too many ships. The BDI hit a record high in 2008, as demand for shipping rose far ahead of the supply of ships available.
So, as you’d expect, that meant that more ships were built. And fleets are still growing now, even although demand has fallen to more normal levels. More ships and static demand means shipping rates are falling.
As dry bulk researcher Derek Langston of Simpson Spence and Young told the Financial Times last month: “We still anticipate this year we will see a record year in terms of annual growth of trade. However, this is also accompanied by record growth in fleet supply.”
So everything’s just fine then? Well, we wouldn’t go that far. Melissa Kidd at Lombard Street Research is rather less sanguine about the fall in the index. Sure, “the quality of the BDI as a leading indicator has been disrupted by an oversupply of shipping.” But “the message of weaker global activity is supported by a range of other indicators.”
Chinese growth is slowing
One big factor in the fall has been a drop off in Chinese steel mill demand for iron ore. Iron ore shipments fell year-on-year in both April and May, according to Bloomberg. Iron ore is of course, a key ingredient in steel manufacturing.
But domestic steel prices in China have been falling for the past ten weeks. This is partly down to tighter monetary conditions. The construction industry is the major driver of steel demand. China’s attempts to curb the property market have hit steel consumption and therefore prices.
With iron ore prices remaining high, that’s pushed steel makers into losses. As Andreas Vergottis at Tufton Oceanic tells Bloomberg, “Profitability of Chinese steel mills is zero now, we think.”
The trouble, says Kidd, is that “China has been the world’s engine of growth for… commodities over the last 12-18 months. A cooling off in Chinese demand growth – prompted by ongoing monetary tightening – will impact heavily on global price developments” in the commodities market.
And China’s not the only one slowing down. “The JP Morgan Global Manufacturing PMI has fallen from a high of 60.9 in April to 57.0 in June.” The reading for new orders was particularly hard hit, falling from 60.3 to 55.5 over the same time. “While a PMI of over 50 points to economic expansion rather than contraction, the drop in the index components points to a slowing down in the pace of recovery.”
A turning point for the global recovery
What all this boils down to, says Kidd, is that “the global recovery has reached a turning point as the momentum provided by the inventory cycle wears off.” In other words, company restocking is now ending, and we’re waiting to see what sort of ‘real’ demand remains to pick up the slack once government stimulus is removed.
Just how bad things get remains to be seen. But even a slowing of demand doesn’t bode well for hard commodity prices in the second half of the year.
Try out MoneyWeekwith a three-week free trial
Every day, an awful lot is written and spoken about finance and investing. Much of it is incredibly boring, lots more is either meaningless or plain stupid, and most of it is a complete waste of your time.
Our aim is simple: to give you intelligent and enjoyable commentary on the most important financial stories, and tell you how to profit from them.
So how do we do that?
Firstly, by talking to thoughtful people who know their stuff. That means City professionals, fund managers, stockbrokers, industry experts, and the commentators that we respect. We have a wide range of financial professionals who write regularly for us, come to our monthly ‘Roundtable’ discussions, and who contribute their expertise to the ongoing MoneyWeek debates.
Secondly, by reading a huge amount of financial news and commentary every week. That means all the mainstream sources – press, websites and magazines – and many more specialised ones, such as broker reports, newsletters, newswires, trade journals and so on.
And finally, by writing articles that we would want to read ourselves, which means intelligent, thought-provoking, practical (as in, advice you can make money from) and entertaining, written in normal English.
Try us out with a three-week free trial
1. For the past 6 months or so, I’ve tried to show the gold community the blood-relative link between GOLD and FOOD.
2. I’m talking about the markets, not the survival pouches of both gold and food, although that should not be ignored either. One of my richest paid subscribers, billionaire T-Rex, has been buying massive tracts of farmland over the past few years.
3. Jim “mighty man” Rogers has done the same, and Mighty Man calls the agricultural markets the best value in the world today.
4. Value plays are where all the real wealth is built, and food is right now the ultimate value play. The banksters understand this reality the best, and, not surprisingly, Elmer Fudd Public Investor has the lowest grasp of the concept, and the lowest wealth. Fudd, if you can believe it, is actually net short the food markets, with huge leverage, against the banksters into the recent lows. He’s burning on fire now. He “knew” the food glut would never end. He’s got it all backwards. Everything he does in the market is all-backwards, totally wrong in tactics, totally wrong in timing.
5. I emphasized the new horror reported on Bloomberg News, the new horror that Elmer Fudd Public Investor has been focused on buying the “principal-protected” derivatives products, a “growth with safety” scam hawked to him by the laughing banksters, after they blew him to kingdom come in the stock and real estate markets. Fudd hates value, and he hates patience. He responds, knee-jerk style, to whatever he sees in the market today or reads in the news. His “knowledge” that low rates are “here to stay” is a prime example of his micro-mind in action. He demands immediate investment satisfaction within his fantasy timeframe, and obviously that mindset is the sole cause of all his agony. Wealth is built with an understanding of TIME & VALUE. Respect time, and understand there’s a reason it’s called “Father Time”, not “My Personal Slave is called Time”. Professionals understand time rules them, not the other way round. Most investors want “the juice”. If a market offers 1000% gains, they want to leverage it to make 10,000%. This thinking is madness for anything but wild gambling money. What the banksters do, and the best hedge fund managers do, and this point is all-critical, what they do is they leverage consistency.
6. If somebody is gaining 5% a year with tiny drawdowns, there is vastly more opportunity in leveraging that performance, than trying to figure out that since gold could rise to $1500, if I leverage that 10 times over, I make $3000. That’s true, but if the item has volatility, I’m wiped out long before I make any $3000 an ounce.
….read points 7-24 of Gold, Food, & Oil Key Tactics
Gold Price Outlook
Gold has continued to set new records in the June 2010 Quarter, with an all time high (Comex close) of US$1,256.80 reached on 18 June 2010. Overall, the gold price finished the June quarter with a 13% rise. In the twelve months to June 30 2010 it was up by 34%.
Since the start of 2008, gold has stood head and shoulders above other major asset classes, appreciating by 49% while equity markets, the oil price, copper price (to name just a few) are still in negative territory over that period. Gold’s all time high on
18 June 2010 was US$1,256.80/ounce, and it finished the June quarter up 13%.
So how does one go about predicting the gold price from here?
….read more Market Forecast: Gold Price & Gold Stocks
The historian discusses the bond vigilantes, “Bond vigilantes are a bit like the people short selling investment banks a couple of years ago. You start with Bear Stearns and Lehman Brothers, you don’t get to Goldman Sachs until quite late in the game. In a way the sovereign debtors of the western world are pretty much in that position today. And we are working down the list, starting with Greece, moving on to Spain and Portugal, the UK dodged the bullet by implementing some preemptive measures. Sooner or later the bond vigilantes will get to the US, I don’t think it will be this year, but in the absence of any political will to address this problem, this is simply an inevitability.” As to why it is inevitable…..
….read more Niall Ferguson: If The Obama Administration Listens To Paul Krugman It Would Lead To An Imminent Debt Crisis
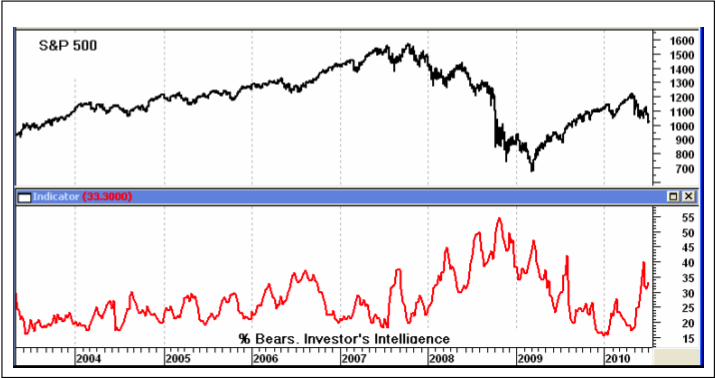
A LOT OF BEARS
Take a look at the chart below. The percentage of bearish advisors from Investor’s Intelligence recently achieved some rather high levels and from a contrary opinion standpoint, this should be a positive.
It’s not nearly as high as the levels achieved going into the March ’09 bottom, but that was a decline of historic proportions. Current levels are certainly lofty enough to power a multi week uptrend.
But will it? We have already seen the averages break below the level seen when the bearish percentage was around 40%. Again, we need to respect the “ultimate indicator” which is the price action itself.
But, we can use the old metaphor, gunpowder on the floor. All we need is a match to set it off. In market terms, we need a positive catalyst, but there are precious few of those currently.
THE DOW 10,000 BARRIER
I’m not a numerologist, but there does seem to be something about major round numbers for the Dow. The blue chip average first breached 10,000 in March of 1999 and everyone put on the Dow 10,000 hats. Since then, they’ve had to dust off those hats numerous times in both directions.
The same was true of Dow 1,000. It first breached this millennium figure in March of 1966, but it took another 16 years to finally move above this level for good.
And Dow 100? As near as I can make out, this level was achieved first in 1906, but it was 1924 before the centennial figure was overcome somewhat permanently. Of course, we lost that level again between 1931 and 1935.
If past is prologue, the preceding analysis suggests that we could hang around current levels for another 5 years or so. Of course, it’s dangerous to make projections based on only two previous occurrences.
Regardless, we should be able to make money by simply catching the swings or utilizing trading systems such as System 2. We go into more detail on this system and other trading developments on the last page of this letter.
To summarize, the market seems to be ignoring our normally reliable short and intermediate term oversold conditions along with short and intermediate term sentiment gauges.
As long as this condition persists, we have to fall back on the chart patterns and pay a lot of attention to the current pattern of descending tops and descending bottoms.
To read the whole 7 pages of this July 6th Newsletter subscribe online HERE or Contact HERE
Stephen Todd RANKED # 1 BY TIMER DIGEST
A Short Biography
Since 1984, the editor and publisher of the Todd Market Forecast, a monthly newsletter with emphasis on the stock market, but also with sections about gold, oil, currencies and bonds.
Steve spent a number of years as an engineer in a steel mill before becoming a stock broker with a number of Firms, including E.F. Hutton, Bache and Paine Webber.
He has published articles on the economy and the stock market in the following publications: Barron’s, Stock Market Magazine, Futures Magazine, The National Educator and others.
His stock market commentary is heard on CNBC, Bloomberg, Associated Press Radio, Business Radio Network, CKNW in Vancouver, British Columbia, KFWB, Los Angeles and ROBTV in Toronto, Ontario.
-
I know Mike is a very solid investor and respect his opinions very much. So if he says pay attention to this or that - I will.
~ Dale G.
-
I've started managing my own investments so view Michael's site as a one-stop shop from which to get information and perspectives.
~ Dave E.
-
Michael offers easy reading, honest, common sense information that anyone can use in a practical manner.
~ der_al.
-
A sane voice in a scrambled investment world.
~ Ed R.
Inside Edge Pro Contributors

Greg Weldon

Josef Schachter

Tyler Bollhorn

Ryan Irvine

Paul Beattie

Martin Straith

Patrick Ceresna

Mark Leibovit

James Thorne

Victor Adair