

A LOT OF BEARS
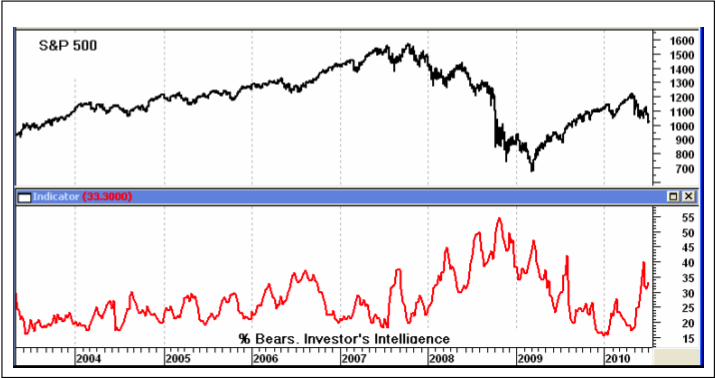
Take a look at the chart below. The percentage of bearish advisors from Investor’s Intelligence recently achieved some rather high levels and from a contrary opinion standpoint, this should be a positive.
It’s not nearly as high as the levels achieved going into the March ’09 bottom, but that was a decline of historic proportions. Current levels are certainly lofty enough to power a multi week uptrend.
But will it? We have already seen the averages break below the level seen when the bearish percentage was around 40%. Again, we need to respect the “ultimate indicator” which is the price action itself.
But, we can use the old metaphor, gunpowder on the floor. All we need is a match to set it off. In market terms, we need a positive catalyst, but there are precious few of those currently.
THE DOW 10,000 BARRIER
I’m not a numerologist, but there does seem to be something about major round numbers for the Dow. The blue chip average first breached 10,000 in March of 1999 and everyone put on the Dow 10,000 hats. Since then, they’ve had to dust off those hats numerous times in both directions.
The same was true of Dow 1,000. It first breached this millennium figure in March of 1966, but it took another 16 years to finally move above this level for good.
And Dow 100? As near as I can make out, this level was achieved first in 1906, but it was 1924 before the centennial figure was overcome somewhat permanently. Of course, we lost that level again between 1931 and 1935.
If past is prologue, the preceding analysis suggests that we could hang around current levels for another 5 years or so. Of course, it’s dangerous to make projections based on only two previous occurrences.
Regardless, we should be able to make money by simply catching the swings or utilizing trading systems such as System 2. We go into more detail on this system and other trading developments on the last page of this letter.
To summarize, the market seems to be ignoring our normally reliable short and intermediate term oversold conditions along with short and intermediate term sentiment gauges.
As long as this condition persists, we have to fall back on the chart patterns and pay a lot of attention to the current pattern of descending tops and descending bottoms.
To read the whole 7 pages of this July 6th Newsletter subscribe online HERE or Contact HERE
Stephen Todd RANKED # 1 BY TIMER DIGEST
A Short Biography
Since 1984, the editor and publisher of the Todd Market Forecast, a monthly newsletter with emphasis on the stock market, but also with sections about gold, oil, currencies and bonds.
Steve spent a number of years as an engineer in a steel mill before becoming a stock broker with a number of Firms, including E.F. Hutton, Bache and Paine Webber.
He has published articles on the economy and the stock market in the following publications: Barron’s, Stock Market Magazine, Futures Magazine, The National Educator and others.
His stock market commentary is heard on CNBC, Bloomberg, Associated Press Radio, Business Radio Network, CKNW in Vancouver, British Columbia, KFWB, Los Angeles and ROBTV in Toronto, Ontario.