
Daily Updates
Over the past few years, I have warned my subscribers that the Dow Jones Industrials (DJI) — in real terms — had already lost over 80% of its value, when measured from its real, inflation-adjusted high of 14,198 in October 2007.
This Video Took Only Four Different Shots – 1000 People Invited to Partake NO EDITING – AMAZING
House Prices in Free Fall
The latest house price data (the S&P Case-Shiller index) shows a clear downward trend for the most recent six months, as shown in the graph below:
The next graph shows how this year’s data fits in with the long-term trend. It is clear that the house price bubble, which began in 1997 and peaked in 2006, has not yet finished popping:
How we Got There
The black stars in the above graph highlight 1951 and 1997, the two years when Congress changed how the capital gains tax applies to home sales. The first change produced 46 years of wealth accumulation. The second change produced 9 years of rising house prices and living beyond our means to be followed by about 9 years of belt tightening and economic stagnation.
In 1951, Congress, at the urging of President Truman, instituted the roll-over treatment for taxation of capital gains from home sales, an economically sound treatment of capital gains. As a result, from 1951 through 1997, whenever a homeowner sold his or her primary residence to buy another residence, the capital gains tax was deferred, not forgiven. In technical parlance the gain was rolled-over until the new home was sold. Homeowners would typically build up their equity in one home, sell that home, and then use their savings to make a down payment on a larger home. During that period, there were large changes in interest rates, yet real home prices were quite stable.
In 1997, a foolish Congress, at the urging of a foolish President Bill Clinton, eliminated the capital gain tax on homes sold by most homeowners. This change immediately stimulated the housing price bubble. It told speculators that the capital gain that they would earn would be tax free if they bought a house in the expectation of a rise in its market value and sold it at a higher price. Under the new provision, almost anyone who had lived in a house for 2 years of the past 5 years could sell the house free from capital gains tax. The new policy encouraged people to gamble on real estate. They saw that houses were going up in price year after year. What an easy way to make money!
…..read more HERE (scroll down)
John Taylor, CEO of FX Concepts, a currency trading firm with $8 billion under management says “We’ll be in a recession by the end of the year. Three reasons: QE2 will end, Republicans are running the House, and the price of gas is heading up.”
Taylor also takes a look at global currency programs in foreign exchanges and he also discusses the problems facing the ECB.
Eurozone Interest Rates Taylor thinks interest rates should be 5% in Germany and 0% in Greece but that is impossible. I don’t know where they should be because rates should be set by the free market not a bunch of central planners. Moreover, it was government bureaucrats not the free market that created an EU currency union with no fiscal controls on individual countries..
I believe there is no correct solution as to where rates should be. Some countries will be on the short end of the stick regardless of what the ECB does.
Recession Odds Depend on Definition If one defines a recession as measured by 2 consecutive quarters of negative GDP it is possible but highly unlikely. Taylor does think we see two consecutive quarters of negative growth. On that I disagree.
However, the NBER, the official arbiter of recessions, does not define recessions that way. The NBER looks at a range of factors and pegged the last recession as starting in November 2007, well before there were two quarters of negative growth.
Regardless, I think a significant global slowdown is coming and a reasonable chance we see a recession in 2012 heading smack into the next presidential election.
Those waiting for a fully inverted yield curve signal or even a 2-year treasury inversion with the 10-year treasury will not get a signal because the Fed has the short-end of the curve artificially pegged at zero percent while the long-end of the curve is pressured by huge budget deficits.
However, we could see inversion on parts of the curve. For example 2-year treasuries could invert with 3-year treasuries, 5-year treasuries with 7-year treasuries, or 7-year treasuries with 10-year treasuries. The current spreads are 53 basis points, 32 basis points, and 61 basis points respectively. The one to watch closely is the 5-year to 7-year spread.
Mike “Mish” Shedlock
http://globaleconomicanalysis.blogspot.
Click Here To Scroll Thru My Recent Post List

A number of forces continued to push oil prices higher last week, reaching their highest levels in the U.S. since September 2008.
One factor fueling the run has been the continued decline of the U.S. dollar. You can see from the chart that oil and the dollar historically are negatively correlated. This means that a rise in oil prices generally coincides with a decline in the dollar, and vice versa. The U.S. dollar has seen a dramatic decline since the beginning of the year as oil prices have moved some 30 percent higher. This could be due to fact that roughly two-thirds of the U.S. trade deficit is related to oil imports.
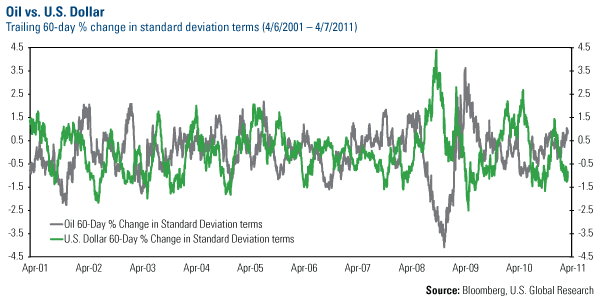
Despite the run up, oil’s upward rate of change is still within its normal trading pattern over the past 60 trading days. Accordingly, this may imply that it isn’t a spike and we haven’t crossed into the extreme territory like we experienced in 2008 and 2009.
Conversely, oil prices are positively correlated with gold prices, which also saw a bounce this week. Looking back over the past one- and 10-year periods, oil and gold have roughly a 75 percent correlation. This means that three out of four times, when prices for one go up, prices for the other increase as well.
Another factor pushing prices higher is the seasonal strength that oil prices historically experience leading into the summer driving season. This chart shows the five-, 15- and 28-year patterns for oil prices. You can see that prices historically bottom in February before rising through the end of the summer.
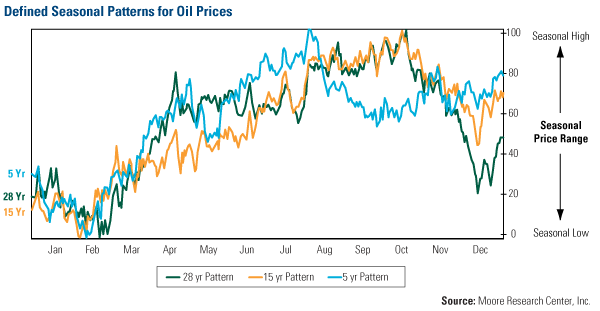
We discussed in detail how these seasonal factors affect oil prices a few weeks ago.
Rising oil prices are also a result of what the Financial Times calls the “new geopolitics of oil.” The FT says three elements creating this new environment are becoming clear:
1. Young populations with high unemployment rates and a skewed distribution of income are a volatile combination for the people in power.
2. To placate these groups, oil-producing countries are increasing public expenditures.
3. Governments are also to extend energy subsidies to shelter the country’s consumers from rising energy prices.

A Deutsche Bank chart plots the share of population under the age of 30 for selected North African and Middle Eastern countries against the unemployment rate of this group. You can see that large oil producers such as Saudi Arabia have a high level of unemployment among youth populations.
This is why King Abdullah of Saudi Arabia has announced a total of $125 billion worth (27 percent of the country’s GDP) on social programs for the public. For King Abdullah, this is the cost of keeping peace but has driven up the breakeven price for Saudi oil production to $88 per barrel, according to the FT.
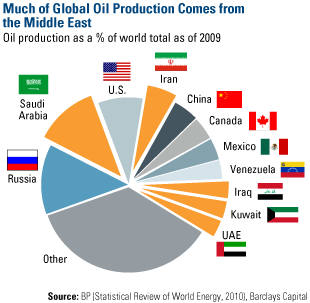
Keeping these young populations happy and working is not only domestically important for these governments but for global oil markets as well. You can see from this chart that a significant portion of the world’s oil production comes from the Middle East.
With the unrest in Libya—a top-20 oil producer—essentially knocking out the country’s entire production, any further unrest in another country could threaten global supply. Upcoming elections in Nigeria have the potential to disrupt production for the world’s fifteenth-largest producer.
But it’s not just geopolitics that is threatening production. Natural decline rates from mature fields such as Mexico’s Cantarell oil field are starting to make a dent in global production. Reuters reported this morning that Norway, the world’s eleventh-largest oil producer, is experiencing a significant slowdown in production from the Oseberg oil field in the North Sea. Production is expected to be cut by 26 percent in May to only 118,000 barrels per day.
Meanwhile, oil demand has been picking up significantly in both emerging and developed markets. Oil demand in China and the U.S. has been rising since mid-2009, well before the uprisings began in the Middle East.
In China, a big driver has been growth in the Chinese automobile market. Auto sales increased 2.6 percent in February, and March data released by the Chinese Auto Association over the weekend shows auto sales grew 5.36 percent on a year-over-year basis in March.
The G7 economies have been in an up cycle since last year. In the U.S., employment rates and consumer spending have been steadily improving. Oil prices rising too fast remains a threat to this recovery but BCA Research estimates that oil prices need to rise above $120 per barrel before “significantly undermining consumer and business confidence.”
By Frank Holmes
CEO and Chief Investment Officer
U.S. Global Investors
http://www.usfunds.com/
rgeorge@usfunds.com
April 13th, 2011
Frank Holmes is CEO and chief investment officer of U.S. Global Investors, Inc., a boutique investment advisory firm based in San Antonio that manages domestic and offshore funds specializing in the natural resources and emerging markets sectors. The company’s no-load mutual funds include the Global Resources Fund (ticker PSPFX), which invests primarily in energy-related stocks.
For more insights and perspectives from Frank Holmes, visit his investment blog “Frank Talk” at http://www.usfunds.com/investor-resources/frank-talk/.
Please consider carefully the fund’s investment objectives, risks, charges and expenses. For this and other important information, obtain a fund prospectus by visiting www.usfunds.com or by calling 1-800-US-FUNDS (1-800-873-8637). Read it carefully before investing. Distributed by U.S. Global Brokerage, Inc.
All opinions expressed and data provided are subject to change without notice. Some of these opinions may not be appropriate to every investor. Foreign and emerging market investing involves special risks such as currency fluctuation and less public disclosure, as well as economic and political risk. Because the Global Resources Fund concentrates its investments in a specific industry, the fund may be subject to greater risks and fluctuations than a portfolio representing a broader range of industries.
-
I know Mike is a very solid investor and respect his opinions very much. So if he says pay attention to this or that - I will.
~ Dale G.
-
I've started managing my own investments so view Michael's site as a one-stop shop from which to get information and perspectives.
~ Dave E.
-
Michael offers easy reading, honest, common sense information that anyone can use in a practical manner.
~ der_al.
-
A sane voice in a scrambled investment world.
~ Ed R.
Inside Edge Pro Contributors

Greg Weldon

Josef Schachter

Tyler Bollhorn

Ryan Irvine

Paul Beattie

Martin Straith

Patrick Ceresna

Mark Leibovit

James Thorne

Victor Adair