

Ancient Dollars and Gold Bullion
08/01/2018 3:25 PMConsumer price inflation is real. It sneaks into every facet of life. Bags of coffee shrink from 16 ounces to 12 ounces and then to 10 ounces. “Shrinkflation” is policy. That Snickers candy bar is smaller but costs the same or more.
But don’t blame the candy industry, coffee distributors or automobile manufacturers. Fiat currencies create the problems.
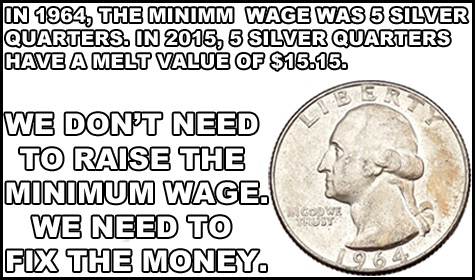
Why do we need to fix our currency? Because commercial banks (via fractional reserve banking) and the Federal Reserve print dollars by the trillions, devalue all existing dollars, and increase prices on almost everything. Do you remember McDonald’s prices in 1961?


The problem is the currency unit. It shrinks in value! read more

What Does It Take to Be in the Top 1 Percent? Not As Much As You Think
08/01/2018 2:32 PMWhen you think of the top 1 percent of all income earners in American households, how much do you think this group rakes in? Millions? Tens of millions? What about the top 10 percent? On the contrary, to be considered in the top 1 percent of taxpayers US nationally,...
read more
Great news for bulls: The stock market just did something it hasn’t done in 60 years
08/01/2018 2:31 PM Jeffrey Saut, chief investment strategist at Raymond James, a widely followed strategist and an unwavering market bull, made two very critical observations Tuesday that are likely to reverberate for stocks going forward.
One, the stock market just made a positive move that has not happened since 1958, the same year that NASA was born and President Dwight Eisenhower, a Republican, was in the White House. Two, Democrats are likely to fail in their effort to retake the Senate and may even fall short in the House this fall.
After a fairly rocky month, stocks closed out July with solid gains, extending the S&P 500’s SPX, +0.28% winning streak to four months. Historically, when the market gains in April, May, June and July of midterm election years, the market has finished higher in that year, according to Saut.
“The history of midterm election years is that stocks become dicey in August, but tend to rally as we approach the midterm elections,” said Saut, in a note. “Also worth a mention is that going back decades shows that when the stock market is up in April, May, June and July in midterm election years, in the two years that has happened (1954 and 1958), after an August Angst moment, stocks have finished the year stronger.”
The S&P 500 was up 0.3% in April, 2.2% in May, 0.5% in June and 3.6% in July. The large-cap index jumped 45% in 1954 and rallied 38% in 1958. So far this year, the benchmark has risen 5.3%.
Even without the added boost from politics, stocks almost always gain in years when the market finished higher between April and July, according to Paul Hickey, an analyst at Bespoke Investment Group.
But perhaps the most interesting nugget in Saut’s report is that he doesn’t expect the Democrats to retake the Senate, and even their ability to recapture the House is uncertain.
read more
Why Do We Put Up With It
08/01/2018 1:50 PMPoliticians don't want to take on the Public Sector Unions or a bureacracy that fights any effort to increase accounability. So we have a system of Government that doesn't set goals, won't measure performance or assign responsibility. A system that history has shown...
read more
And Then There Were None
07/31/2018 6:44 PMBy simply looking at the returns of the S&P 500 in the first half of 2018, one could be forgiven for thinking returns were decent and that markets were uneventful. by the close of the books in June, the S&P 500 managed a price gain of 1.7% or 2.6% including dividends....
read more
Support Is Growing For Bitcoin ETF
07/31/2018 6:34 PMAs things stand, the bitcoin ETF is widely considered to be the biggest news story in the cryptocurrency industry this year. We have recently seen a decision on the Direxion Investments ETF’s announced for some time in September, while Bitwise Asset Management has...
read more
New York Evicts Internet Provider For High-Speed Failure
07/31/2018 6:30 PMThe State of New York is moving to evict its largest internet and cable provider for failing to deliver on fast connection promises that had won it approval two years ago for a merger with Time Warner Cable. The deal was that rural areas would get high-speed internet...
read more“US Stock Market Danger & Golden Goodies”
07/31/2018 3:04 PMJuly 31, 2018
1. Under Trump, it can be argued that the US economy (which is separate from the Wall Street casino) is experiencing a degree of normalization.
2. Top economists give him credit for corporate tax cuts and deregulation. At the same time, the US central bank is also pursuing a policy of normalization that began with Yellen.
3. As I predicted, this normalization has seen the stock market begin a topping process while inflationary pressures become more evident. This topping process will now accelerate, as will the inflationary pressures.
4. Please click here now. Double-click to enlarge this disturbing weekly Nasdaq100 index chart.
5. Note the ugly non-confirmation taking place between the RSI oscillator and the price. For decades I’ve urged investors to hedge themselves or sell as the US stock market “crash season” begins at the start of August. It lasts until the end of October, and I recommend rebuying then. Please click here now. As stock market heavyweight Mike Wilson notes in his interview yesterday, the US stock market selling has just begun!
6. While US stock markets are set to swoon and perhaps crash, the rise of China/India and the normalization of America is producing a new era for gold. The wild fear trade of the past is being superseded by a theme of general respect for the asset.
7. Chinese and Indian gold investors do invest in the global fear trade for gold. That’s a big part of why they buy, but their understanding of gold is highly refined. Their analysis is wise and subtle.
8. The growing dominance of Chindians in the market is producing a much calmer investing experience for Western investors who are feeling this wonderful golden vibe!
9. Please click here now. Next, please click here now. Out with the old (fear trade of the West), and in with the new (love trade demand of the East)!
10. To Vanguard’s credit, I will note that it is restructuring its fund to gain exposure to the general equity markets, but with a commodity-oriented theme.
11. Official Indian imports would be over 1000 tons for fiscal 2018 if the rupee had not been temporarily derailed. If free (black) market demand is included, the total imports are probably in the 1200 – 1300 tons area.
12. Please click here now. It’s a bird! It’s a plane! It’s the gold bull era’s superman! Since being appointed as “interim” finance minister of India, Piyush Goyal is pumping out so many pro-citizen and pro-business tweets and announcements that he makes Donald Trump look like a turtle swimming through a pool of end of empire molasses, and Trump himself can be considered a pro-business racehorse!
13. If Goyal continues to reduce the drag of government on citizens and businesses, my prediction that India will hit 10% GDP growth and 1500 tons of total annual gold demand in the next 18 months will likely become a “done deal”.
14. To view what may be the world’s most important chart, please click here now. Double-click to enlarge. Gold stocks have surged against gold and held their ground against US fiat while bullion has fallen about $170 an ounce!
15. While earnings, AISC, and cash flow numbers have turned negative for many gold miners, most of them continue to look good against gold and are holding their recent lows against the dollar.
16. GDX would likely be trading around $10 a share right now if institutions were buying or selling just based on earnings and other financial reports about the component companies.
17. Please click here now. Why is this strange price action happening? Why is GDX trading above its February low even though gold has moved so much lower?
18. Well, the most reasonable explanation is that savvy institutional power players are looking beyond the short term earning hits. They are focusing on the rise in inflation in the West.
19. This interesting gold market action is occurring just as the horrific action of the main US stock market sectors begin to suggest that general equities are already in a rolling bear market and poised to begin something much more sinister.
20. The US stock market could soon become an inflation-oriented quagmire that would greatly resemble the markets of the 1970s.
21. Please click here now. Double-click to enlarge this gold chart. Gold is oversold, but the 14,3,3 Stochastics series is flatlining.
22. This tends to happen when investor sentiment becomes weak but physical demand in China and India has yet to strengthen. It creates an incentive for smart commercial traders on the COMEX to cover short positions but not to buy many longs.
23. Please click here now. Double-click to enlarge another great gold chart. From both a fundamental and technical perspective, nothing is happening in the gold market that is unexpected.
24. If the current gold price sale ends in the $1200 – $1180 area it would give the right side of the huge inverse head and shoulders pattern almost perfect symmetry with the left side. The personnel changes in India’s finance ministry and the rise of inflation in America (as the stock market peaks) are fundamentally in tune with the big picture technical action for gold. A joyous bull era is poised to begin, with good times for all gold investors!
Thanks
Cheers
St
read more
Canada’s House Price Bubble Has Been Softening Everywhere But Vancouver And Victoria
07/31/2018 3:00 PM“Five of the 11 markets reached a new high in June: Vancouver, Victoria, Montreal, Halifax and Ottawa-Gatineau. The market furthest from its previous peak was Toronto, down 4.8% from its reading of last July…Over the first half of the year (2018) the Toronto index...
read more
Risk Appetite Wanes As Small-Caps’ Trend Ends And Funds See Outflows
07/31/2018 2:41 PMThis is an abridged version of our Daily Report. Lack of risk appetite Discretionary stocks are at a multi-month low relative to defensive Staples. That sign of risk-off behavior is unusual with the S&P near a high but has not been a good excuse to sell stocks....
read more


