
Uncategorized
Often considered the “poor man’s gold” silver has been climbing the investment and demand charts since its discovery thousands of years ago in Anatolia, now modern day Turkey. Silver’s unique properties make it ideal for thousands of applications found in every day life.
Silver is:
The best conductor of electricity of all metals
The best conductor of heat of all metals
The most reflective of metals
A powerful anti-bacterial & anti-viral agent
Malleable and ductile
Valued for its beauty
Silver is found today in mines around the world; the top producing mining countries are Peru, Mexico and China.
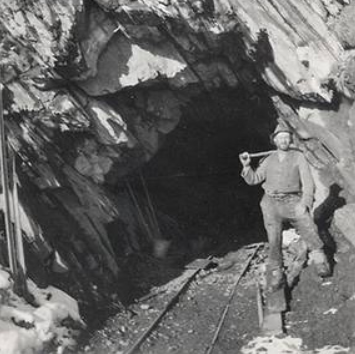
HISTORY OF SILVER MINING
3000 BC The first major silver mines were discovered in Anatolia, modern day Turkey.
1st C. AD Roman discoveries developed Spain into a major silver producer.
Early 1500s After Columbus’ New World expeditions, the discovery of huge, prolific silver deposits in Mexico, Peru and Bolivia changed the focus of silver mining and enriched the Spanish Empire for 300 years.
1500 – 1875 Approximately 1.5 billion ounces mined in Mexico with the majority produced during the 1700’s. 1700s The backbone of the Spanish Empire was the
one billion ounces of silver produced from Veta Madre (The Mother Vein) in Guanajuato Mexico (Endeavour Silver has mines hosted in the Veta Madre) .
1857 Silver mining became an important industry in the State of Nevada (The Silver State) when the fabled Comstock Lode was discovered.
1859 – 1877 Comstock yielded silver and gold with a value aproaching $400 million, the equivalent of more than $500 billion today.
1900 – 1920 50 per cent expansion in global production to about 190 million troy ounces annually spurred by discoveries in several countries including Canada, the United States and Mexico.
1921 – Present Improved techniques in ore separation allowed for concentration of silver with lead, zinc and copper. The explosion in production of these various base-metal sources has led to an increase in both silver output and silver usage. 3000BC – Present All the silver ever mined would fit in a 55 metre cube.
3000BC – Present All the silver ever mined would fit in a 55 metre cube.
HISTORY OF SILVER AS CURRENCY
CA 2500 BC Silver first introduced into Egypt and was considered more valuable than gold.
475 BC China was the first country to monetize silver.
775 AD “British Pounds Sterling”: in approximately 775 AD the Saxon kingdoms issued silver coins known as “sterlings”, 240 of them being minted out of one pound of silver. Large payments were reckoned in “pounds of sterling” later shortened to “pounds sterling.”
1072 After the Norman Conquest, the pound was divided for simplicity of accounting into 20 shillings and 240 pence or pennies.
1497 Spanish “Pieces of Eight” were coins first struck in 1497 containing a high silver purity and weight. They were the basis of the monetary system of the Spanish Empire and were widely circulated around the world. They were accepted as legal tender in the US until 1857.
1600’s – 1900’s The Mexican Peso evolved into one of the world’s strongest and most widely accepted currencies due to its silver content.
1800s By the mid 1800s, China through trade and mercantilism, was in possession of 50% of the world’s above ground silver. The British sold opium to China in exchange for tea, silk and silver – a factor in the Opium Wars between Great Britain and China during the mid -1800s.
1930s Silver was used as China’s official currency until the 1930s.
SILVER APPLICATIONS
Industrial:
As the best conductor of electricity, silver has a multiple of uses in switches, contacts and fuses in electrical appliances, automobiles and electronics such as computers, TV’s, DVD + CD players and cell phones.
Chemical reactions use silver as a catalyst; approximately 700 tons of silver are consumed annually in the production of plastics. Mitsui of Japan is developing a catalytic converter for diesel engines using silver as opposed to platinum or palladium.
Billions of silver oxide-zinc batteries are produced annually for use in watches, cameras and small electronic devices.
Invisible silver is a thin coating of silver on double thermal windows. This coating not only rejects the heat from the sun, but also reflects internal heat inward.
As the most reflective of metals, silver is used in specialized optical devices, automobile windshields and for both commercial and household mirrors.
Very little silver used in industrial applications is re-cycled, it is consumed.
Health:
Hippocrates, the father of modern medicine, wrote that silver had beneficial, anti-disease properties.
Wealthy, ancient Greeks, Romans and Phoenicians stored their wine, water and oil in silver jugs to maintain their freshness and prevent spoiling.
Silver compounds show a toxic effect on some bacteria, viruses, algae and fungi. Health and medical applications of silver are wide ranging and its uses include dressings and ointments for burns and wounds, anti-bacterial pharmaceuticals, coatings on hospital implements and surfaces, to name a few.
Silver is being used to treat wastewater and to treat streams containing radioactive and biological contaminants.
Silver is increasingly being used for water purification and as an anti-bacterial agent in swimming pools.
Clothing is being manufactured with silver impregnated fabric to kill bacteria and fungi in order to reduce disease and odour. Military uniforms, sporting wear and everyday clothing are now produced that contain this special fabric.
Recent research shows that silver also promotes the production of new cells, increasing the rate of healing wounds and bone.
Alexander the Great was advised by Aristotle to store boiled water in silver containers to prevent diseases caused by contaminated water
ANNUAL USES OF SILVER
2008 % of Total Use
Jewerly and Silverware 261.0 37.7 %
Photography 140.7 20.3 %
Electronics and Batteries 123.4 17.8 %
Brazing Alloys/Solders 51.6 7.4 %
Coinage 28.2 4.1 %
Super Conductors 18.0 2.6 %
Mirror 11.3 1.6 %
Caustic Silver 7.2 1.0 %
Tube, Sheet and Bar 6.3 0.9 %
Biocides 6.0 0.9 %
Miscellanous 39.5 5.7 %
“Gold is the sweat of the sun, silver is the tears of the moon”
Inca proverb
History of Silver contributed by Hugh Clarke, VP Corporate Communications Endeavour Silver Corp. www.edrsilver.com
{mov}promo-videos/may31{/mov}
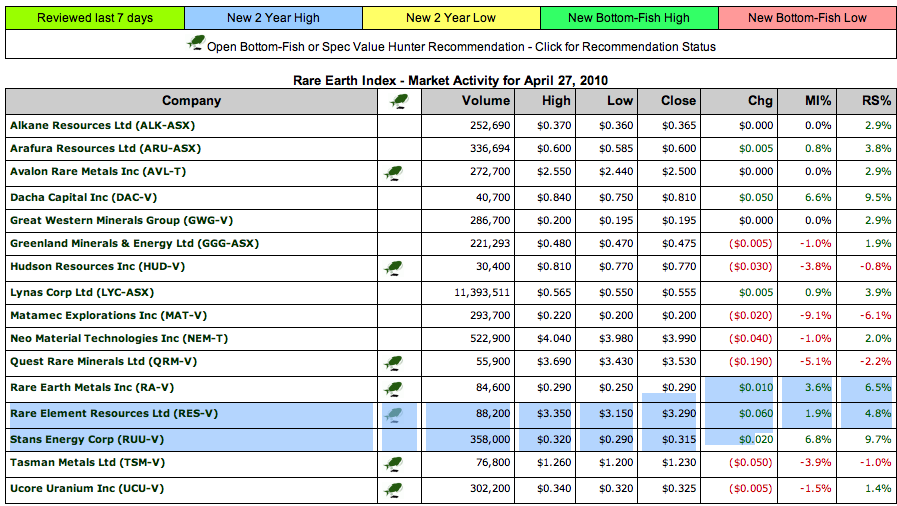
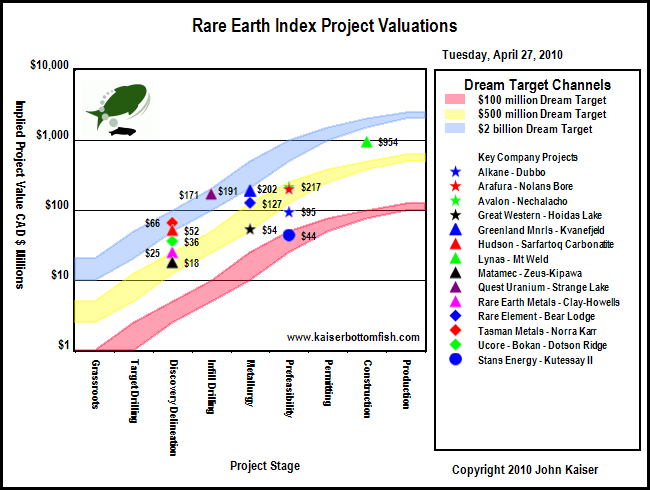
The KBFO Rare Earth Resource Center is designed to help investors get acquainted with the rare earth sector, track the KBFO Rare Earth Index, and get quick access to rare earth related articles published on Kaiser Bottom-Fish Online. The Rare Earth Index consists of Australian and Canadian stock exchange listed companies with advanced rare earth deposits or downstream processing operations. Details are available through our KBFO Members Only Rare Earth Index report. For a general overview of the logic driving Rare Earth Mania see Making Sense of the Emerging Rare Earth Mania posted on ResourceInvestor.com. Most people, however, still think the fuss about rare earths is little more than yet another commodity bubble (Economist: The hunt for rare earths – Oct 8, 2009.
Ed Note: for larger charts go HERE
Ed Note: for all larger charts as below go HERE
Rare Earth Production and Global Resource Base
The Global REO Production chart above based on USGS estimates for 2009 paint a grim portrait of China producing 97% of all rare earth oxides, with the remainder from India, Brazil and Malaysia produced in the form of monazite based heavy mineral sands. The other chart suggests that more than half the world’s resource base exists outside of China.
….continue reading and view 18 more charts in the last 2/3rds of the article HERE
Thank You we have received your message! Click here to go to our home page or click here to read our daily updates.
| Price | Description | Access to Michael Campbells Portfolio Updates | Purchase ticket |
| $0.01 | Michael Campbells Portfolio Updates | {aecaddtocart plan=23 Itemid=217 usage=23 returngroup=0} |
{portfolioupdatesurl image= images/stories/modules/pu_mc.jpg}
-
I know Mike is a very solid investor and respect his opinions very much. So if he says pay attention to this or that - I will.
~ Dale G.
-
I've started managing my own investments so view Michael's site as a one-stop shop from which to get information and perspectives.
~ Dave E.
-
Michael offers easy reading, honest, common sense information that anyone can use in a practical manner.
~ der_al.
-
A sane voice in a scrambled investment world.
~ Ed R.
Inside Edge Pro Contributors

Greg Weldon

Josef Schachter

Tyler Bollhorn

Ryan Irvine

Paul Beattie

Martin Straith

Patrick Ceresna

Mark Leibovit

James Thorne

Victor Adair