
Uncategorized
The Nature of U.S. Investors
The U.S. is a world of well educated, highly sophisticated investors who use an extraordinary well developed set of markets through which to invest into every item that has a market and usually at prices that attract the world of buyers to the oil market, currencies equities bonds and the rest.
In the U.S. gold markets investors can buy the shares of gold mining companies, get options to buy these shares, buy the Indices that track these shares, buy gold coins, gold bullion, buy the shares of gold Exchange Traded Funds, buy gold futures through COMEX and more still. Indeed the variety of different types of investment channels and their markets leads you to believe that the U.S. must be the heart of the world of gold. In terms of volumes of money that surely must be the case. This would be true if they all affected the gold price directly. Do they?
Where are the main Gold Markets and which ones affect the Gold Price?
Cutting to the chase, the only markets that do affect the gold price are those where gold bullion is bought and sold. These are physical gold markets. They can be as far apart as Shanghai, Mumbai, Dubai, London, Zurich, New York, etc. Jewelry markets use physical gold and these are world wide. Industrial markets are smaller and spread across the globe.
Central banks hold physical gold alongside individual investors, all over the world. All these markets follow the same route to physical gold as each other. All of them go to a local wholesaler, where small amounts are involved. These wholesalers may be banks or maybe just wholesalers or large jewelers that supply smaller ones, having the advantage of bulk buying. These larger buyers go, in turn, to their main local importers. Local importers go to gold dealers or if large enough direct to the bullion banks. The largest buyers go direct to the London Bullion banks.
Refiners may receive their gold from scrap sales of from the gold mines direct, refining it to the highest Standards of the LBMA [The London Bullion Market Association]. It is then eligible for sale though the London Fixing.
All the above markets directly affect the gold price.
It may come as a surprise to you that the U.S. is not the place where the heart of the gold market lies. This happens in its traditional center in London.
The Gold Fixing
The two Gold Fixings are the most important [www.goldfixing.com] events in the daily world of gold. At the Fix, five Bullion banks buy and sell gold at two points in the day, at 10.30am and at 3.30 pm. At these “Fixing” sessions, the five banks representatives face each other in small neat room. There, they are linked to their own banks by phone. In turn, these banks are linked into their customers by phone and often their customers are linked by phone to their own customers. Offers and bids are put forward at different prices, then adjusted and readjusted by all involved until a consensus is reached on price and volumes. This price is then “Fixed” and all transactions involved are established at that price. This takes care of over 80% of gold deals in physical bullion, often as much as 90%.
It is from here that coins are made and find separate markets.
Gold Exchange Traded Funds.
A major link between the physical gold world and the paper gold world is via the recently developed gold Exchange Traded Funds. Initiated by the World Gold Council but largely handled by HSBC, [one of the five London gold bullion members of the Gold Fixing] shares are bought in these funds. These funds take the proceeds and invest in actual gold bullion, usually bought through the Fix in London. Of course when one buys “loco London” delivery can be made in another part of the world. Unlike buying shares in gold mining companies, buying these shares precipitates the buying of gold. So effective is this translation of paper gold into physical gold that over 1,400 tonnes of gold has been bought through these funds. This places their holdings larger than China’s or Switzerland.
The largest of these gold Exchange Traded Funds is in the U.S. called the SPDR Gold Trust. This holds nearly 1,300 tonnes of gold. Investors in these shares come mainly from the U.S. The force that these investors gave to the gold price was substantial and their buying at that time was the main gold price driver as the holdings rose. But this amount has hardly grown this year as asset managers [according to HSBC gold dealers] are fearful of the confiscation of gold by the U.S. government. It appears that these buyers now hold their gold outside the U.S. in the hope that this will avoid any confiscation [more on this in future issues of the Gold Forecaster]. So any force that the investors from the U.S. have on the gold price does not appear to be present now nor has it been for the last few months. In the present run up to $1,360 these investors have been overall sellers of gold. This has taken away the driving force of U.S. investors in the gold market.
Paper Gold Markets which do not affect the gold price
COMEX
We confirmed with officials on COMEX [the Commodity Exchange in New York] where it appears huge volumes of gold changes hands that between 1% and 5% of all transactions there involve physical gold. To emphasize the point, this means that between 95% and 99% of all Futures, and Options trading on COMEX do not involve gold itself. This is a financial market. Its key function is to allow those in the gold market to cover their exposure to physical positions in gold with a financial ‘insurance’ against price fluctuations.
There are very large positions in futures and options [the net speculative long position on COMEX is over 1,000 tonnes] but these are unwound before a delivery has to take place. For those positions where the buyer wants to take delivery, he has to notify the seller well in advance. So of this 1,000 tonne position only between 10 and 50 tonnes will involve the delivery of physical gold. This is a tiny amount relative to the London Bullion Market.
Gold Mining Company Shares
These are simply equities the same as any other traded worldwide in equity markets. They carry the same corporate risks as any company shares. Where they are different is that their income over the quarter, half or full year is linked to the average gold price over that time. Hopefully shareholders will benefit from both capital appreciation and a dividend flow as the gold price rises. The income from the sale of gold by these miners will rise with the average gold price and from the point that costs are covered company profits will rise at a higher rate than the gold price rises.
Additionally it is hoped that even when the gold price were to remain static, increasing proven gold reserves adds to the amount of gold the company can produce for the benefit of the shareholders. This, again, can make the right gold shares outperform the gold price. One has to have done ones’ homework carefully on each gold mining company before you can be sure that this will happen in any particular share.
What is irrefutable is that when you buy the shares of these gold mining companies, your investment will not affect the gold price whatsoever. The huge volumes of investors money does no more than ensure that gold will be mined. With the supply of gold now relatively price inelastic, we see such investments as unlikely to affect the gold price directly any time in the future.
Who then is driving the gold price?
With U.S. investors in the SPDR Gold Trust currently holding the gold they have and not investing at the moment, the force that U.S. investors have had on the gold price through the physical buying of gold is absent from the gold market.
If U.S. investors are buyers at the moment, they have taken their money overseas to buy gold and hold it there.
We can conclude that U.S. investors are not the driving force behind the gold price breaking new records. But the gold price has been hitting new record highs in the last couple of weeks, so who or what is the driving force behind the rise in the gold price now?
Author: Julian D. W. Phillips
“Global Watch: The Gold Forecaster” covers the global gold market. It specializes in Central Bank Sales and details, the Indian Bullion market [supported by a leading Indian Bullion professional], the South African markets [+ Gold shares shares] plus the currencies of gold producers [ Euro, U.S. $, Yen, C$, A$, and the South African Rand]. Its aim is to synthesise all the influential gold price factors across the globe, so as to truly understand the global reasons behind the gold price.
FIND OUT MORE
…..read it all HERE
WHITHER THE GOLD PRICE? That all depends on another question: Whither the global economy? If “to hell in a handbasket” is your answer, then go for the gold: A price of $2,000 an ounce or more, versus the current $1,345.90, looks quite plausible under those circumstances.
The Barron’s outlook, by contrast, might disappoint the most fervent bulls. Assuming that panic about the global economy will begin to subside to mere gut-level fear of the chronic sort, the bull market in gold that began in 2005 will slow its pace in the next few years. By 2015, the average annual price of gold could be $1,500 an ounce, albeit with plenty of fluctuations around that average.
Gold bulls, including gold-fund manager John Paulson, foresee much higher prices for the yellow metal.
….read more HERE
A lot of my old subscribers are sort of “zonked”. These are the boys and girls who had the courage to go along with me when I said, “Buy gold” back in the years around 2000. At that time gold was in the dumps, and gold mining shares were selling like discarded old shoes. Gold was selling in the 250 to 275 range, and at that time, buying gold was akin to buying Smith Corona typewriters today.
Nevertheless, I was able to cajole a percentage of my subscribers into buying gold shares and even some gold coins. After that, I went on a campaign of begging my subscribers to buy gold coins and sit with them. Coins are a pain in the neck to trade, and once holding coins, I discovered that few people play “in-and-out” games with them. For one thing, carrying 100 or so gold coins to the dealer requires a strong leather satchel and a muscular arm. Happily, it’s not a task designed for everyone. Easier to store your gold coins away and then leave ’em alone.
At the time when gold was around 260, my thinking was that at worst, gold should correct back halfway to its old 1980 high at 850. That would mean a rise from roughly 250 to 550, a profitable climb by any reckoning.
It took me a while to realize that gold had entered a new primary bull market, but when gold recorded a new high in each successive year it dawned on my tired brain that instead of a correction, gold was, indeed, in a new primary bull market.
My policy (call it a strategy) since 1990 was to beg, urge, cajole, encourage my subscribers to buy gold. This became easier with the advent of all the new exchange traded funds along with the rise of GLD, GDX, GDXJ, SGOL and so forth.
At the beginning of this site I stated that some of my old subscribers are “zonked” at what has happened to their early investments. These people have seen their original investments mature to the point where their early gold investments have become serious money, even retirement money. To my great pleasure, I’ve received e-mails from subscribers who tell me that my advice on gold has changed their lives. And I think to myself, “Ah, at least my stay on this green earth has done some good.”
The only thing better than keeping my subscribers out of a costly bear market, is to be able to steer them towards a life that is without money worries.
Richard Russell has made his subscribers fortunes. One of the best values anywhere in the financial world at only a $300 subscription to get his DAILY report for a year. HERE to subscribe. Amongst his achievements Richard was in cash before the 2008/2009 Crash and he has been Bullish Gold since below $300
Equityclock.com is offering free access to a data base showing seasonal studies on individual stocks and sectors. The data base holds seasonality studies on over 1000 big and moderate cap securities and indices.
To login, simply go to http://www.equityclock.com/charts/
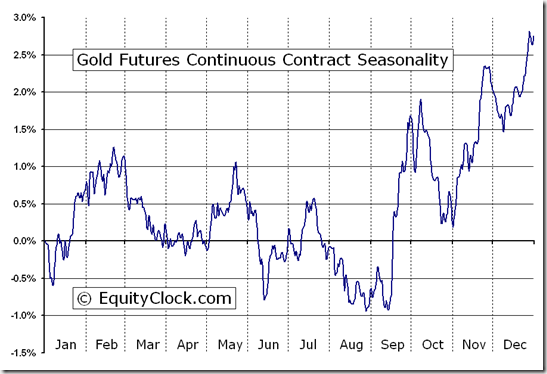
The above chart represents the seasonality for Gold Futures (GC) Continuous Contract for the past 20 years.
- Date range: January 1, 1990 to December 31, 2009
- Type: Commodity Futures – US
- Symbol: GC
Gold Futures Continuous Contract Seasonality
Analysis has revealed that with a buy date of September 13 and a sell date of May 23, investors have benefited from a total return of 183.61% over the last 10 years. This scenario has shown positive results in 9 of those periods.
Conversely, the best return over the maximum number of positive periods reveals a buy date of September 16 and a sell date of May 20, producing a total return over the same 10-year range of 159.82% with positive results in 10 of those periods.
The buy and hold return for the past 10 years was 125.11%.
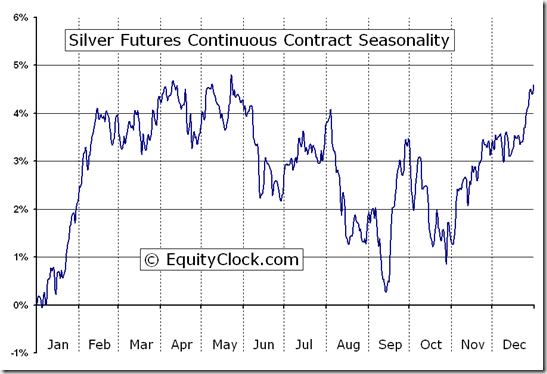
The above chart represents the seasonality for Silver Futures (SI) Continuous Contract for the past 20 years.
- Date range: January 1, 1990 to December 31, 2009
- Type: Commodity Futures – US
- Symbol: SI
Silver Futures Continuous Contract Seasonality
Analysis has revealed that with a buy date of September 16 and a sell date of April 11, investors have benefited from a total return of 314.85% over the last 10 years. This scenario has shown positive results in 7 of those periods.
Conversely, the best return over the maximum number of positive periods reveals a buy date of September 14 and a sell date of September 23, producing a total return over the same 10-year range of 55.36% with positive results in 10 of those periods.
The buy and hold return for the past 10 years was 105.43%.
-
I know Mike is a very solid investor and respect his opinions very much. So if he says pay attention to this or that - I will.
~ Dale G.
-
I've started managing my own investments so view Michael's site as a one-stop shop from which to get information and perspectives.
~ Dave E.
-
Michael offers easy reading, honest, common sense information that anyone can use in a practical manner.
~ der_al.
-
A sane voice in a scrambled investment world.
~ Ed R.
Inside Edge Pro Contributors

Greg Weldon

Josef Schachter

Tyler Bollhorn

Ryan Irvine

Paul Beattie

Martin Straith

Patrick Ceresna

Mark Leibovit

James Thorne

Victor Adair