
Timing & trends
In the last 150 years there have been several papers published demonstrating correlations between these natural phenomena and the financial markets and the macro economy, largely ignored by the financial and business media. I will provide evidence that solar phenomena are the underlying cause of several financial and macroeconomic phenonema, and therefore deserving of a more central role in trading stocks and commodities.
Trading the Sun, Economic Rot and the Emerging Housing Stealth Bull Market
John Hampson of www.solarcycles.net has made available to our readers a 26 page analysis of the influence of the sun on the financial markets and the macro economy.
Trading the Sun
John writes: There is an 11-year (average) cycle of solar activity, measured in sunspots. Solar activity causes geomagnetic disturbance on Earth. The sun is also responsible for a cycle of nocturnal lunar illumination on Earth that lasts approximately a month.
Psychological and behavioural research links geogmagnetism and lunar phasing with human mood, and sunspots with human excitability. Studies also link altered moods to more cautious behaviour, including financial decisions. In the last 150 years there have been several papers published demonstrating correlations between these natural phenomena and the financial markets and the macro economy. However, perhaps due a lack of scientific consensus over causality, solar phenomena remain niche disciplines in trading and economics, largely ignored by the financial and business media. In this document I will attempt to provide evidence that solar phenomena are the underlying cause of several financial and macroeconomic phenonema, and therefore deserving of a more central role in trading stocks and commodities.
The broadly accepted classification of disciplines used in trading the financial markets is four-fold: (i) fundamental analysis including macroeconomics (ii) technical analysis, (iii) financial astrology and (iv) quantitative analysis. From (i) I will demonstrate the influence of solar phenomena on growth, inflation, demographics and asset cycles (stocks and commodities), and from (ii) I will explain how solar phenomena drive sentiment, stock market seasonality and waveform. I will also demonstrate the link between financial astrology and solar phenomena, and explain the decennial cycle.
History Of Research In 1843 the German astronomer Schwabe discovered the solar sunspot cycle. By 1875 William S Jevons published his theory (1) that business cycles were related to these sunspot cycles, arguing that sunspot activity affected weather which affected agricultural output and prices which affected overall economic activity. As his supporting evidence contained flaws, he was largely discredited. However, Garcia-Mata and Shaffner (2) reworked Jevon’s theory in 1934 and concluded that there was a clear statistical correlation between the major cycles of non-agricultural business activity in the U.S. and the solar cycle.
Meanwhile, Alexander Tchijevsky wrote the paper Physical Factors of the Historical Process (3). He compared sunspots records to major historical events in 72 countries from 500BC to 1922, and found a concentration around solar maximums. He divided the solar cycle into 4 periods and found correlations between human behavior and these periods: 1) a three year period of minimum activity characterized by passivity and autocratic rule; then 2) a two year period during which masses begin to organize under new leaders and one theme; followed by 3) a three year period of maximum excitability, revolution and war; and lastly 4) a three year period of gradual decrease in excitability until the masses are apathetic. He considered these variations as Mass Human Exitability.
In 1965 Charles Collins found that, based on 93 years of data, a major stock market top is due when the average yearly number of sunspots rises to over 50 (4). Edward Dewey in 1968 found 43 activities that fluctuated with the sun’s 11 year cycle, including commodity prices, stock prices, banking activity, business activity, industrial production and agricultural productivity (5). Bryan Walsh wrote an article in the Cycles magazine in 1993 (6) putting some of Dewey’s claims to the test. By computing the rate of change in the geomagnetic field over the years (using the Ap index) together with the annual rates of for several measures of economic and financial performance (GNP, CPI, stock prices, gold price, bonds), he found the former led the latter by 6 to 12 months and had an average 65% correlation.
Krivelyova and Robotti found strong empirical support in favour of a geomagnetic storm effect in stock returns after controlling for market seasonals and other environmental and behavioural factors (7).
Regarding the sun’s illumination of the moon and its correlation with stock market returns, there have been several recent papers written. Illia Dichev and Troy Janes (8) demonstrated that stock returns in the 15 days around a new moon were around double those in the 15 days around full moons, for all major US stock indices (100 years data) and nearly all stock indices of 24 other countries studied (30 years data). K Yuan, L Zheng and Q Zhu (9) investigated the correlation between lunar phases and stock market returns for 48 countries and found that returns are lower around full moons and higher around new moons by 3-5% per annum, factoring out volatility, volume, and other calendar related phenomena. Marco Hickey (10) found positive correlation between 5 US stock indices and returns around new moons, and the inverse for the 10 year bond (using 10 years data).
In recent years biological evidence has come to light that sunspots and solar cycles do impact humans physiologically, which are supportive of Tchijevsky’s earlier social studies. William Hrushesky, in his 2011 paper (11) noted slight elevations in oral temperature, pulse rate, blood pressure, and respiration rate and a slight decrease in the man’s maximum expiratory flow that peaked several months after the occurrence of solar sunspot maximum.
To bring us right up to date, there is a growing body of evidence that geomagnetic field changes and sunspot maxima affect biological systems, and increasing psychological and biological evidence that the sun’s illumination of the moon affects human behaviour and mood. There are also electromagnetic theories of human consciousness – that consciousness is an electromagnetic phenomenon. However, these are areas in which there is as yet no overall scientific consensus.
Here is a visual of the correlation between moon phase extremes and the S&P500 in 2010-2011:
This article continues in a 26page PDF file (2meg) direct download from the Market Oracle website (will remain available until at least end of March 2012).
John Hampson, UK / Self-taught global macro trader since 2004
www.solarcycles.net (formerly Amalgamator.co.uk) / Predicting The Financial Markets With The Sun
© 2011 Copyright John Hampson – All Rights Reserved Disclaimer: The above is a matter of opinion provided for general information purposes only and is not intended as investment advice. Information and analysis above are derived from sources and utilising methods believed to be reliable, but we cannot accept responsibility for any losses you may incur as a result of this analysis. Individuals should consult with their personal financial advisors.
© 2005-2012 http://www.MarketOracle.co.uk – The Market Oracle is a FREE Daily Financial Markets Analysis & Forecasting online publication.
Stocks Stealth Bull Market 2011 Ebook Direct Download Link (PDF 2.8m/b)
Interest Rate Mega-Trend Ebook Direct Download Link (PDF 2.3m/b)
Inflation Mega-Trend Ebook Direct Download Link (PDF 3.2m/b)

Todd Market Forecast for Tuesday March 13, 2012
The stock market was higher by a little over 100 Dow points when late in the day, JP Morgan raised its dividend and announced a massive $15 billion stock buyback. There is now anticipation that other banks will follow suit.
There seemed to be little reason for the earlier rally. Yes, retail sales were perceived as being good, but a lot of that increase was at gasoline stations. The Federal Reserve FOMC meeting and announcement was also basically a non event.
One has to ask, was there sufficient leakage of the JP Morgan announcement to tip the scales toward the upside prior to the announcement.
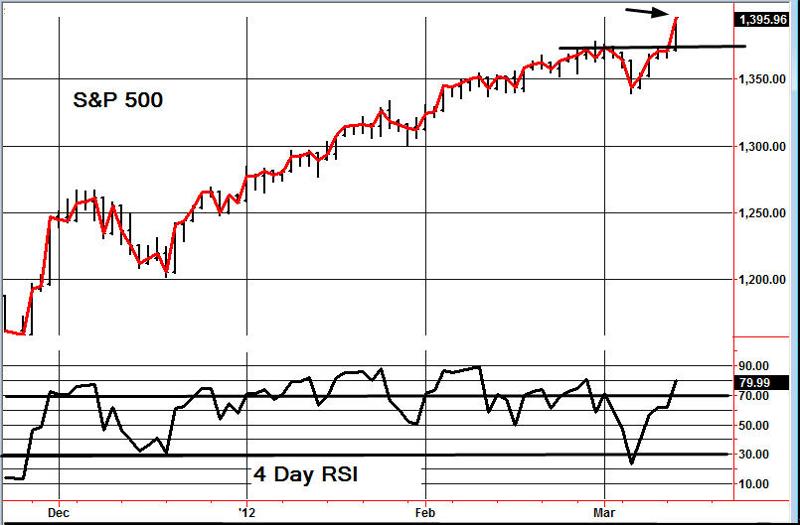
Regardless of the reason, the major indices broke out above the resistance zone that we showed in yesterday’s update and this is a bullish occurrence.
Available Mon- Friday after 6:00 P.M. Eastern, 3:00 Pacific.
DOW + 218 on 1550 net advances
NASDAQ COMP + 56 on 1250 net advances
SHORT TERM TREND Bullish (change)
INTERMEDIATE TERM TREND Bullish
TORONTO EXCHANGE: Toronto gained all that it lost yesterday and then some. We’ll be changing our evaluation.
This past week I read another excellent article by Jeremy Grantham which included several “tips” for retail investors…the tip that really got my attention was, “Stock market opinions must be read with a careful understanding of the time period being used.” His article reminded me how important it is for me to trade the same time horizon as my analysis….because if I’m not properly connecting the time frame of my analysis to the time frame of my trading….and vice versa….I’m going to be losing money. In fact, I think any time I’ve “struggled” with trading it’s because my short term trading strategies have been based upon longer term analysis.


Many already think that the European sovereign debt crisis is passing. That the latest bond deal and bailout for Greece solves everything.
But as far as I’m concerned, nothing could be further from the truth.
First, severe austerity measures do not create growth. So there’s no way Greece can grow its way out of its debt morass, even after the latest debt write-downs.
The proof is simple math. Before the Greek crisis flared up, debt-to-GDP in Greece stood at 120%. Today — and I repeat, even after all the write-offs — Greek debt-to-GDP stands somewhere north of a whopping 160%.
That’s more than 40% higher than it was at the beginning of the crisis — and the austerity measures are literally causing the Greek economy to implode, creating some of the worst social chaos we have seen in modern times.
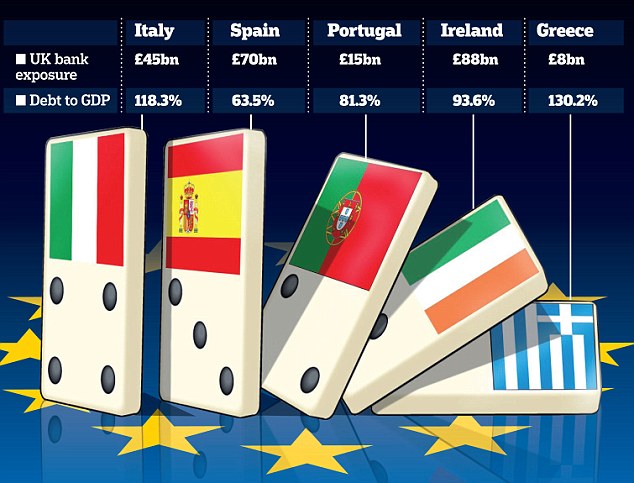
Second, Italy, Portugal and Spain still remain vulnerable dominos. Each and every one of them is in hock way over their heads. And each and every one of them is just beginning to feel the impact of austerity measures.
Unemployment among youth is as much as 25%. Corporate and personal bankruptcies are surging. Social discontent is on the rise again. And tensions between countries within Europe are as high as ever.
Third, European banks themselves don’t buy any of the solutions. They show no confidence in Europe’s ability to survive the crisis.
That’s why Europe’s banks are holding on to money for dear life. Rather than lend into the economy, these banks are hoarding their cash, stashing droves of it at the European Central Bank (ECB) …and even scrambling to deposit hundreds of billions with Western central banks for safe-keeping.
Fourth, Europe’s economy as a whole is sinking. The ECB’s latest economic projections show the economy may contract 0.1%. That may not sound like much, but the previous forecast was for 0.3% positive growth.
Worse, that’s not going to help Europe’s internal financing needs this year. Italy and France alone have over $795 billion in debt that will have to be rolled over this year. With growth sharply slowing, plus uncertainty about which dominoes will be the next to fall, there’s a very real chance of a massive bear market collapse in European debts this year that takes down the entire European Union.
Fifth, high energy prices are making matters all that much worse. It would be one thing if we were seeing $35-a-barrel oil and cheap gasoline prices. But we’re not. So, high energy prices are certainly not helping the situation in Europe. Period.
Neither is inflation. With austerity measures squashing growth all over Europe and inflation on the rise, Europe is facing a double whammy in the months ahead. More hits to economic growth, more trouble rolling over debt and, soon, another renewed rise in social discontent.
In short, nothing, and I mean nothing, has been solved in Europe. There may be a lull in the crisis, but it will soon return with a vengeance.
As for the United States — don’t kid yourself. The U.S. economy looks better only because Europe looks so bad. In reality, the U.S. debt mountain is in even worse shape. And when it falls, it will fall hard.
Fortunately, we have some time before it crumbles. But not much. And as long as Europe’s crisis worsens, the U.S. will look like the better place to invest.
Which is precisely why the U.S. dollar is starting to rally again.
My suggestions …
A. Keep most of your liquid funds in cash, ready to be deployed on a moment’s notice, but as safe as can be right now. The best way: A short-term Treasury-only fund in the U.S., or the equivalent.
B. Hold on to all long-term gold holdings. You do not want to let go of those. Gold is heading to well over $5,000 an ounce over the next few years.
In the short term, however, I would not be surprised to see gold — and silver — move lower.
For one thing, as the U.S. dollar strengthens again, some of the shine will come off of the precious metals, even as Europe’s problems fester.
For another — and very importantly — both gold and silver failed to give monthly buy signals on Wednesday, February 29.
In fact, they failed miserably, with gold plunging more than $100 an ounce, more than 5.5%, in a single day and failing to take out the monthly buy signal at $1,789.
Silver, meanwhile, plunged almost 10% on February 29 and failed to close above its monthly buy signal at $35.85.
These are significant failed signals that strongly suggest that my forecast for lower metals prices — before they truly break out to the upside — remain on target.
Indeed, the next important levels of support for the metals — which I expect to see tested in the weeks ahead — are now at the $1,490 level in gold and the $29 level in silver. If those levels give way, even lower prices could be seen in the short term.
So if you’ve acted on any of my recent suggestions for light speculative bearish positions in gold and silver via inverse ETFs such as the ProShares UltraShort Gold (GLL) and ProShares UltraShort Silver (ZSL), I suggest you continue to hold those positions.
Ditto for my suggestion for bearish speculative positions on the euro via the ProShares UltraShort Euro (EUO) …and for the stock market via inverse stock index ETFs such as the ProShares UltraPro Short S&P 500 (SPXU).
Don’t overtrade them, though. Those are speculative positions and I cannot help you via this column with precise timing and risk management. So keep that in mind.
Best wishes,
Larry
P.S. I’m just putting the finishing touches on the March issue of my Real Wealth Report. If you’re already a member, be sure to check your inbox this Friday, March 16, for my latest forecasts and a lot of news about how Real Wealth is going to help you get positioned for profits. If you’re not a member, this is a fantastic time to get started.
To join for the year, click here now. It will be the best money you spend this year. I repeat, click here now.

MINING.com editor Andrew Topf sits down with mining analyst Mickey Fulp, who topped the site’s list of recommended mining bloggers and newsletter writers. In this brief interview on the sidelines of the PDAC convention in Toronto, Fulp touches on gold stocks, current market volatility, and two metals he likes best right now: uranium and graphite.
Andrew Topf: What metals are you bullish on right now?
Mickey Fulp: Copper, gold and uranium, and I’ll put graphite into that too.
Andrew Topf: Right, graphite seems to be the belle of the ball right now.
Mickey Fulp: It is, it’s the next big thing it reminds me very much what happened with REEs in 2009. We’re building a bubble in graphite, every snake oil salesman, shark and charlatan is swimming aorund in Coal Harbor in Vanouver right now. Every Vancouver promoter is scurrying around trying to find a shell to throw a graphite project in, so it looks very much like the next big thing. Like other area and commodity plays the juniors will rush in and 95% of them will fail and the ones with good deposits and good business plans will succeed.
…..read the entire interview HERE

-
I know Mike is a very solid investor and respect his opinions very much. So if he says pay attention to this or that - I will.
~ Dale G.
-
I've started managing my own investments so view Michael's site as a one-stop shop from which to get information and perspectives.
~ Dave E.
-
Michael offers easy reading, honest, common sense information that anyone can use in a practical manner.
~ der_al.
-
A sane voice in a scrambled investment world.
~ Ed R.
Inside Edge Pro Contributors

Greg Weldon

Josef Schachter

Tyler Bollhorn

Ryan Irvine

Paul Beattie

Martin Straith

Patrick Ceresna

Mark Leibovit

James Thorne

Victor Adair