
Timing & trends
“Boom Sayers”
Some of them are still singing, but technically markets seem to have finished the hymns of praise.
Signs Of The Times
This Year:
“Dollar Turns Bearish amid Disappointing Housing Data”
– Forex, March 26
“Heavy hitters such as Goldman Sachs and J.P. Morgan are now actively adding equity exposure.”
– Financial Post, March 27
“Betting On U.S. Homes Comeback”
– Financial Post, March 30
“The overall technical backdrop remains bullish so buy-on-dips is still the most profitable strategy.”
– Technical letter, March 30
* * * * *
Last Year:
“Stocks climbed as the better-than-expected data on confidence and manufacturing bolstered optimism on the economy.”
– Bloomberg, April 15, 2011
“Flight From U.S. Dollar”
– Financial Post, April 21, 2011
“Don’t Like a Weak Dollar? Might as Well Get Used to It.”
– Breitbart, April 26, 2011
Concerns about the dollar were so wide-spread that Geithner stated “We will never embrace a strategy to weaken the dollar”.
Our notes from then included someone else’s description of the Geithner Bond. “No principle, no yield and no maturity”.
The DX dropped to 72.70 as the good times ended on May 3rd and rallied to the 80 level as the panic about sovereign debt ended last fall.
On the recent surge to good times, the DX declined (accompanied by the usual bad press) to only the 78 level. The low as the bubble completed in 2008 was 71.33. The low on the speculative surge to March 2011 was 72.70 and the recent low at 78 sets a rising trend of important lows.
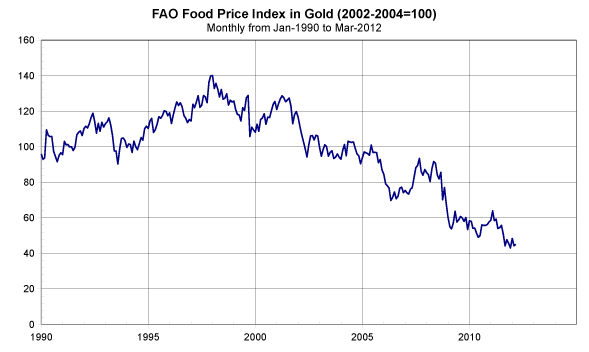
Against these, commodities (CRB) set a sequence of speculative spikes at 474, 371 and at 326 in February. Clearly, commodity speculators are not accommodating the Fed’s implicit policy of dollar depreciation.
It is worth noting a plea for help during the troubles of September, only six months ago:
“Investors just want to know, even if it is a Band-Aid, that there is some cure that’s going to be announced.”
* * * * *
Perspective
Our list of “Boom Sayer” exclamations has been accompanied by technical readings of momentum and sentiment usually found at important tops. Last week, Market Vane’s Bullish Consensus reached the highest reading since 2007. Also, as we have been discussing insider selling has reached significant levels.
We have been looking for a rolling top whereby not all sectors peak at the same time. This seems to be working out with cyclicals such as base metal miners and S&P Energy setting their highs in late February. Of Dow Theory importance, the Transports set their high in early February and the bounce seems like a failed test.
Overseas, the DAX, FTSE, Shanghai and Hong Kong set highs earlier in March and have recorded downtrends.
More recently, technical work such as yesterday’s “Bearish Divergences” provides confirmation of a topping stock market from an unusual point of view.
Under such conditions it has been prudent to sell the rallies.
Currencies
The U.S. Dollar is in a technical pattern leading to an outstanding rally. Historically, one of the features of the post-bubble condition has been a chronically firm senior currency. That’s against most currencies and most commodities, for most of the time.
Commodities
In momentum and enthusiasm, the CRB has been replicating the action in 1Q2011, but at lower levels on the index and in excitement. This year’s high was 326 set in the third week of February. At 306 today, taking out 305 would extend the downtrend.
This would confirm that last year’s high of 371 was, indeed, a cyclical peak.
Credit Markets
The action in longer maturities stopped favourable trends in mid-February. Over the past two weeks, a turn for the worse has started. The price on the sub-prime mortgage bond has broken down.
This has serious implications, as does the action in sovereign debt. As an example, yields for the Spanish bond has been rising since early March, taking out technical resistance. Taking out 5.75% will be a serious event. The chart follows.
Since the middle of March, yields and spreads for junk and high-yield have been moderately adverse.
Representing shorter maturities, the Ted-spread stopped narrowing in late February and the chart seems to be “bottoming” since.
And it is worth keeping in mind that after there has been joyous action in spread markets in the first part of the year, the seasonal reversal in May can lead to disaster in the fall.
INSTITUTIONAL ADVISORS
WEDNESDAY, APRIL 11, 2012
BOB HOYE
PUBLISHED BY INSTITUTIONAL ADVISORS
The following is part of Pivotal Events that was
published for our subscribers April 5, 2012.
Link to April 5, 2012 ‘Bob and Phil Show’ on TalkDigitalNetwork.com:
http://talkdigitalnetwork.com/2012/04/holiday-job-shocker/
BOB HOYE, INSTITUTIONAL ADVISORS
E-MAIL bhoye.institutionaladvisors@telus.net“>bhoye.institutionaladvisors@telus.net
WEBSITE: www.institutionaladvisors.com

Jim Rogers: Farmers will make ‘huge’ amounts of money… An aging workforce… China pushes agriculture…
- In an interview with China’s national English-language newspaper China Daily, legendary investor and commodities bull Jim Rogers sang the praises of farming. Rogers said you’ll “make a huge amount of money” if you buy a farm and become a farmer today… “The price of your products is going to go up. You’re going to make more and more money every year… The price of your land is going to become more and more valuable.”
- Rogers, ever the contrarian, believes farmers will be some of the most successful people in the world over the next 20 to 30 years. (He noted how terrible the business has been for the past 20 or 30 years.)
- Today, farmers are dying out. The average age of a farmer in America is 58. It’s 66 in Japan. But the world still needs food (more and more, in fact). Still, farming will have to become more profitable in order to attract labor and capital.
- We expect the situation in farming will develop a lot like the mining sector… We discussed the global shortage of mining employees in the November 16, 2011 Digest. As demand and prices for metals increased, the normally low-margin business of mining improved. But the workers weren’t there:
According to Sigurd Mareels, director of global mining for McKinsey & Co., there’s a “historical shortage” of mine workers around the world. Australia, the world’s largest source of iron ore and the second-largest gold producer, needs an additional 86,000 workers by 2020, according to the Minerals Council of Australia. That’s on top of the current work force of 216,000. Miners in Australia – some of whom commute from the Philippines and New Zealand – make between $100,000 and $200,000 a year.
“It’s a tight labor market and difficult cost environment,” said Ian Ashby, president of the iron-ore division at BHP Billiton, the world’s largest miner. To attract workers, BHP and other miners are building recreation centers, sports facilities, and art galleries in mining towns. Costs to attract and pay new talent decreased earnings by $1.2 billion in the first half of 2011. (BHP Billiton still earned $11.2 billion over that period.)
In farming (as with mining), we expect capital will be pulled into the sector as the products become more attractively priced and the return on that capital gets better.
- If you don’t want to become a farmer, don’t worry… There are still ways to profit from the boom. For example… Rogers suggests you can sell seeds, fertilizer, and tractors.
- The biggest driver of food demand is China. Food is one of the first things people spend their money on as they get a little bit wealthier. As China’s economy modernizes, its gigantic population is growing wealthier and will spend some of that money on eating better.
The Chinese government knows the country needs food… It’s already giving incentives to farmers. As we noted during our time in Hong Kong…
Jing Ulrich, the JPMorgan managing director who spoke at the Hong Kong conference, said the Chinese central bank cut the reserve ratio by two percentage points (in addition to the two previous cuts) for several hundred branches of the Agricultural Bank of China earlier this month. Lower reserve ratios mean the bank may hold less of its deposits in reserve, freeing capital for lending.
“It’s March,” she said. “Planting season is coming.” The move will allow the Agricultural Bank to lend more money to the Chinese agricultural sector. The central bank wants to specifically support local agriculture with its latest stimulus efforts.
Jim Rogers also just gave an interview to our own Frank Curzio, editor of Phase 1 Investor and Small Stock Specialist. On the latest installment of Frank’s S&A Investor Radio podcast (now available), Rogers – whose bullish view of gold is well-known – explains why he expects a pullback in the precious metal… and what might lead him to short it. To listen for free to all of Frank’s podcasts, click HERE.
The transition stage for equity markets (Buy when it snows, sell when it goes) has started earlier than usual this year. Protective strategies and profit taking for investors with a 3-6 month time horizon is appropriate given the current fundamental, technical and seasonal influences.
The S&P 500 Index fell 10.39 points (0.74%) last week and another 15 points following release of the job report on Friday. Intermediate trend is up. However, the Index broke below its uptrend line on Thursday and its 20 day moving average on Wednesday to complete a bearish rising wedge pattern. The Index likely will test its 50 day moving average at 1,370.05 shortly. Short term momentum indicators have rolled over from overbought levels.
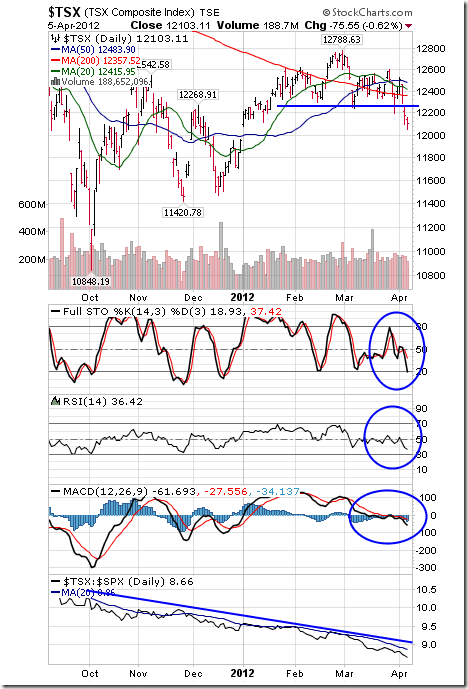
The TSX Composite Index plunged 289.07 points (2.33%) last week. Intermediate trend is down. The Index has completed a modified head and shoulders pattern. The Index remains below its 20 and 50 day moving average and fell below its 200 day moving average last week. Short term momentum indicators are trending down, but have yet to show signs of bottoming. Strength relative to the S&P 500 Index remains negative. A loss of another 130 points or more is likely at the opening today.
View more Equity Trends, Currencies, Gold/Commodities, Interest Rates, 50 charts and other factors HERE
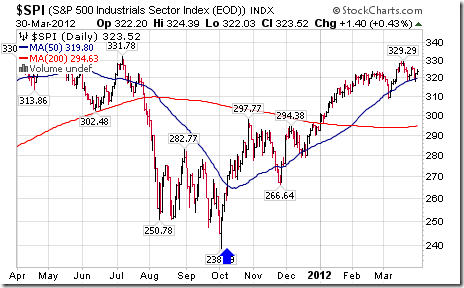
This column recommended accumulation of Exchange Traded Funds in the Industrial sector on October 11th for a seasonal trade lasting until Spring. Since then, the S&P Industrial Index has gained 23.9 per cent. What should holders of Exchange Traded Funds and related equities in the sector do now?
The industrial sector includes a wide variety of subsectors including industrial conglomerates, aerospace & defense, machinery, air freight & airlines, road & rail, electrical equipment, construction and engineering and building products. Investors can choose between 24 ETFs that track the sector or its subsectors. Largest holdings in the S&P Industrial Index are General Electric, United Parcel Services, United Technologies, Caterpillar, MMM, Boeing, Union Pacific, Honeywell, Cummins and Emerson Electric.
The industrials sector has a period of seasonal strength from October 9th to May 31st. Average return per period during the past 20 periods was 15.0 per cent. The current period has recorded significantly higher than average returns through actively traded Exchange Traded Funds. Excluding dividend distributions, the Industrial Select Sector SPDR Fund (XLI $37.42) has gained 21.0 per cent, the Vanguard Industrial Index Fund (VIS $69.54) has advanced 20.0 per cent, iShares on the Dow Jones Transportation Average (IYT $93.69) gained 15.5 per cent, the Dow Jones US Aerospace & Defense Fund (ITA $67.13) gained 17.4 per cent and Market Vectors Environmental Services ETF added 14.7 per cent.
On the charts, the S&P Industrials Index has a positive, but deteriorating technical profile. Intermediate trend is up. The Index trades above its 50 and 200 day moving averages. However, strength relative to the S&P 500 turned negative at the end of January and short term momentum indicators started to roll over from overbought levels last week. The Index at 323.52 currently has resistance at 329.29. In addition, several key stocks in the sector including United Technologies, Caterpillar and Boeing broke below technical support levels last week.
The sector is vulnerable to news from first quarter earnings report when they begin to appear next week. General Electric, United Parcel Services, United Technologies and Caterpillar are scheduled to report modest earnings gains on a year-over-year basis while MMM, Boeing and Honeywell are expected to report modest declines. Of greater concern, second quarter earnings guidance released with first quarter reports could be revised lower by several key companies in the sector. Most companies in the sector realize more than half to their earnings from operations outside of the United States. Currency translation into U.S. Dollars at a time when the U.S. Dollar Index is high relative to the same period last year will significantly dampen earnings expectations in the second quarter.
Preferred strategy is to take seasonal profits on Industrial sector Exchange Traded Funds and related equities at current or higher prices.
Don Vialoux is the author of free daily reports on equity markets, sectors,
commodities and Exchange Traded Funds. . Daily reports are
available at http://www.timingthemarket.ca/. He is also a research analyst for
Horizons Investment Management Inc. All of the views expressed herein are his
personal views although they may be reflected in positions or transactions
in the various client portfolios managed by Horizons Investment Management.

The markets, all of them literally, have been betwixt and between over the last couple of weeks. Chopping sideways. Looking at times like they are going to break out to the upside then failing. Moving lower, looking like they’re going to literally plunge at any minute. And then holding support and bouncing back.
This is very frustrating action for most traders and investors. However, I will tell you on a positive note that, when you see sideways action like you’ve seen in most of the markets, that of course is usually a prelude to a very big move.
And on another positive note, I do see this betwixt-and-between action — this sideways action — coming to an end very soon, probably by the end of this first week in April.
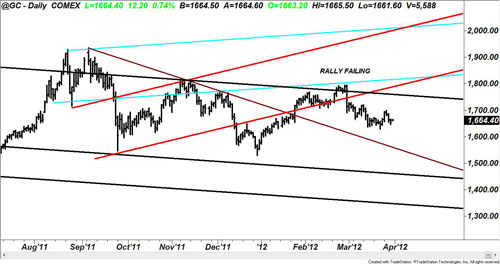
I want to go to the charts now. First, the gold chart. This is the gold chart that I’ve had up for the past month or so and been using to show you the action in gold. As you can see here, this is the rally that failed in February and failed to give a monthly buy signal.
Gold started to drift lower and is now pretty much in no-man’s land between support down here and resistance up here. I will tell you that the March closing for gold was not bullish, but it wasn’t very bearish either. So that’s indicative that gold is still in a sideways market, drifting lower.
I do expect as I just indicated that we will start to see some action soon in gold and all of my indicators point to a resolution of this sideways action to the downside.
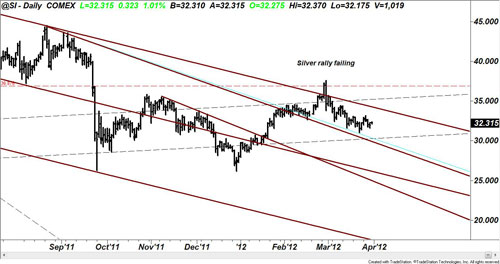
Having said that, let’s now take a look at silver. Silver looks very similar to gold. The rally failed back here, which I showed you. Silver failed to give a monthly buy signal at the end of February. Since then, throughout March we’ve been drifting lower in a choppy, sideways slightly lower action.
It does look at times that silver’s going to collapse; yet it continues to hold support around the $32 level. Like gold, I expect a resolution to this sideways action in silver and very soon, probably by the end of this first week in April.
All of my indicators continue to suggest that another sharp decline in silver is the most likely outcome.
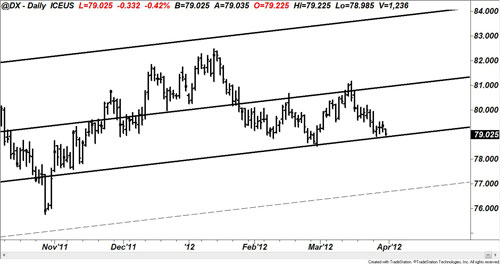
Now let’s move on to the U.S. Dollar Index. Again here, we’ve seen the dollar weaken to test support. But not a very impulsive decline here — rather, drifting lower. It looks kind of sharp on the chart, but it’s been a rather slow decline to support here.
I do believe we will hold this level of support and the next move in the dollar, which should come very soon, should be to the upside.
Now the Dow Industrials. The Dow Industrials are really holding support magnificently ever since we closed above the 12,849 level. The Dow being the only market that gave a monthly buy signal at the end of February, as I’ve indicated to you before, and now it’s consolidating.
Many of my indicators suggest the Dow and the broader stock markets in general are overbought and we should see some kind of correction. If you’re one of my trading subscribers who attended last week’s Resource Windfall Trader webinar, I did indicate to you that Dow 9,100 is now off the table.
I do expect some kind of shakeout in the Dow before the full force of the bull market of the Dow hits. So I wouldn’t be surprised to see a move down in the Dow. But it’s really quite fascinating how the Dow was holding this support area here and looking so rock-solid.
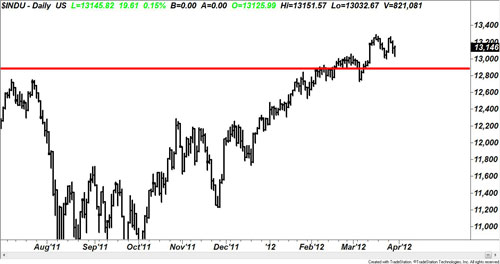
Even if we get a dip, a correction, in the Dow, there’s no question in my mind now that a new, long-term bull market in the Dow is forming. One that I’ve been talking about for some time now, and it will see the Dow and broader stock markets move substantially higher over the next few years as a result of the European sovereign debt crisis and the U.S. sovereign debt crisis.
The money that will be coming out of European bonds and U.S. government bonds has to go somewhere and it’s going to seek out safety, capital appreciation and income in the way of dividends and royalty in the stock market in addition to gold in a safe haven going forward. So keep that in mind.
Stay tuned to all my writings and have a good week.

-
I know Mike is a very solid investor and respect his opinions very much. So if he says pay attention to this or that - I will.
~ Dale G.
-
I've started managing my own investments so view Michael's site as a one-stop shop from which to get information and perspectives.
~ Dave E.
-
Michael offers easy reading, honest, common sense information that anyone can use in a practical manner.
~ der_al.
-
A sane voice in a scrambled investment world.
~ Ed R.
Inside Edge Pro Contributors

Greg Weldon

Josef Schachter

Tyler Bollhorn

Ryan Irvine

Paul Beattie

Martin Straith

Patrick Ceresna

Mark Leibovit

James Thorne

Victor Adair