
Timing & trends

….IF SPX 1685 IS BROKEN, THE RISK OF A 5% TO 10% DIP IMPROVES.
Applying some ‘guerilla tactics’ for VRtrader Platinum subscribers, having purchased inverse ETFs on yesterday’s opening, I decided to ‘ring the register’ when equities sold off midday and when it became apparent that 1685 support in the S&P 500 held. The impact of ‘Turnaround Tuesday’ and ‘Weird Wollie Wednesday’ may now be behind us setting the stage for a further bounce during the upcoming Options Expiration week. For the short-term, I believe Thursday’s lows holding are the key. That said, there is no guarantee we’re going to surge to new highs right away, nor that we’ve eliminated the risk of a further correction during August. We also have to keep an eye out for the potential perils of September and October.
Recall, my original forecast or 2013 was for a positive (bullish) year to be followed by weakness during 2014 and possibly 2015. The party is not quite over YET, so long as Central Bankers feel the way to nirvana is via the printing press.
Equities began the session with modest gains after upbeat data from China helped ease some concerns regarding the pace of global growth. The Middle Kingdom reported an increase in exports (+5.1% actual, +3.0% expected) and imports (+10.9% actual, +2.1% forecast) while its trade surplus narrowed to $17.82 billion from $27.10 billion.
The slide in equities and dollar/yen was halted shortly after the first hour of action. Stocks then returned to their highs but the S&P was unable to reclaim the 1,700 level.
In Thursday’s economic data, the initial claims level increased from an upwardly revised 328,000 (from 326,000) for the week ending July 27 to 333,000 for the week ending August 3. The Briefing.com consensus expected the initial claims level to increase to 340,000. Even though the claims level increased this week, the headline number is actually a strong positive sign for the labor market. Throughout July, the initial claims data were distorted by seasonal adjustment problems from the motor vehicle industry. The Department of Labor announced that this week’s claims data were unaffected by seasonal biases. That means the initial claims, which were around 350,000 prior to the distortions, actually improved throughout July.
Today, June wholesale inventories will be reported at 10:00 ET.
Here are the new AAII Survey (Sentiment) results for this week:
Bullish: 39.5%
Neutral: 33.9%
Bearish: 26.6%
Change from Last Week:
Bullish: +3.9
Neutral: -5.5
Bearish: +1.6
Long-Term Average:
Bullish: 39.0%
Neutral: 30.5%
Bearish: 30.5%
Note: The AAII survey is based on a 6-month outlook. AAII voting is open all week to its members. At the AAII Website, you can download a spreadsheet which contains historical sentiment survey results back to 1987.
——————————————-
Following a three-day decline, the Dow Industrials were up 27.65 at 15498.32. A ‘Key Reversal’ pattern was formed to the upside so Thursday’s intraday low of 15418.60 now becomes important support. VRtrader Platinum subscribers bought and sold the inverse ETF for the DJ (DOG) earlier in the session. As you know, the DJ traded at a new record high at 15658.43 on Friday. Once the rally resumes the next big upside target in VR analysis would place the DJ into the 16000.00 to 16250.00 range. Support at 15150.00.
——————————————–
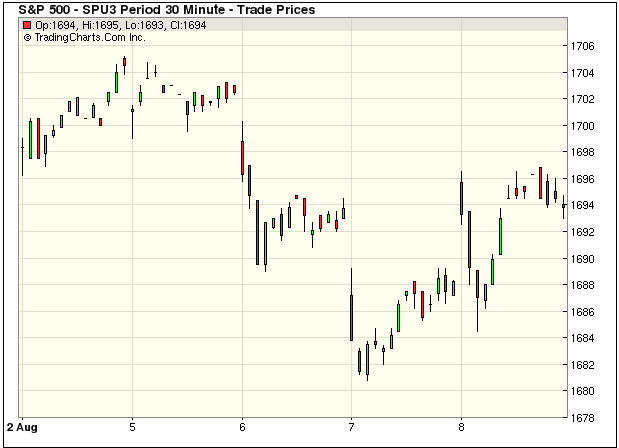
The S&P 500 was up 6.57 at 1697.48 – once again holding important support at 1685.00 intraday. That is the reason VRtrader Platinum subscribers were instructed to traded the DOG (mentioned above) along with the PSQ (the inverse ETF for the Nasdsaq 100). Once the rally resumes, unfulfilled upside targets include 1730, 1757.00 and potentially 1805.00. Support lies at 1685 and then 1659.00. A new record high was posted on August 2 at 1709.67.
——————————————–
The Dow Transports were up 52.08 at 6521.29. The Transports touched 6686.86, a new record high on August but were since negatively diverging as other major indexes rallied. We have to wait for a breakout here to give the bulls more ammunition. The next big technical target is 6900.00. On a bigger picture basis, a ‘theoretical’ bullish reverse ‘head and shoulders’ pattern has formed pointing to potentially 8900.00 in the Transports. There is no time associated with that projection. Downside support lies at 6180.00.
——————————————
The Russell 2000 was up 5.13 at 1049.47. The Russell raded at a new record high intraday Monday at 1063.52.
——————————————
The Nasdaq Composite was up 15.11 at 3669.12. A Leibovit Negative VR was posted on Tuesday confirming a short-term top and following a seven day consecutive advance that pushed to a new record high at 3694.19 intraday on August 5 – a high 100 points away from my still unfulfilled technical target fo 3800. VRtrader Platinum subscribers successfully traded PSQ (the inverse ETF for the Nasdaq 100 on Thursday).
—————————————-
The CBOE Volatility Index (VIX), which measures the cost of using options as insurance against declines in the S&P 500 (i.e., the higher the number, the more fear in the marketplace) was .25 at 12.73. The VIX touched 21.91 intraday on Monday, June 24 – the highest high since the March 15 low of 11.21 – the lowest level since February 2007. It was unchanged at on Friday. The higher we go in the VIX, the more likely a bear cycle is upon us.
—————————————–
Eight of the nine market sectors were higher on Thursday:
XLB +1.48% Materials
XLE +0.55% Energy
XLF +0.24% Financial
XLI +0.46% Industrial
XLK +0.33% Technology
XLP +0.53% Consumer Staples
XLU +0.38% Utilities
XLV +0.00% Health Care
XLY +0.67% Consumer Discretionary
———————————————
NYSE Advance/Decline 2719/1294.
NASDAQ Advance/Decline 1482/1026.
NYSE UP volume to DOWN volume was 3 to 1.
NASDAQ UP volume to DOWN volume was 3 to 2.
——————————————–
From the VRtrader.com website here is a link to World Market Indices:
http://www.vrtrader.com/vr_free/worldmarkets/index.asp
——————————————-
ECONOMIC CALENDAR:
(Courtesy of Don Vialoux):
Canadian July Housing Starts to be released at 8:30 AM EDT on Friday are expected to slip to 190,000 from 191,000 in June.
Canadian July Employment to be released at 8:30 AM EDT on Friday is expected to increase 6,000 versus a decline of 400 in June. The July Unemployment Rate is expected to remain unchanged from June at 7.1%.
Ed Note:This is a single comment isolated from a one of of the 4 Email Alerts Mark sends out every day for his VRPlatinum Newsletter Service. You can sign up for Mark’s Special Trial Offer
Here is the Special Trial Offer:
Use this month to kick our tires. Pay 50% for the first 30 days (No refund) and sample our Silver or Platinum service and then decide what works best for you. If you aren’t 100% ready to move forward, simply email us to cancel one week before your 30 day 50% off trial subscription ends and it will be canceled and you will not be charged ANY FURTHER, no questions asked. Just send an email to mark.vrtrader@gmail.com or call 928-282-1275 to cancel. You will receive an emailed confirmation of your cancellation at that time.
On Short Covering, China News, Weaker U.S. Dollar.
Comex gold futures prices rallied sharply in late-morning dealings to end the U.S. day session with solid gains. Both gold and silver saw heavy short-covering following selling pressure seen earlier this week, with some bargain hunting also featured. The weaker U.S. dollar index Thursday was also a supportive outside market factor for the precious metals markets. Chinese economic data released Thursday was also bullish for most of the market place and especially for the raw commodity sector. China exports were up a much higher than expected 5.1% year-on-year in July, compared to a 3.1% drop in June. Chinese imports rose by a much higher than expected 11%, year-on-year. December gold was last up $23.80 at $1,309.10 an ounce. Spot gold was last quoted up $22.70 at $1,310.50. September Comex silver last traded up $0.667 at $20.175 an ounce.
The gold and silver market bulls had good days Thursday, but have more heavy lifting to do in the near-term to get healthy from a charts perspective.
In other news Thursday, the European Central Bank released a forecast Thursday that shows it expects Euro zone economic growth to contract by 0.6% in 2013, citing weak consumer demand worldwide. The ECB forecast Euro zone growth in 2014 at up 0.9%. The ECB report comes out at a time when recent Euro zone economic data has shown generally slight improvement.
The U.S. dollar index was weaker again Thursday and hit another six-week low overnight. The greenback bears have the overall near-term chart advantage, which is an underlying bullish factor for the precious metals markets. Meantime, Nymex crude oil futures prices were solidly lower Thursday. The crude oil bulls have faded this week and a bearish double-top reversal pattern has formed on the daily bar chart.
The London P.M. gold fix is $1,298.25 versus the previous P.M. fixing of $1,282.50.
Technically, December gold futures prices closed nearer the session high Thursday. Gold bears still have the overall near-term technical advantage. However, a bullish weekly high close on Friday would give the bulls some fresh upside near-term technical momentum. The gold bulls’ next upside near-term price breakout objective is to produce a close above solid technical resistance at $1,350.00. Bears’ next near-term downside breakout price objective is closing prices below solid technical support at this week’s low of $1,271.80. First resistance is seen at Thursday’s high of $1,313.80 and then at this week’s high of $1,320.30. First support is seen at $1,300.00 and then at $1,290.00. Wyckoff’s Market Rating: 3.0
September silver futures prices closed nearer the session high Thursday and closed at a two-week high close. Bears still have the near-term technical advantage. Bulls’ next upside price breakout objective is closing prices above solid technical resistance at the July high of $20.595 an ounce. The next downside price breakout objective for the bears is closing prices below solid technical support at $19.00. First resistance is seen at Thursday’s high of $20.30 and then at $20.595. Next support is seen at $19.75 and then at Thursday’s low of $19.455. Wyckoff’s Market Rating: 3.0.
September N.Y. copper closed up 965 points at 326.95 cents Thursday. Prices closed nearer the session high and hit a fresh six-week high on heavy short covering and bargain hunting following the strong economic data out of China. Price action Thursday also saw a bullish upside “breakout” from a choppy trading range on the daily bar chart. Copper bulls now have the overall near-term technical advantage. Copper bulls’ next upside breakout objective is pushing and closing prices above solid technical resistance at the June high of 341.25 cents. The next downside price breakout objective for the bears is closing prices below solid technical support at last week’s low of 303.65 cents. First resistance is seen at Thursday’s high of 327.95 cents and then at 330.00 cents. First support is seen at 325.00 cents and then at 323.40 cents. Wyckoff’s Market Rating: 5.5.
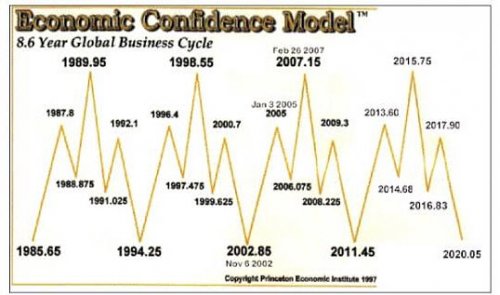
In this special interview, Jim Puplava sits down with Martin Armstrong, the esteemed global investor and creator of the widely-cited Economic Confidence Model (see image below), to address a number of myths floating around in the financial community. Here we present a few excerpts of our interview with Martin Armstrong airing for subscribers Friday, August 9th.
Jim Puplava: Martin, there are many out there saying that we are either at or near a major top in the stock market and also warning of a catastrophic collapse. Do you agree with that sentiment?
Martin: If you just look back at all the major highs—1929, gold in 1980, any of the commodities; take a look at any chart—major highs are always associated with what are referred to as “spike highs”. We don’t have that in the stock market. And again, most of the analysis that people are hearing is largely from people that are focused only on the U.S. They are blind to what is happening globally, and it’s just an international economy…so, largely, the stock market has been pressing up because you have serious trouble out in Europe—it’s an absolute basket-case over there—and capital has been moving out. You have interest rates that have been so low, you have pension funds that are virtually on the brink of insolvency. And it’s been forcing them to go into equities where they’re at least earning 5-7% dividends. And essentially you have China starting to turn down; you have Japan where capital is starting to move out and go into South East Asia and creep back over here. So the stock market has actually been well supported. I mean there will be a correction here short-term, but [the market] has been crawling up toward major resistance, which is at 16,000, and we’ve not been able to get through. We should back off first and then, I’d say, we’re going to go back up and make major highs in this thing going into late 2015, to the point where the Dow may even double in value yet.
Jim: You mentioned tops are typically associated with spike highs, but they are also characterized by widespread euphoria. Do you see such widespread euphoria in the market right now?
Martin: No. Most of the analysts out there calling for a crash keep saying, “See, [the market] can’t possibly be going up—I’m right. It’s going to happen any day now.” And, that’s not a high. I mean, I was in Tokyo when the market was peaking there and you had the Nikkei at 40,000. The last week people were saying, “100,000—that next.” When gold was reaching $875 in 1980, people were saying, “$1000.” And silver was at $54, people were jumping to “$100—absolutely.” We don’t have any of that. So this market is far from being at a major high [in terms of sentiment]. We are going to go up significantly. And then you’ll draw everybody in and then we’ll see the crash, but that’s probably 2016.
Jim: You mentioned China, the problems in Europe and Japan, which has actually helped capital flow into the U.S. Additionally, there have been calls for a dollar crash. Let’s talk about the dollar and why you feel a dollar crash at this point is unlikely.
Martin: Well, again, you have these people that are running around and have been calling for the dollar to collapse all because the Fed increased the money supply and all this other nonsense; but they fail to understand that there are two sides to every coin. Yes, we had a tremendous crisis coming out of ’07—the Fed pumped in $700 billion—but you also have to take into consideration how much was lost. So, the deleveraging was actually about three times as large as what they put in. That’s why you didn’t see any inflation, and you’re not really going to. Also, because, the dollar is really the only currency in the world you’re going to use…there is no alternative at this point.
The remainder of this audio interview will be available for subscribers Friday, August 9th on the Newshour page. To gain full access to all our premium interviews and content, pleaseCLICK HERE to subscribe.
In the rest of this interview, Martin also explains:
- How capital flight from Europe into the U.S. helped spur the roaring ‘20s and how this happening again
- How the Fed has been moving into short-term debt and makes interest rate volatility much more important
- Why he’s not expecting gold to take off dramatically until 2015
- How the government is slowly shutting down the underground economy, including the use of bullion
- Why you don’t see hyperinflation in developed economies and why deflation is more likely in the U.S.
For a list of previous interviews and guests, CLICK HERE to see our archive.
About Financial Sense
Cited by Barron’s as one of the top financial websites to visit on the weekend, Financial Sense provides free educational resources to the broad public audience through editorials, current news and resource links on salient financial market issues. Begun in 1985 as a local talk radio program, Financial Sense Newshour is now a free weekly webcast with host Jim Puplava and top financial thinkers.

“Now is the Time to Buy Chinese Stocks”
I Just Uncovered Some Shocking Numbers About China
There are few things more exciting in the investment business than finding a golden opportunity staring you in the face.
That’s why I do a lot of research. Because I know that the more I dig, the greater the chance I will find something that others miss, that leads to big opportunity.
Just like when I revisited China‘s recent economic data, looking for something in there that indicates whether the country’s economy is any closer to reviving its engine of growth.
And its stock market, too.
The Chinese stock market has fallen 40.9% since August 2009, leading Oppenheimer to refer to it as a “dead animal” and millions of investors to conclude it’s a lost cause.
All the more reason to dig… And there it was.
I knew then I had hit pay dirt…
Chinese M&A activity is soaring. Why would that happen in a market given up for dead?
Because key market forces are actually growing.
Here’s the evidence.
Strong Chinese M&A growth wouldn’t be happening if it weren’t for the nearly two-thirds of all M&A activity occurring in industrials, energy, and power deals that are running 31% ahead of last year.
Chinese tech M&A is even better and is 62% ahead of last year.
Here’s more evidence that China has the economic chops to re-ignite its stock market.
China’s PMI (Purchasing Manager’s Index) is expanding, coming in at 50.3 versus expectations of 49.8, according to Bloomberg’s survey of economists. Levels above 50 are consistent with expansion.
China’s still growing at 7.5% a year. So what if it’s down? That’s a whole lot better than the 2% to 3% we’re seeing in the West.
The nation is making the transition to consumer-based growth. People are pooh-poohing this concept, forgetting that Japan, Korea, and Taiwan all made this transition, too.
Chinese home prices are not out of control like “everybody” thinks. In fact, in inflation-adjusted terms (the blue line in this chart), prices have been falling since Q2 2010 exactly as the government intended when it tapped on the credit the brakes.
Additionally, the ratio of Chinese home prices to income has fallen by just over 50% since Beijing first began to rein in real estate speculation as a part of its broader economic picture. The ghost cities in the news aren’t what people think and are certainly not symptomatic of the entire nation.
General Motors and other companies like it continue to sell more product there than any other place in the world. That wouldn’t be happening if the nation was falling apart.
Now is the Time to Buy Chinese Stocks
There is nothing unusual in China’s market retreat. Pull backs of 40% to 60% are not uncommon in any market, but especially in China where capitalism, for all its ferocity, is still in its infancy.
For all the hype surrounding its seemingly inglorious fall from grace after leading the world out of the global financial crisis, the country is still in the early innings of what will go down as the greatest wealth creation mankind has ever seen.
This is a fantastic situation for stock investors in general and for us specifically, which is why it’s time to re-enter Chinese stocks:
- The bearish case for China is dramatically overdone.
- The Chinese stock markets are cheap when measured by PE. Right now, the markets reflect an average PE of just 7.1 and a yield of nearly 5%. (By comparison, the S&P 500 has a PE ratio of 18.57 and a yield of 2.07%.)
- The yuan will float by 2015. We’ve talked about this for years. What’s important to understand is that it will “unlock” trillions of dollars in trading value that is presently unrecognized.
- People hate Chinese stocks at the moment.
The bottom line?
China remains a “big idea” trade. It’s not going away any time soon and the genie is not going back in the proverbial bottle. The decline that everybody is so worried about is probably closer to being over than it is to when it got started.
Here’s how you can participate in China’s market move: Buy iShares China Large-Cap (NYSEArca:FXI) ETF. It has exposure to all the top Chinese companies like CNOOC and Bank of China.
 Keith covers cover companies like these and finds the right market opportunities in his Strike Force service.

-
I know Mike is a very solid investor and respect his opinions very much. So if he says pay attention to this or that - I will.
~ Dale G.
-
I've started managing my own investments so view Michael's site as a one-stop shop from which to get information and perspectives.
~ Dave E.
-
Michael offers easy reading, honest, common sense information that anyone can use in a practical manner.
~ der_al.
-
A sane voice in a scrambled investment world.
~ Ed R.
Inside Edge Pro Contributors

Greg Weldon

Josef Schachter

Tyler Bollhorn

Ryan Irvine

Paul Beattie

Martin Straith

Patrick Ceresna

Mark Leibovit

James Thorne

Victor Adair