
Timing & trends

One final comment on TAPER-gate.
A number of strategists and analysts were surprised by Ben Bernanke and the Fed’s decision not to “Taper” the rate of QE money-printing at their September meeting.
However, this behavior from the Fed is not without precedent.
Back in the autumn of 2008 when the Fed first implemented the policy of Quantitative Easing, Ben Bernanke was very quick to assure markets that the Fed would begin to “Exit” from this policy in April of 2009. That helped to make this very experimental policy more palatable.
To “Taper” merely means to slow the rate. But “Exit” refers to a complete reversal of the policy; actually removing the printed money.
Well, April 2009 came and went despite Bernanke’s promise of an “Exit.” Now, here were are five years later, and we have yet to see a single dollar from QE1, QE2, or QE3 removed from the money supply.
This might provide some insight into the Fed’s actual intention to “Taper.” For years they have found reason after reason not to “Exit.” Expect the same with respect to “Tapering.” Over the last three months, Bernanke has become more vocal that “Tapering” is data dependent. Somehow, I sense that the data will tend to be interpreted to support the notion of continued Quantitative Easing. It is unlikely that the policy of QE will never really end until investors say that it has to by pushing market-determined interest rates significantly higher at some point in the future.
Continued Quantitative Easing is not necessarily always the recipe for sizable stock market gains, but it will have the effect of placing a floor under the market and limiting the amount of actual and implied future volatility. This should help to provide a comfortable environment for stock market investors, at least over the near- to mid-term.
The opinions expressed in this report are the opinions of the author and readers should not assume they reflect the opinions or recommendations of Richardson GMP Limited or its affiliates. Assumptions, opinions and estimates constitute the author’s judgment as of the date of this material and are subject to change without notice. We do not warrant the completeness or accuracy of this material, and it should not be relied upon as such. Before acting on any recommendation, you should consider whether it is suitable for your particular circumstances and, if necessary, seek professional advice. Past performance is not indicative of future results.
Richardson GMP Limited, Member Canadian Investor Protection Fund.
Richardson is a trade-mark of James Richardson & Sons, Limited. GMP is a registered trade-mark of GMP Securities L.P. Both used under license by Richardson GMP Limited.

 On Sept 18 markets had to rapidly “re-price” their anticipation of Fed policy when the Fed decided to NOT taper…stocks, bonds and commodities all jumped higher while the US Dollar tumbled. In last week’s blog I wondered if the “re-pricing” would be sustained…or if it would create a “blow-off” top…perhaps even producing a Key Turn Date…when a number of markets reverse direction at the same time signaling an important change in Market Psychology. As we go into October its beginning to look like we had a Key Turn Date on Sept 18/19…setting the stage for big moves ahead.
Here’s what happened since the “re-pricing” of Sept 18 and 19:
Gold: dropped as much as $70 over the next 3 days…rallied back some…closed last week $40 below the “re-pricing” highs.
DJIA: dropped as much as 500 points from the All Time Highs made following the Fed surprise…closed lower in 6 of the last 7 sessions…down 2.7%.
Euro and the Yen: surged higher on the Fed surprise…and pretty much sustained those gains at last week’s close.
CAD: traded to 3 month highs (98 cents) on the Fed surprise but closed last week below 97 cents.
WTI crude: Hit $108 on the Fed surprise…but closed at $103 last week, down $5.
Bonds: The US long bond had a huge 3 point range Sept 18…closing near its highs. Bonds gained another 1½ points last week to reach 2 months highs…with support from several sources… the Fed said the economy was too weak (bond bullish) for them to cut back on their stimulation (more bond buying)…they caught a “safe haven” bid as stocks were sold…and shorts were scrambling to cover after the big sell-off since May.
Potential market turmoil ahead:
Fed: Will or won’t they taper at the Oct 29/30 meeting…a strong employment report this coming Friday (Oct 4) could renew “taper talk.”
Fed: Who will replace Bernanke?
Gov’t: Facing a shutdown on Oct 1…acrimonious political theater…debt ceiling could be reached by mid-October…more acrimonious political theater.
Europe: Now that Merkel is re-elected what changes in Europe?
My short term trading:
In last week’s blog I wrote that stocks and/or gold could be sold short following their quick “Fed surprise” rallies…and that selling pressure in both markets could intensify if they broke below their pre Fed surprise levels. I didn’t want to buy the break in the US Dollar (I’m pre-disposed to be US$ bullish, but the chart pattern looked bearish) and I was neutral on bonds (I felt that a short covering rally was over-due but I could see much higher interest rates ahead.) I chose to short gold because it was already in a downtrend (for the previous 2 weeks, for the last year, for the last 2 years) rather than short stocks which were in an uptrend (for the previous 3 weeks, for the last year, for the last 4 years.)
This past Tuesday (Sept 24) gold traded as much as $70 below its Sept 19 highs…but quickly bounced back. I was thinking that gold might keep dropping…might take out the pre Fed surprise lows at $1291…but it didn’t…so I covered my short term trade with a $38 profit and went to cash…sitting on the sidelines waiting for the market to set up another short term trading opportunity.
I didn’t short the US stock market because it was in an uptrend and picking a top to a bull market that is making All Time Highs is clearly a case of trading what I think the market should be doing rather than what it is doing. I also didn’t short the US stock market because I felt that would be “doubling up” my short on gold…that they were essentially the same trade…that they were both reversing on the same change in Market Psychology. In previous blogs I’ve written that since May I’ve only traded the US stock market from the short side…with plenty of time spent sitting on the sidelines! I’m still pre-disposed to look for an opportunity to get short stocks…but at the moment I’m sitting in cash without a position.
My trading motivation and methodology are intertwined. I don’t like losing money but I’m willing to take risks…I just want to avoid taking stupid risks. So I develop an opinion about Market Psychology to help me gauge where a market is in terms of a bullish or bearish phase…within my selected time frame…and then I wait for a low risk opportunity to establish a position. If the market goes against me I get out with a small loss…if it goes my way I try to add to the trade. If it goes somewhat in my favor, like the gold trade above, but then stops I don’t mind closing the position and going to cash.
Futures and futures options are the best way to trade currencies, metals, stock indices and many other financial and commodity markets. Call 604 664 2842 to talk with Drew Zimmerman
Most of the focus during the week was on the debate in Washington over the budget and debt ceiling with both political parties sniping at each other saying that it will be the other’s fault if the government has to shut down with no budget in place. Obviously, stock markets don’t like these comical displays when they relate to a serious fiscal issue.
There is not a whole lot of leadership in Congress with respect to getting to a resolution ahead of time. However, even more notable, there is no leadership from the president on this issue. Stating that he is not willing to negotiate with respect to the federal budget and the debt ceiling is an extreme position. In the past there has always been give-and-take on these issues. The Acts that that pertain to the debt ceiling and federal budget make it clear that that they are legislative issues to be debated. Declaring that they will not be debated is a sure way to hamper resolution.
One reason for this may be the president’s low standing in opinion polls. A crisis would be a welcome diversion from his performance in other areas. Also, it is usually difficult for the general voting public to grasp the nuances and details of budget debates. As a result, there may be a chance to win in the eye of the public by using rhetoric instead of cooperating.
Despite all the U.S. political shenanigans, history tells us that deals are eventually made at the 11th hour. Also, once that occurs, stocks normally make up more than they lost in the weeks leading up to the deadline. As a result, even though the news sounds bad, it may not be a bad time for the markets (assuming some other event doesn’t come out of left field, like weak corporate earnings for example).
Next Friday October 4th, the U.S. Bureau of Labor Statistics employment report comes out. The Fed is likely going to keep policy unchanged until at least December regardless. As a result, if the employment report is well outside of the consensus either way, the market response might be muted.
October, sometimes a stormy month for markets, looks like it might be a relatively benign stretch despite the storminess of the politics.
Mark Jasayko

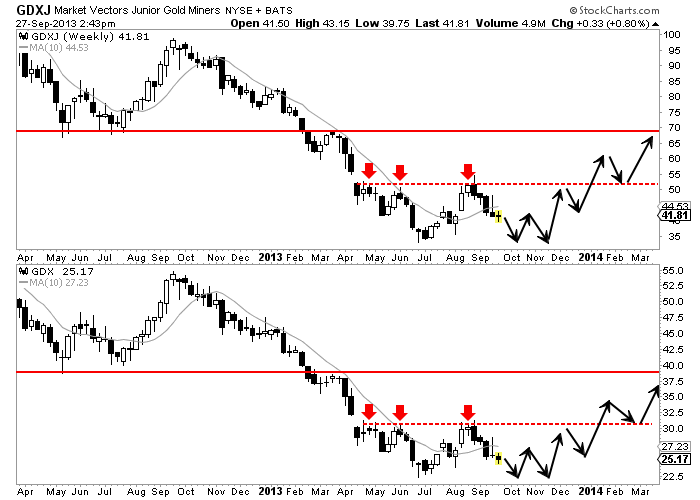
In our last editorial we pointed out how the gold stocks had veered off the recovery course. They fell well below the recovery template and fell below their 50-day moving averages. Furthermore, the positive “non-taper” news turned out to be the mother of all bull traps for traders. The market soared on presumably an epic amount of short covering. Yet that only served to be a selling opportunity for traders. That sequence of events only strengthened our view that the sector continues to be headed for a retest which could serve as the mother of all buying opportunities.
The weekly chart of GDXJ and GDX shows these markets sitting between strong support and strong resistance. At current prices, GDX has 12% downside to its daily closing low while GDXJ has 21% downside to its daily closing low. The silver stocks (SIL is not shown) also have 21% downside to their daily closing low. That is probably too much downside for a new low but it doesn’t rule out a retest.
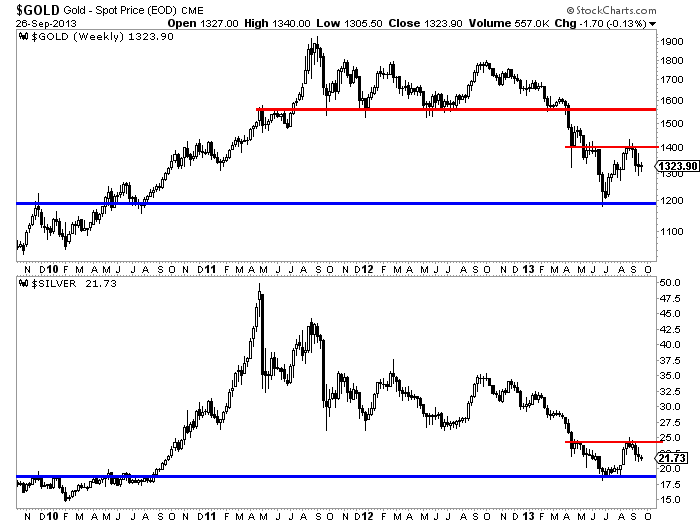
The weekly charts for Gold and Silver show a similar picture. Gold rallied nearly $220 on a daily closing basis. However, it failed at $1400 which is now clear resistance. Similarly, Silver rallied from $18 to nearly $25. There is quite a bit of resistance at $24. We think its unlikely Gold and Silver break past $1400 and $25 anytime soon. We’d first anticipate a retest of the summer lows or at best weeks and weeks of back and forth of action.
The good news for precious metals bulls is this market remains in a bottoming process which should produce a turning point that is on par with those seen in 2000 and 2008. The bad news is we are already five months into this bottoming process and it can continue for several more months. We don’t see widespread news in the sector but it is possible that GDX makes a new low but not GDXJ. It’s possible Gold makes a new low but not Silver. Major divergences are common at major bottoms.
The gold and silver stocks have been in a two and a half year bear market and have shed anywhere from 65% to 78%. Silver has been in a two and a half year bear market and at one point shed nearly 65%. Gold has been in a two-year bear market and has shed 36%. Huge cyclical rebounds aren’t an immediate reaction to the scope of these types of declines. These markets are telling us that the worst is just about over with yet more time is needed for a base that will launch the next phase of this secular bull market. If you don’t believe the next phase is worth waiting for then consider the following. Following these major bottoms the mining stocks have rallied on average 60%-70% within five months. In the two-month rally this summer, SIL rebounded 55% while GDXJ rebounded 63% (both on a daily closing basis). Once this bottoming process moves to its final stages, many stocks will be primed for spectacular rebounds that could occur in weeks and months. Readers are advised to watch closely and spot the companies which show the most strength during this retest. If you’d be interested in our analysis on the companies poised to lead this new bull market, we invite you to learn more about our service.
Jordan Roy-Byrne, CMT
About The Daily Gold
Jordan Roy-Byrne, CMT (Trendsman) is a Chartered Market Technician and member of the Market Technicians Association.. He is the publisher and editor of TheDailyGold Premium, a publication which emphasizes market timing and stock selection for the sophisticated investor.
From 2010-2012 The Daily Gold Premium Model Portfolio was up 131% compared to GDX (+5%) and GDXJ (-11%). In 2012, the Model Portfolio was up 32%, making it arguably one of the top-performing gold/silver stock newsletters. Jordan’s work has been featured in CNBC, Barrons, Financial Times Alphaville, Kitco and Yahoo Finance. He is quoted regularly in Barrons. Jordan has been a speaker at PDAC, Cambridge House and Hard Assets conferences. Jordan earned a degree in General Studies from the University of Washington with a concentration in International Economic Development. He also lived and worked in Southeast Asia for 3 years in order to study economic development from an emerging market perspective. In his spare time he enjoys spending time with Mrs. Trendsman.
Contact: Jordan @ TheDailyGold.com
Technically, we now have something quite clear.
INSTITUTIONAL ADVISORS
FRIDAY, SEPTEMBER 27, 2013
BOB HOYE
PUBLISHED BY INSTITUTIONAL ADVISORS
The following is part of Pivotal Events that was
published for our subscribers September 19, 2013.
Overdose of Kool-Aid
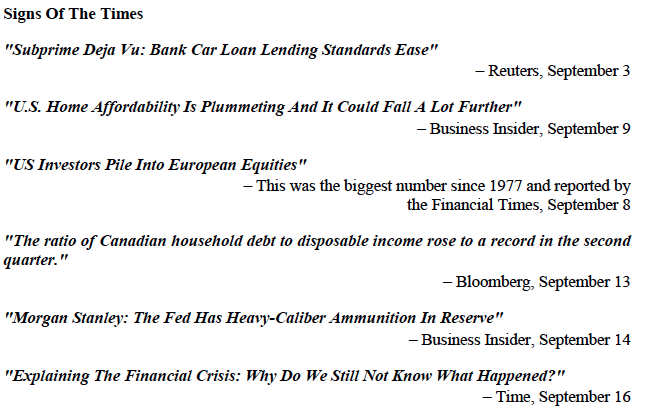
The last two quotes show the absurdity of intellectual theories bereft of market history. In 2007 the establishment boasted that with the “Dream Team” at the Fed nothing could go wrong. Now the same establishment that could have anticipated the bust claims not to understand it. And then there is this week’s tout that the Fed still has some “Heavy-Caliber Ammunition”.
If it wasn’t so pathetic it would be disgusting.
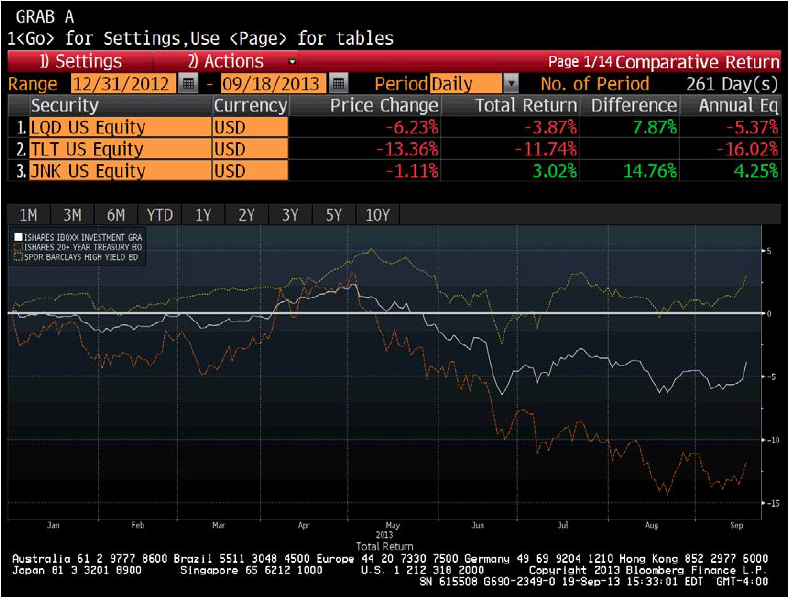
The ability of the Fed to get its portion of a credit expansion “out the door” depends upon a big speculative bid from the private sector. Until May the big play was in lower-grade bonds. This is no longer the case, but through the summer stocks and crude oil have been strong. Yesterday, Bernanke announced that the bond-buying program would continue until unemployment met some arbitrary number. In so many words, he renewed his vows to keep trying to depreciate the dollar.
Markets vigorously responded to the Fed in its role as a catalyst.
* * * * *
Stock Markets
Sunshine likely in September has continued with “Benny Bucks” Bernanke providing an almost universal catalyst.
As they saying goes, “When the Fed is the bartender everyone drinks until they fall down”. More than likely it is an overdose of Kool-Aid.
Technically, we now have something quite clear.
The rally from S&P 1627 in late August made it to 1705 on Tuesday. Yesterday’s news popped it to 1726. Overall this is a multi-index spike up with both the DJIA and S&P reaching a limiting level on the Daily RSI.
This year’s strength drove the Weekly RSI to a higher level for a longer time than accomplished going into the 2007 high. And now at 73 the Daily RSI has exceeded the 66 accomplished in October 2007.
The RSI provided negative divergence on that important peak. A loss of momentum now would accomplish just such a divergence.
What also caught our eye was the reversal in Broker Dealers (XBD). Although this is a volatile and at times precarious sector it has been virtually a “one-way-street” since turning around late last year.
This thing does big and long overboughts on the way up. And at the high in 2007 a couple of rallies reached 70 on the Daily RSI.
For this year, the weekly has accomplished the longest run of very overbought in years. It ran from February to May. Since August there has been two thrusts to 70 on the Daily RSI.
Yesterday, Broker-Dealers (XBD) sold off in the morning and jumped from 140.2 to 141.5 on “the news”. This was up on the day, but in only a few minutes it gave it up. At the end of the day it was down almost 1 percent, setting an Outside Reversal.
It is a warning.
And so is the huge volatility in the gold/silver ratio, which will be detailed below.
Currencies
The dollar index was also volatile as it slumped with Bernanke’s statement.
This drove the DX below support at the 81 level to support at the 80.5 level. This slumped the Daily RSI to 33, which compares to 30 reached with the June plunge.
The ETF is UUP and the RSI declined to 30 yesterday, which compares to 28 set with the low in June. Momentum is at 33 today suggesting a reversal, which in turn suggests a positive divergence.
Last Thursday’s ChartWorks updated the bigger picture on currencies and noted that the euro was showing distribution. This indicates dollar accumulation, which is constructive.
Of course with dollar depreciation considered as the best policy ever and at any time, a rising dollar would be the worst thing that could happen.
Get prepared for the “worst” to happen.
This along with the overbought stock market at this time of year, as well as the outstanding four-year bull market, suggests the financial markets are precarious.
A firming dollar next week would provide confirmation.
The Canadian dollar rallied from 95 in late August to 98 yesterday, which represents serious resistance. The Daily RSI jumped to 68, which ended the past two rallies.
The C$ is heading to support at the 94 level.
Credit Markets
The action in lower-grade bonds suffered a “mini-panic” following the expected reversal in May. The EMB crashed to 99.4 in late June, which was exceptionally oversold. The rebound run out in mid-July at 111.18 and the price declined to 104.60 two weeks ago. The rebound started then and the Bernanke pledge popped the Emerging Bonds to 111.15 yesterday.
Clearly, this is at significant resistance and the Daily RSI reached 72 yesterday. This has accomplished a huge swing from extremely oversold to enough of an overbought to end the move.
Much the same holds for JNK, HYG and MUB.
The reversal in the huge bond market in May ended one of the greatest speculations in lowergrade bonds – ever. Once the natural reversal was in, we expected some churning around through the summer. This would lead to a more severe hit later in the year.
This week’s zoom to an overbought condition seems a timely setup to disorderly markets.
Traders can return to playing the short side and investors should focus upon 3 to 4-year AAA corporates.
Considering the possibility of a firming dollar, this position should be attractive to off-shore investors.
North American bond markets have been corrupted by the US administration and world bond markets by all central bankers, particularly the Fed. Individual investors have been uniquely forced to reach for yield.
At some point spreads will reverse to widening.
Link to September 20, 2013 ‘Bob and Jim Show’ on TalkDigitalNetwork.com:
http://talkdigitalnetwork.com/2013/09/any-chance-of-a-black-october/
All One Bond Market
- Long-dated treasuries (TLT) zoomed up to a spectacular peak in July 2012.
- Despite considerable buying by the US Treasury the bear market prevailed.
- Investors could be concerned about US (or should we say Chicago?) credit worthiness.
- Although the important price-swings have been coordinated, treasuries have been a relative disaster.
- Earlier in the year, we discussed that part of a post-bubble contraction has been the Great Bond Revulsion, which occurs as the street realizes that all of the debt cannot be serviced.
- The next step in the “revulsion” could begin in a few weeks.
- Investors could find a haven and some return in 3 to 4-year Prime Corporates.
BOB HOYE, INSTITUTIONAL ADVISORS
E-MAIL bhoye.institutionaladvisors@telus.net
WEBSITE: www.institutionaladvisors.com

-
I know Mike is a very solid investor and respect his opinions very much. So if he says pay attention to this or that - I will.
~ Dale G.
-
I've started managing my own investments so view Michael's site as a one-stop shop from which to get information and perspectives.
~ Dave E.
-
Michael offers easy reading, honest, common sense information that anyone can use in a practical manner.
~ der_al.
-
A sane voice in a scrambled investment world.
~ Ed R.
Inside Edge Pro Contributors

Greg Weldon

Josef Schachter

Tyler Bollhorn

Ryan Irvine

Paul Beattie

Martin Straith

Patrick Ceresna

Mark Leibovit

James Thorne

Victor Adair