
Timing & trends
China elevated the role of markets in the nation’s economic strategy after President Xi Jinping oversaw a gathering of Communist Party leaders while stopping short for now of unveiling detailed policy shifts. … full article

The US Dollar surged higher last week and the major American stock indices hit New All Time Highs…as the ECB unexpectedly cut interest rates and the Americans reported much stronger than expected employment. Market Psychology, which had been bearish the Dollar and bullish the Euro, shifted to realizing that policies and actions by the Fed and by the ECB may be diverging in the weeks and months ahead. I liquidated my long US Dollar Index positions on Friday Nov 8 after a good two week run…but continue to hold other short currency positions Vs. the USD.
Market prices go up and down, in various time frames, as Market Psychology changes. I try to anticipate whether Market Psychology is going to extend or reverse market trends over whatever time frame I want to trade. For instance, if I think a market has gone up “way too far, too fast” I will watch for a sign that the market has turned down and I will get short…looking for a swift correction as over-leveraged positions are liquidated.
At a recent conference in Calgary, Alberta I used the acronym RAWCTER to describe my trading method…I Research the markets…read analysts, look at charts…I Anticipate what markets might do, but I Wait for a Confirmation that it is Time to Enter the market with the appropriate Risk controls. For instance, I watched the Euro rally (from 1.28 to 1.38) against the USD since the Fed’s “about face” on taper talk in July. My Research caused me to Anticipate that the Euro should be going down not up…but I had no Confirmation that it was Time to Enter the market with a short position so I Waited. As Time went by I Anticipated that the Euro had gone “way too far” (COT data, for instance) and was vulnerable to a sharp correction, or more, if there was ever a catalyst for a change in trend. In other words, I Anticipated a coming reversal in Market Psychology, but I Waited for the market to set-up…waited for some Confirmation that it was Time to Enter the trade…I respected what the Euro was doing…rising…even though I thought it should be falling.
Chart Section: 16 Charts Give Us Direction
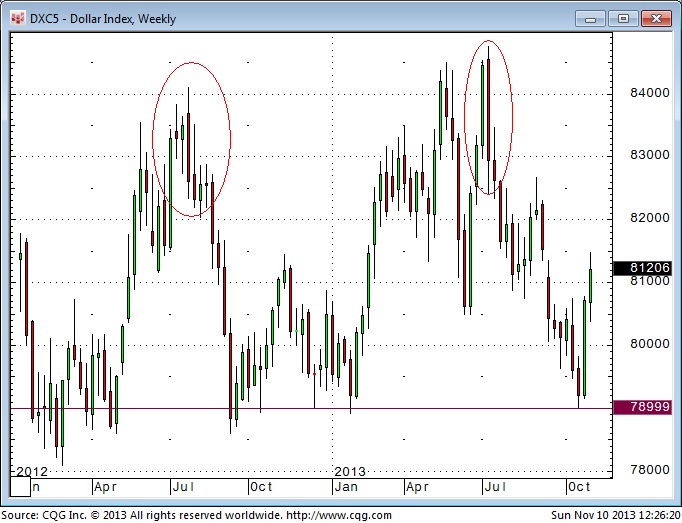
US Dollar Index – Weekly: The USD had (circled) Weekly Key Reversals down in July 2012 and July 2013. The market had another WKR down in October 2013 and I thought that it was getting very over-sold as it approached chart support (red line) around the 7900 level. I Anticipated that it would turn around, but I Waited for a Confirmation that a rally might be starting.
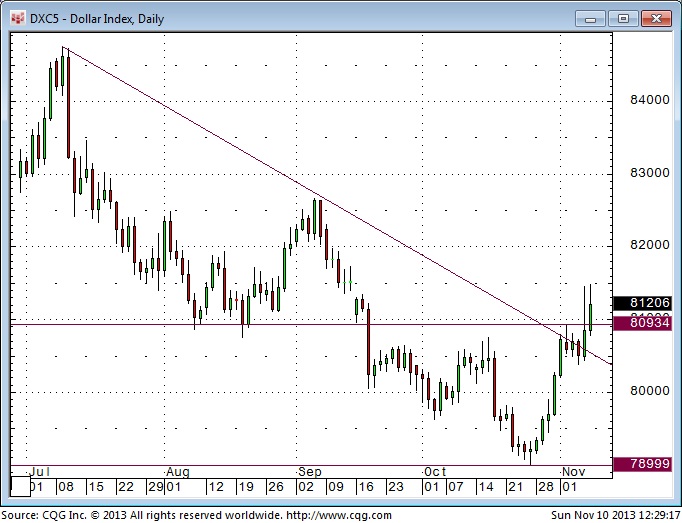
US Dollar Index – Daily: I bought the USD two days after it bounced off the 7900 support level. I had Anticipated that the market was very oversold and due for a rally. Since I was “picking a bottom” to a strong downtrend I need clear Risk controls…so I bought only 50% of a normal position size and planned to bail out if the market made new lows. Prices ran into some resistance around the 8100 “support/resistance” level and the downtrend line from the three year highs made in July. The market spiked higher on the ECB announcement last Thursday but gave up more than half of its gains by the end of the day. The market rallied again Friday on the American jobs report but could not take out the previous day’s highs. So despite making gains on both Thursday and Friday I felt that the market was struggling…so I took profits on my long positions and return to the safety of the sidelines. From the sidelines I can now look at the market as an agnostic…without having to “defend” my positions. At the moment I’m predisposed to looking for a spot to buy the USD.
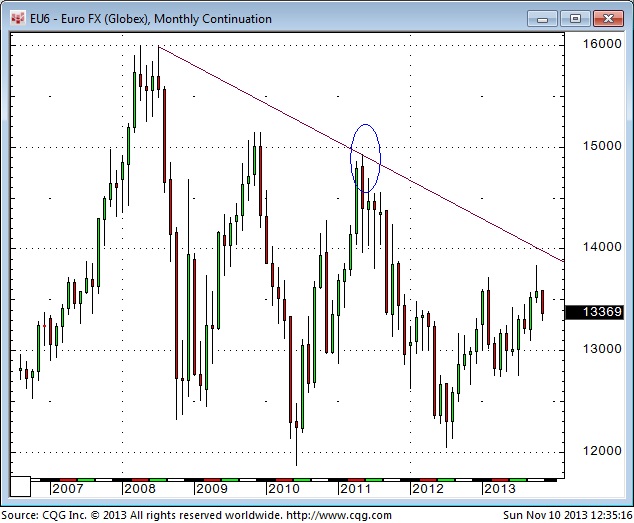
The Euro – Monthly: The Euro traded to All Time Highs in early 2008 and then fell sharply during the financial crisis as people everywhere sought the safety of the US Dollar. The circled area on the chart notes the high made in May 2011…a date I have frequently referred to as a Key Turn Date across a number of markets. The market has registered big price swings over the past few years…and seems to trending lower…
…view & read the other of 16 charts HERE
INSIDE THIS ISSUE
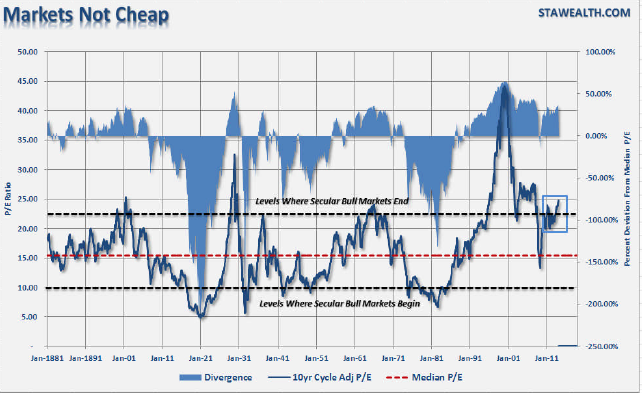
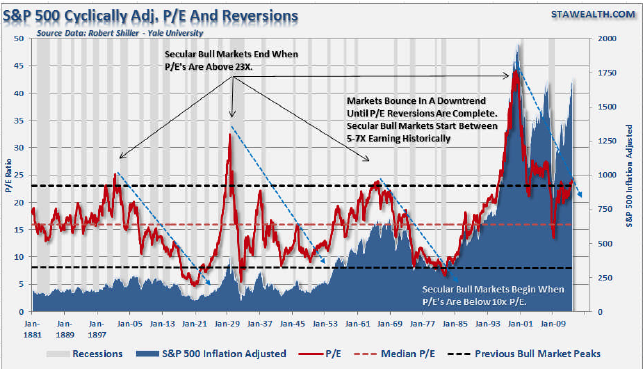
- Signs Of A Market Top
- Valuation & Deviation
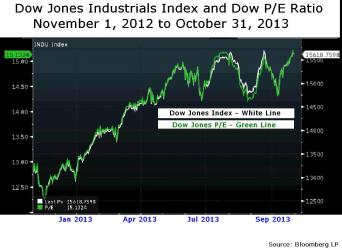
- Technicals
Sector Analysis
- Major Markets
- S&P 500 Strong Sectors
- S&P 500 Weak Sectors
- Interest Rates, Gold, Oil
Suggested Reading
- 5+1 Things To Ponder
- GDP-A Restocking Story
- LEI-Fed Skewing Data
- Fed Won’t Taper Soon
- Economy In Pictures
- Bond Strategies
The Market In Pictures
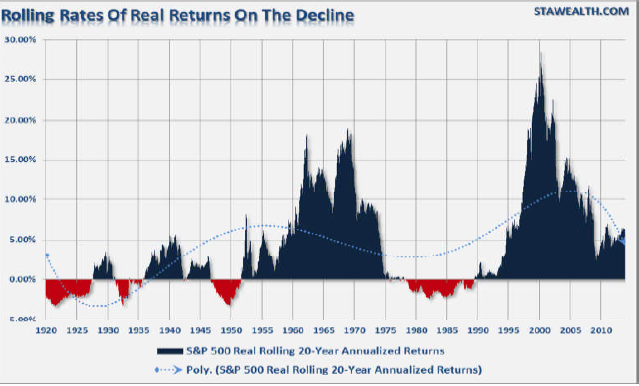
This past week I wrote an article entitled “The Economy In Pictures”which was a pictorial tour of various aspects of the economy to let you decide for yourself about the real strength, or weakness, of the economy.
This past week we got two economic reports, GDP and Employment, which blew past consensus expectations at the headline number. The problem, however, is that the internal details of the reports told a very different story. For example, the bulk of the surge in the GDP report came from unwanted inventory builds as consumption has slowed. Much of the same was evident in the October jobs report that showed a headline increase of 204,000 jobs even as over 900,000 individuals left the workforce entirely.
This is very representative of the problem that has existed for much of the past 4 years. While there has been a sluggish “statistical”economic recovery because of the way things are counted; the“actual” recovery on “Main Street” has been starkly different.
Yet, even as I write these words, the stock market has been pushing all-time highs as the Federal Reserve remains committed to its current liquidity programs. There are relatively few headwinds ahead of the market currently and even the upcoming return of the debt ceiling debate in January is likely to be a fairly quiet and non-market moving event.
Therefore, the bias of the market at the moment remains to the upside as technical trends remain in place. The control is currently in the grasp of the bulls and we remain allocated to the markets currently. However, that does not mean that it can’t, and won’t, change in the future. It will. What goes up will come down and the farther from the earth the market has traveled the greater the fall will be.
This week’s missive will have minimal commentary. However, I present to you the market in pictures so that you can judge for yourself.
.….read more and view 26 more pictures HERE
Lance Roberts is the General Partner & CEO of STA Wealth Management, Host of the “Streettalk Live” Daily Radio Show (streamed live at www.streettalklive.com), and Chief Editor of the X-Report and the Daily X-Change Blog.
Follow me on Twitter: @streettalklive


Last month, for the first time I could recall, Ben Bernanke, the Chairman of the U.S. Federal Reserve, claimed that he was concerned about the U.S. Labor Force Participation Rate (See chart above).
This morning it was reported that the Participation Rate fell again in October to 62.8% from 63.2% in September. The last time it was this low was 1978.
The Participation Rate is defined as the employed percentage of the total number of people who are able to work. Social benefits are a major contributor to this statistic, especially in times when it is more difficult to get a job.
The challenge for Ben Bernanke, Janet Yellen (the presumptive future chairman), and the Federal Reserve is to find new ways to improve the Participation Rate if they truly consider it to be important. This is because their current policy of Quantitative Easing-related money-printing has not done a thing. All the way through the QE era, the trend in Labor Participation has been down. So much for $3 trillion in monetary expansion.
If anything, this will cause the Federal Reserve to delay the start of the Tapering of the current round of Quantitative Easting (QE3) and/or slow the pace of Tapering once it does start. This will create some foundation under stock prices and help to limit sudden drops in the bond market (even though the 32-year secular bull market in bonds ended in July 2012).
The opinions expressed in this report are the opinions of the author and readers should not assume they reflect the opinions or recommendations of Richardson GMP Limited or its affiliates. Assumptions, opinions and estimates constitute the author’s judgment as of the date of this material and are subject to change without notice. We do not warrant the completeness or accuracy of this material, and it should not be relied upon as such. Before acting on any recommendation, you should consider whether it is suitable for your particular circumstances and, if necessary, seek professional advice. Past performance is not indicative of future results.
Richardson GMP Limited, Member Canadian Investor Protection Fund.
Richardson is a trade-mark of James Richardson & Sons, Limited. GMP is a registered trade-mark of GMP Securities L.P. Both used under license by Richardson GMP Limited.
Energy Trends Are Kind To Investors
The energy industry’s unique place in the global economy creates an endless stream of bull markets and big trends.
For example, recently the big trends have been hitting one after the other, producing gains like…
– 1,157.63% gains from the bull market in solar – enough to turn a $20k investment into $178,000…
– 1,689.94% gains from the bull market in oil tankers – enough to turn every $20k invested into $357,988…
– 2,431.745% gains from the bull market in North American on-shore drill rigs – enough to turn every $20k invested into $506,350…
These are five trends investors should be paying the most attention to right now because so much industry money is piling into them…
1. The Super Boom in Subsea Infrastructure. The Oil & Gas industry is increasing investment FIVE TIMES over from $27 billion a year to $130 billion a year on new unseen infrastructure.
2. The Boom in Oil Production technology that is TRIPLING the value of existing wells: It’s an investor’s dream-come-true because it is the equivalent of re-discovering every known oil-field TWICE OVER.
3. The Boom in Hyper Oil & Gas Hunting. New technology discovers new oil & gas fields FIFTEEN TIMES FASTER than earlier methods. This tech is sweeping through the industry like wild-fire as explorers race to find new fields first… but the tech is where investors will make the biggest returns, the fastest.
4. The $200 Billion Boom in Specialized Engineering Firms: A pipeline of $10 billion + projects easily totaling over $200 billion will likely make these engineering firms – and their investors – rich
5. The Multi-Billion Dollar Shale Revolution Goes Global.
For Example, 2. The Boom in Oil Production Technology that is Tripliing the value of existing oil wells works like this:
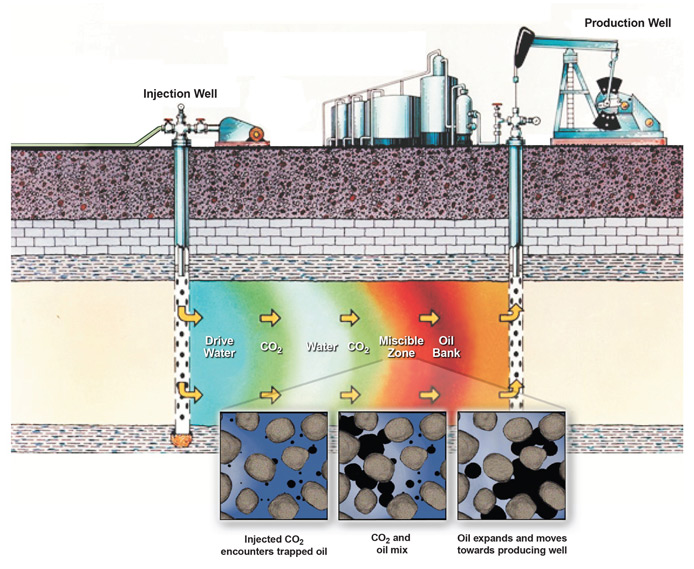
Step one: Capture CO2, Carbon gas, emitted by the refiners. Full operations will capture 90% of carbon dioxide emitted by refiners – enough to condense the carbon impact of 10 refineries essentially down to the size of one.
Step two: The CO2 is then transported directly to oil wells.
Step three: Where it is injected into the ground to increase pressure in the wells. When the CO2 mixes with the trapped oil the oil EXPANDS. The increased pressure pumps the oil out.
So for every $1 of oil produced in existing wells this process produces $2 more.
Just one oil field south of Houston, Texas, is looking at an increase from 1.6 million barrels of recoverable oil to 3.1 million barrels.
This technology is a MAJOR NEW PROFIT CENTER for the oil industry.
If you can consistently get in front of these big trends then you can produce staggering gains.
For example, if you’d been investing along industry insiders and caught the solar boom in 2006 you could’ve turned a $10,000 investment in First Solar into $125,763 in three short years.
Then, if you grabbed the next big energy trend, the shale railroad boom (The boom in rail was caused by the overabundance in shale oil overwhelming existing pipelines), you could’ve turned that $125,000 into $669,012 in another four years.
That’s just two energy trends but together they could’ve turned your $10k initial investment into over $669,000 in about 7 years.
To put that in perspective consider the S&P 500 during the same period delivered a cumulative 7-year return of just 14.24% – or only enough to grow a $10,000 investment into $11,424.
James Stafford

-
I know Mike is a very solid investor and respect his opinions very much. So if he says pay attention to this or that - I will.
~ Dale G.
-
I've started managing my own investments so view Michael's site as a one-stop shop from which to get information and perspectives.
~ Dave E.
-
Michael offers easy reading, honest, common sense information that anyone can use in a practical manner.
~ der_al.
-
A sane voice in a scrambled investment world.
~ Ed R.
Inside Edge Pro Contributors

Greg Weldon

Josef Schachter

Tyler Bollhorn

Ryan Irvine

Paul Beattie

Martin Straith

Patrick Ceresna

Mark Leibovit

James Thorne

Victor Adair