

The US Dollar surged higher last week and the major American stock indices hit New All Time Highs…as the ECB unexpectedly cut interest rates and the Americans reported much stronger than expected employment. Market Psychology, which had been bearish the Dollar and bullish the Euro, shifted to realizing that policies and actions by the Fed and by the ECB may be diverging in the weeks and months ahead. I liquidated my long US Dollar Index positions on Friday Nov 8 after a good two week run…but continue to hold other short currency positions Vs. the USD.
Market prices go up and down, in various time frames, as Market Psychology changes. I try to anticipate whether Market Psychology is going to extend or reverse market trends over whatever time frame I want to trade. For instance, if I think a market has gone up “way too far, too fast” I will watch for a sign that the market has turned down and I will get short…looking for a swift correction as over-leveraged positions are liquidated.
At a recent conference in Calgary, Alberta I used the acronym RAWCTER to describe my trading method…I Research the markets…read analysts, look at charts…I Anticipate what markets might do, but I Wait for a Confirmation that it is Time to Enter the market with the appropriate Risk controls. For instance, I watched the Euro rally (from 1.28 to 1.38) against the USD since the Fed’s “about face” on taper talk in July. My Research caused me to Anticipate that the Euro should be going down not up…but I had no Confirmation that it was Time to Enter the market with a short position so I Waited. As Time went by I Anticipated that the Euro had gone “way too far” (COT data, for instance) and was vulnerable to a sharp correction, or more, if there was ever a catalyst for a change in trend. In other words, I Anticipated a coming reversal in Market Psychology, but I Waited for the market to set-up…waited for some Confirmation that it was Time to Enter the trade…I respected what the Euro was doing…rising…even though I thought it should be falling.
Chart Section: 16 Charts Give Us Direction
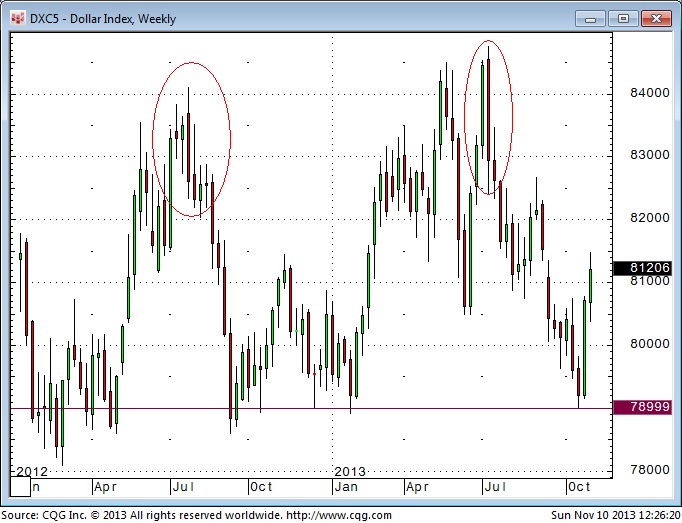
US Dollar Index – Weekly: The USD had (circled) Weekly Key Reversals down in July 2012 and July 2013. The market had another WKR down in October 2013 and I thought that it was getting very over-sold as it approached chart support (red line) around the 7900 level. I Anticipated that it would turn around, but I Waited for a Confirmation that a rally might be starting.
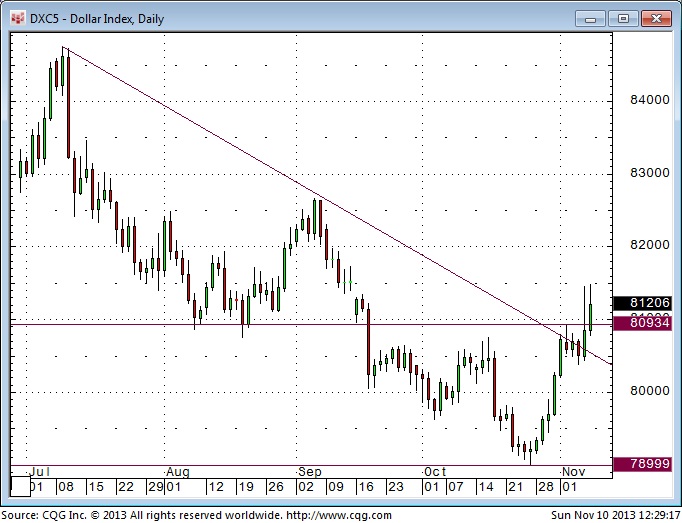
US Dollar Index – Daily: I bought the USD two days after it bounced off the 7900 support level. I had Anticipated that the market was very oversold and due for a rally. Since I was “picking a bottom” to a strong downtrend I need clear Risk controls…so I bought only 50% of a normal position size and planned to bail out if the market made new lows. Prices ran into some resistance around the 8100 “support/resistance” level and the downtrend line from the three year highs made in July. The market spiked higher on the ECB announcement last Thursday but gave up more than half of its gains by the end of the day. The market rallied again Friday on the American jobs report but could not take out the previous day’s highs. So despite making gains on both Thursday and Friday I felt that the market was struggling…so I took profits on my long positions and return to the safety of the sidelines. From the sidelines I can now look at the market as an agnostic…without having to “defend” my positions. At the moment I’m predisposed to looking for a spot to buy the USD.
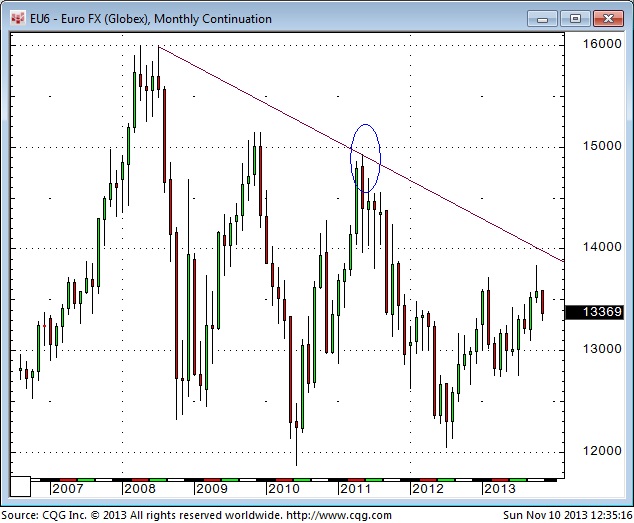
The Euro – Monthly: The Euro traded to All Time Highs in early 2008 and then fell sharply during the financial crisis as people everywhere sought the safety of the US Dollar. The circled area on the chart notes the high made in May 2011…a date I have frequently referred to as a Key Turn Date across a number of markets. The market has registered big price swings over the past few years…and seems to trending lower…
…view & read the other of 16 charts HERE


