
Timing & trends
“Suddenly, everyone’s worried about the bond market. The yield on the 10-year Treasury rose seven times in eight days. On Wednesday and Thursday, the yield got to 2.25%, which is the highest in two months.
Of course, some of this needs to be put in context. Bond yields are hardly high; they’re just higher than where they were a few weeks ago, and that was pretty darn low. The 10-year yielded 3% in early 2014, and we’re still well below that.
The 10-year yield gained 31 basis points in eight sessions. That’s enough to get people’s attention. This may sound like blasphemy, but I think some of the strength in bonds is due to a stronger economy. The evidence isn’t in just yet, but I suspect the bond market is already placing its bets.
GDP for Q1 was bad. This week’s trade data indicates that the revisions will be even worse. In fact, it’s very likely that Q1 was negative. But that data is already somewhat aged. The first quarter ended more than five weeks ago. The recent initial jobless claims have been quite strong. These are some of the lowest numbers we’ve seen in decades.
We’re also seeing that commodity prices are on the rise. Oil, in fact, has been hot. On Wednesday, West Texas Intermediate got as high as $62.58 per barrel. That’s up $20 per barrel from the March low. (Anyone else remember in February when Citigroup said oil could fall to $20 per barrel? Yeah, me neither.)
The sour mood for bonds has been mirrored in the stock market by an increase in cyclical stocks. The chart below shows how the relative strength of Tech Stocks (XLK, black line) has closely followed the path of the 10-year Treasury yield (blue line). You can see it’s a pretty close fit.”

….read more HERE


Signs of The Times
“$53 trillion of all global bonds have negative yields, of which 60% are European.”
“Central bank assets now exceed $22 trillion, equivalent to the combined GDP of US and Japan.”
−Zero Hedge, April 21.
What a promotion!
Members of our Friday lunch group have been in the markets for a long time and recently we recalled a really blatant Vancouver promotion. It was so obvious that “even the crooks called it a ‘crooked deal’.”
There is nothing more dangerous than academic economists craving fame and Wall Streeters craving instant wealth.
This racket is becoming increasingly eligible to a bout of professional infamy.
In the meantime:
“A four-year-old auto finance company…sold $149 million bond deal consisting of car loans made to borrowers considered so subprime you might call them–dunno–sub- subprime?”
−Bloomberg, April 22.
“Wall Street’s biggest names are getting their mojo back. The results were particularly notable at Goldman, which received a big boost from its trading desk–a core focus for the firm.”
−Wall Street Journal, April 17.
“Stunned…Despite soaring stock markets and low gas prices, Consumer Confidence tumbled to 95.2 (against expectations of a jump to 102.2. The March figure was 101.4).”
−Zero Hedge, April 28.
This is noted as the biggest miss since June 2010.
*****
Stock Markets
Bigger Picture:
In the face of such remarkable financial speculation, it seems appropriate to review the intentions of policymakers. The notion of a “lender of last resort” was behind the advent of the Fed. That with a “flexible” currency would provide stability. After all–nasty financial setbacks that initiated recessions would be prevented.
Fabulous idea. And it is still a fable.
Now, why are stocks up when Consumer Confidence (CCI) is plunging?
CCI may not be moving on seasonal pressures, the stock market has been on a seasonal rally.
This goes back to October when the seasonal decline generated a Springboard Buy. The “natural” next leg up would likely run into around May. Other guidance was that when the crude crash ended it would prompt a stock market rally of around three months.
That gets us to, well, around now and there are no doubts about another eruption of private- sector speculative activity. Central banking is still controlled by speculators and they are still in a speculative mode.
And as we have been noting, this is the season when virtually straight-up action can erupt and then collapse. Our April 9th Pivot outlined that this could be accomplished within eight weeks. Next week is Week Four and in the US, IBB has been surging. New issues in China have been, as the saying went, “out of sight”. That’s in the number of IPOs and as in straight up.
Often this type of rally is called “parabolic”. Mathematically, this implies that the curve can be solved. This is not the case, as the ending action of a mania is a skewed growth curve and there is no formula for it. In so many words, a computer cannot solve it and predict its end.
Don’t despair.
There is the “analogue model”. Each such blowoff has had similar characteristics and the chart of one example overlays another example. The Daily chart of the South Sea Company (let’s call it SSC) in 1720 is remarkably similar to that of RCA in 1929, Cisco in 2000, housing was the phenomenon in 2007 and IBB is a good example now.
SSC peaked in June of that fateful year; RCA in May, with the test at the same level in that fateful September; Cisco set its peak in late March, made the test in July and died; IBB set what could be a peak in late March and is struggling after the test in April.
Representative examples in Shanghai seem to be taking a break from the rapture mode.
The record is that each bubble, in its day, was the greatest financial speculation in history. For each set of participants, a culmination was unthinkable. For those who were thinking it would be at a higher level.
In reaching for perspective, it is reasonable to conclude that this one really is different. It includes an global bubble in bonds that is without precedent. And it is coming apart–big time!
Last week’s conclusion in Stock Markets was: “We should soon start considering the probability of a liquidity crisis.”
It is arriving.
Nearer Term:
The old Dow Theory has been providing some guidance. Non-confirmations by the Transports of the general rising trend has been “on” since the first of March. We have considered this as an alert, which is becoming more acute this week
Last week, the TRAN rally stopped at the 50-Day. This week it’s been below the 200-Day at 8700. The dive into early April stopped at 8527 and taking this out would set an intermediate downtrend. Taking out the October low of 7700 would be very bearish.
Biotechs (IBB) accomplished a surge to to 375 in March. This was sensational enough to register a “Trifecta”, which is Upside Exhaustions on the Daily, Weakly and Monthly readings.
Ross had an initial target, which provided support and the bounce tested the high at 368. The April low was 334 and at 334 now it is threatening that support. It is also well below the 50- Day moving average.
As noted, this surge of speculation is exceptional, which represents a compulsion that will not quit quietly.
Our view has been that the when the “around May” surge burns out, a summer of consolidation would be probable. Enough of a change in credit markets could force an overall contraction.
US credit spreads widened until the mini-panic completed in January. This was part of the crash in crude and narrowing lately is on a seasonal move that could end “around May”.
Last year’s reversal to widening started at 143 bps in June and the worst was 212 bps in January. So far, the best on this has been 176 bps this week. This is testing the initial “rebound” into March.
This correction in the main trend of widening could reverse within the next 4 weeks or so. Getting beyond 187 bps would technically resume the trend.
After flattening for some 16 months and it within the time window when reversal has been probable. The most for the move was accomplished a couple of weeks ago. Breaking below the 50-Day ma would be an alert to change.
Again, we should repeat our Consumer Product Warning. Reversals in spreads and the curve have anticipated significant contractions and, what’s more, the senior central bank has been unable to prevent the change.
Long-dated Treasuries soared to an exceptionally overbought condition in late January. Our special study of January 20th “Ending Action” called for the end of the great bull market that began in the financial crisis of 1981.
The ChartWorks of February 2nd reviewed technical excesses then and last Wednesday published “Noteworthy Break in Bonds”.
In a couple of Pivots, the comment was that the reversal in the US market would eventually encompass the even greater mania in European bonds.
Last Wednesday’s special on bonds observed that the German yield seemed to be reversing. That was at 0.10% and a break above 0.20% would reverse the trend. That was accomplished on yesterday as the yield soared to 0.29. Today it has reached 0.37%.
And the ECB was buying at below 0.10%. This blunder could rank with defending the pound when Soros was short in 1992.
Sure, the numbers are small but the change is big.
Using the TLT, the high for the US bond was 137.66 at the end of January and the initial low was 122.71 in early March. The rebound made it to 132.48 in late March. Since then the trade has followed the declining 50-Day ma. Declines this week have taken the price down to 124.51. It only took three days to plunge below the 50-Day
While the bull market for Treasuries was on, there was little point in reviewing the history of real interest rates (as adjusted for inflation). On every great bubble real long rates in the senior currency have declined to significant lows. In some cases such as in 1873 the yield declined to negative. In 1929 it did not. In 2007 the declined was to minus 1.5%.
The main thing is that on the five examples from 1720 to 1929 the typical increase was 12 percentage points. In the 2008 financial collapse the real yield jumped from -1.5% to +6%. Bad enough, but obviously not enough to end the abuse of the credit markets, otherwise known as a “New Financial Era”.
In each case, the increase was accomplished through rising nominal interest rates as commodities decline. A more thorough update on real interest rates will follow. “.
Commodities
Generally, most commodities were likely to rally into “around May”.
Crude ended its crash in January at 43, which was tested at 42 in March. Now at the 59 level, the Daily RSI has had a huge swing from very oversold to almost overbought. The ChartWorks notes that momentum is enough to register a Springboard Sell, which could become effective over the next few weeks.
Energy stocks (XLE) have rallied from 71 in January to 83.25 earlier today. This touched the 40-Week ma, which represents resistance. It is a good gain in a volatile world and money should be taken off the table.
Commodity index, DBC, has rallied from 16.84 in January and the test at 16.71 in March. Now at 18.25, the RSI has had a good swing from very oversold to almost overbought. There is resistance at the 18.40 level and there is only a few weeks left on the favourable season.
Within this, base metals (GYX) set lows at 300 in January and March. The latest rally bounced off the 50-Day and is accomplishing an outstanding swing on the Daily RSI Mining stocks (SPTM) have rallied from 513 in January to 794 earlier today. This is becoming overbought in the window of opportunity. The opportunity now is to take money off the table.
Lumber became exceptionally oversold in April and the best that can be said about the chart is that it is trying to find stability. Tree stocks such as WY are in a similar pattern. We would avoid the sector.
In January we looked to the possibility of a “rotation” whereby depressed commodities could rally. This has essentially been accomplished and there is little point in staying in the trade.
Precious Metals
Gold stocks (GDX) rallied from 16.34 in November to 23.22 in January. That was right at the 40-Week ma and the next low was 17.29 in March. The latest rise made it to the 200Day earlier today and has retreated. This is not healthy.
For a sustainable rally in the sector, gold stocks would have to outperform the bullion price. The ratio has rallied from .152 in December to .181 yesterday. This has been good but the problem now is that it reached the 200-Day, which has been declining and offering resistance on every rally attempt.
The other constructive essential would be silver outperforming gold. The silver/gold ratio set a low at .129 in November and made it to .143 in March. The declining 200-Day ma ended that rally and the chart looks weak.
The high for the GDX was 20.90 yesterday and it has slipped to 20 today.
Our advice in November was to accumulate some gold stocks into weakness. We did not get fully invested. Our concerns have been that another liquidity crisis could be discovered after mid-year and it would not be good for most precious metal stocks.
The next crisis seems to have started and we would take money out of gold stocks.
Today’s weakness in gold and silver in the face of a steady dollar is interesting. At the open, silver was very weak relative to gold.
Let’s look at the gold/silver ratio. The key low was 69.4 on March 23rd and the bounce was to 76.4 last Thursday. The drop was to 72 on Tuesday and it popped to 73 yesterday and this is starting to tell a story.
When the ratio goes up it signals a pending credit contraction and in looking at the action this week, rising through 77 would set the uptrend. This would indicate a developing credit crisis.
The bottoming process in the Precious Metals sector will be prolonged.
In the meantime, gold’s real price has sharply corrected from its high in January. We use our Gold/Commodities Index to keep track. The low was 340 in June and we have considered that that set the beginning of a cyclical bull market. The high was a screamingly overbought at 505 in January and the correction has been to 450 in February and this week. This is oversold on the Daily RSI and support should hold.
Our long-term mojo has been that the cyclical bull market for gold’s real price will eventually pull gold shares up.

-
The 40-Day exponential moving average has provided key support on each correction.
-
This was violated in early April.
-
This week’s retreat from trying to rally above the moving average is a failure.
- This is threatening key support at 75, the March low.
BOB HOYE, INSTITUTIONAL ADVISORS E-MAIL bhoye.institutionaladvisors@telus.net
WEBSITE: www.institutionaladvisors.com
First, this flash update. The Dow lost 142 points yesterday, which, in today’s volatile market, is no big deal.
Nevertheless, our proprietary short-term stock market indicator has turned starkly negative, as shown below:

Yes, the near-term outlook is darkening. Our model suggests a MINUS 6.4% return from the stock market over the next 94 days. Take warning.
As to the long-term outlook…
The Longest, Deepest Depression in US History
Yesterday’s good news was that there will be no 25-year recession. “We should be so lucky,” is the way a New Yorker might react. Because the bad news is much worse.
The logic of the “long depression” is simple. Aging populations, debt, zombification – all of which slow growth.
How many old people and zombies do you need before an economy comes to a halt?
Nobody knows. But the drag from debt is observable and calculable.
Over the last three decades, approximately $33 trillion in excess debt has been contracted – above and beyond the traditional ratio to income – in America alone. And growth rates have fallen in half.
That’s because dollars that would otherwise support current spending are instead used to pay for past spending. Our old debts have to be retired with current income.
The money doesn’t disappear, of course. Some goes to creditors who spend it. Some comes back as capital investment, which is a form of spending. But as credit shrinks, generally, so does the economy.
And that brings us to the impossible situation we’re in now.
In order to get back to a healthy ratio – say approximately $1.50 worth of debt for every $1 in income – you’d need to erase all that excess that has already been contracted. In other words, you’d have to take $1 trillion out of the consumer economy every year for the next 33 years.
It would be the longest and deepest depression in US history.
A Credit Crisis, Complete with Howling, Whining, Finger-Pointing
Take a trillion out of the US economy and you have a 4% decline in GDP. Then, as the economy declines, the remaining debt burden becomes even heavier.
Try to pay down debt and it becomes harder and harder to pay down. You stop buying in order to save money. Your local merchants lose sales. Then they try to cut expenses, and you lose your job.
In other words, no “steady state slump” is possible.
When the credit cycle turns, it will not be a gentle slope, but a catastrophic cliff… a credit crisis, complete with howling, whining, finger-pointing… and more clumsy rescue efforts from the feds.
As we said yesterday, there are two solutions to a debt crisis. Inflation or deflation.
Central banks can cause asset price inflation. But it is not always as easy as it looks. Consumer price inflation requires the willing cooperation of households.
With little borrowing and spending from the household sector, credit remains in the banks and the financial sector. Asset prices soar. Consumer prices barely move.
US consumer price inflation over the last 12 months, for example, was approximately zero.
The assumption behind the “long depression” hypothesis is that central banks cannot or will not be able to cause an acceptable or desirable level of consumer price inflation. As a result, the economy will be stuck with low inflation, low (sometimes negative) growth and low bond yields.
But what about deflation? If inflation won’t reduce debt, why not let deflation do the job?
More tomorrow…
Regards,
Bill

 We Can’t Rein In the Banks If We Can’t Pull Our Money Out of Them
Stocks in long term upward trends often make pullbacks as short term minded investors take profits. There is an opportunity to buy these stocks when they break their pull backs. This week, I ran the Pull Back Play Canada market scan and found a couple of strong stocks that look like they may continue their long term upward trends.
STOCKS THAT MEET THE FEATURED STRATEGY
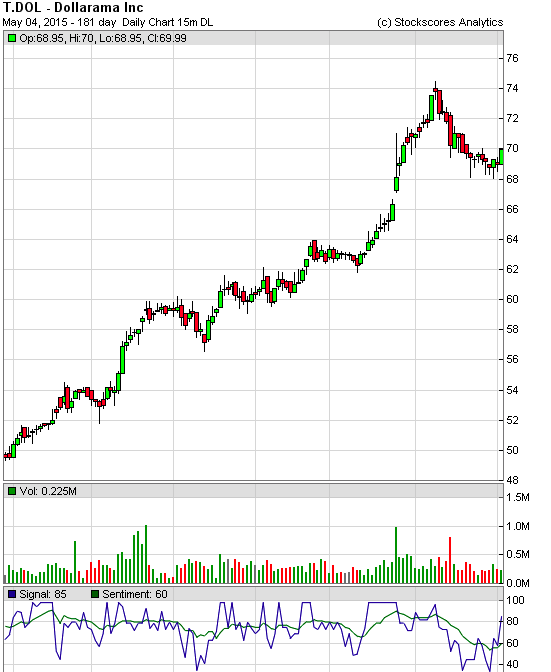
1. T.DOL
T.DOL has been falling for the last three weeks and that has taken the stock back to the long term upward trend line. Today, the stock broke the pullback, setting it up for a swing trade on a resumption of the trend. Support at $68
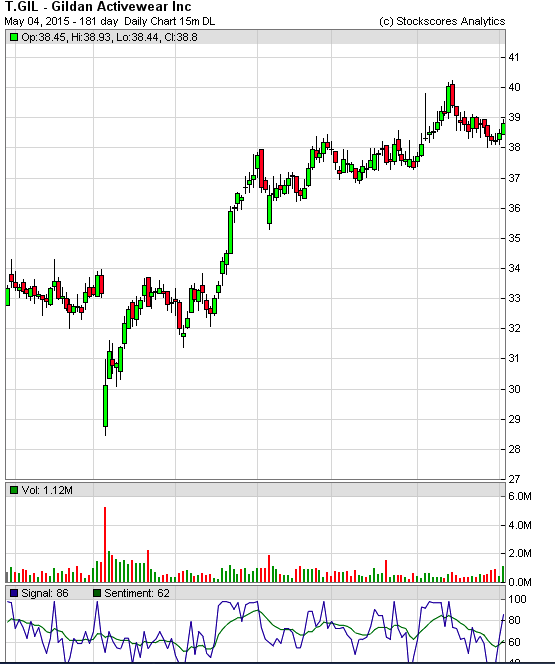
2. T.GIL
T.GIL has been a leader in the Canadian market for three years and looks like it may continue the long termupward trend soon. Breaking today from a two week pullback, should move higher in the weeks ahead. Support at $38.
WEEKLY COMMENTARY
Avoid the Negatives
As investors, our natural inclination is to seek out stocks that have good qualities. We look for reasons to buy the stocks we are considering and often forget to look for the negatives. Since there are thousands of stocks to consider and almost all of them can have some reason for buying them, it may be better to reverse how we approach the analysis of stocks. Looking for reasons not to buy a stock will emphasize a higher standard for the stocks you do buy and will help to improve your overall market performance.
Here is a list of common reasons I use to throw a stock out of consideration:
Too Much Volatility
Volatility is uncertainty. Virtually every good chart pattern that I use to find winners demonstrates a break out from low volatility. The narrower the range before the breakout, the more important the breakout becomes. If the stock’s price is moving all over the place before it makes a break through resistance then there is a much greater chance that the breakout is false and will likely fall back. Ignore stocks that have a lot of price volatility before the break out.
Not Enough Reward for the Risk
A stock can go two ways, up or down, after you buy it. If the upside potential is not enough to justify the downside risk, then you should ignore the opportunity. I like stocks to have at least double the upside potential for the downside risk. That way, you don’t have to be right even half of the time to make money, provided you are disciplined of course.
Lack of Optimism
Fundamentals do not matter. It is the perception of Fundamentals that matter. If investors are not showing some optimism about a company’s prospects then it is likely that they are not paying any attention to the company’s fundamentals. Look for rising bottoms on the chart as an indication that investors are optimistic, if there aren’t any, leave the stock alone.
No Abnormal Behavior
The stock market is efficient most of the time. That means that you can not expect to consistently beat the stock market because all available information is priced in to the stock and your success at predicting new information can only be random. To beat the market, we have to look for break downs in market efficiency. I find that the best way to do this is look for abnormal behavior in the trading of a stock because it implies that there is significant new information playing a role in the stock’s performance. I don’t consider any stock that lacks abnormal behavior in its recent trading.
Too Far Up
The higher a stock goes, the riskier it becomes. I don’t like to chase stocks higher. If I look at a 6 month chart of a stock and it has made more than two steps up, I don’t consider it. A one day run of substantial gains is not a concern; I want to ignore stocks that have been in upward trends for some time. Look for stocks that are breaking from periods of sideways trading, not up trends.
Lack of Liquidity
The more often a stock trades, the easier it is to get in and out of it. Stocks that are not actively traded tend to have wider spreads between their bids and asks and it can be difficult to move in and out of the stock. Don’t consider stocks that don’t trade every day and they should trade at least 50 times a day but more is better.
Mixed Messages
I always try to look at a stock’s chart on more than one time frame. If the message is not the same on both charts, I leave them alone. When day trading, look at the daily and intraday charts. When position trading, look at the daily and weekly charts.
Any time you think a stock has great potential, give this list a look and see if any of these factors show up. If so, it may be a good idea to move on and look for something else.
Stockscores Free Webinar – How I Day and Swing Trade the Market
Wednesday May 6 – 11:00 am PT, 2:00 pm ET
Stockscores founder Tyler Bollhorn will demonstrate his processes and tools for identifying day and swing trades live during the trading day. See some of the trades that fit his requirements before the market close.
Stockscores Free Webinar – The Secret to Finding Hot Stocks
Saturday May 9 – 11:00am PT, 2:00 pm ET
For over 25 years, Stockscores founder Tyler Bollhorn has been picking winning stocks using one simple concept. During this webinar, you will learn his secret for finding the hot stocks of the future and get a demonstration of the tools he has built to find them.
For a complete list of upcoming webinars, go to www.stockscores.com/webinars
Stockscores Market Minutes Video – When Good Stocks Go Bad
Some good looking stocks are capable of big gaps to the downside causing big losses for their owners. This week, I discuss why this happens and how to avoid it. Plus, my regular weekly market analysis.
References
- Get the Stockscore on any of over 20,000 North American stocks.
- Background on the theories used by Stockscores.
- Strategies that can help you find new opportunities.
- Scan the market using extensive filter criteria.
- Build a portfolio of stocks and view a slide show of their charts.
- See which sectors are leading the market, and their components.
Disclaimer
This is not an investment advisory, and should not be used to make investment decisions. Information in Stockscores Perspectives is often opinionated and should be considered for information purposes only. No stock exchange anywhere has approved or disapproved of the information contained herein. There is no express or implied solicitation to buy or sell securities. The writers and editors of Perspectives may have positions in the stocks discussed above and may trade in the stocks mentioned. Don’t consider buying or selling any stock without conducting your own due diligence.

-
I know Mike is a very solid investor and respect his opinions very much. So if he says pay attention to this or that - I will.
~ Dale G.
-
I've started managing my own investments so view Michael's site as a one-stop shop from which to get information and perspectives.
~ Dave E.
-
Michael offers easy reading, honest, common sense information that anyone can use in a practical manner.
~ der_al.
-
A sane voice in a scrambled investment world.
~ Ed R.
Inside Edge Pro Contributors

Greg Weldon

Josef Schachter

Tyler Bollhorn

Ryan Irvine

Paul Beattie

Martin Straith

Patrick Ceresna

Mark Leibovit

James Thorne

Victor Adair