
Stocks & Equities
Tonight I would like to start out by looking at the $CDNX, Canadian Venture Composite Index, which blasted higher last week and is following through this week. The reason this index is so important is because it not only has many junior precious metals stocks, but also many small cap energy related stocks as well as other speculative venture capital stocks from other sectors. This is a very good sign for the overall stock markets and commodities in general, as it shows risk capital is finding a home in which to park. This is another important clue that there is no top in the stock markets yet, because the risk on trade is still healthy.
CDNX Companies ftp://ftp.cdnx.com/SPCDNXIndex/Constituents.txt
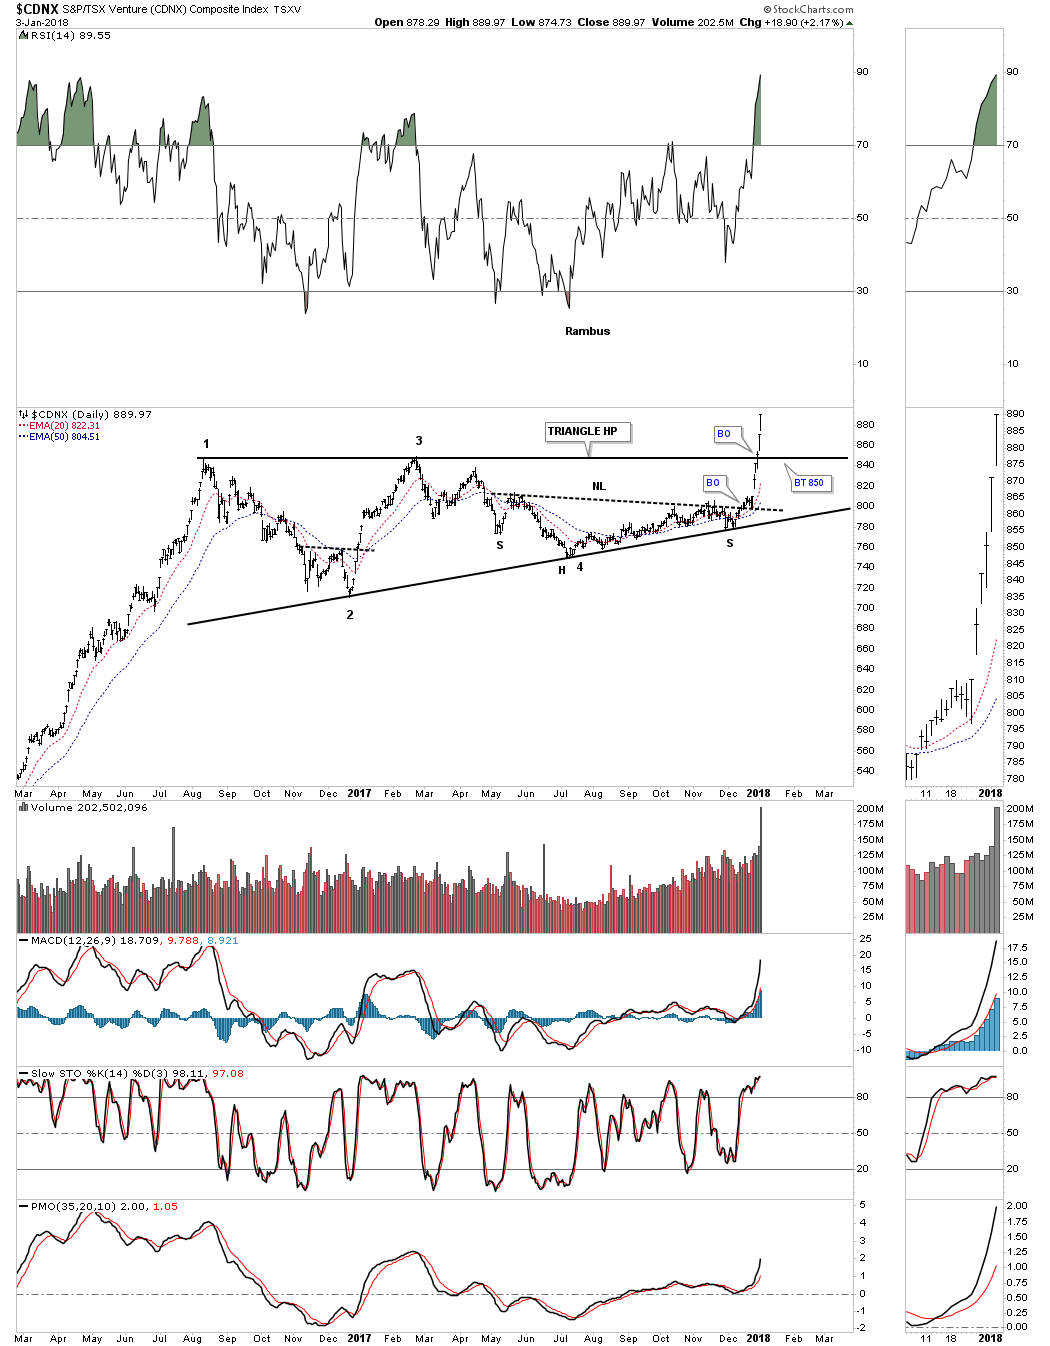
This first chart for the CDNX is a daily look which shows an eight month H&S bottom in place. This chart shows the principal of Chartology at work. Remember a stock does one of three things. It is either building out a reversal pattern, a consolidation pattern or is in an impulse move. After eight months of base building you can see what happens when all the energy is released. There was no way anyone could have predicted that the current impulse move would start out like this one, but we did know that an impulse move would take place once the neckline was broken to the upside.

I have shown you many examples of how a big pattern can be made up of smaller patterns before a pattern is completed. Below is another daily chart for the CDNX that you should be familiar with which shows the nearly one and a half year flat top expanding triangle consolidation pattern. Not only did the price action breakout above the neckline, but also the top rail of the large triangle consolidation pattern. The bears were so exhausted they couldn’t defend the neckline, let alone the top rail of the flat top expanding triangle. A backtest, if we get one, would come into play around the 850 area.
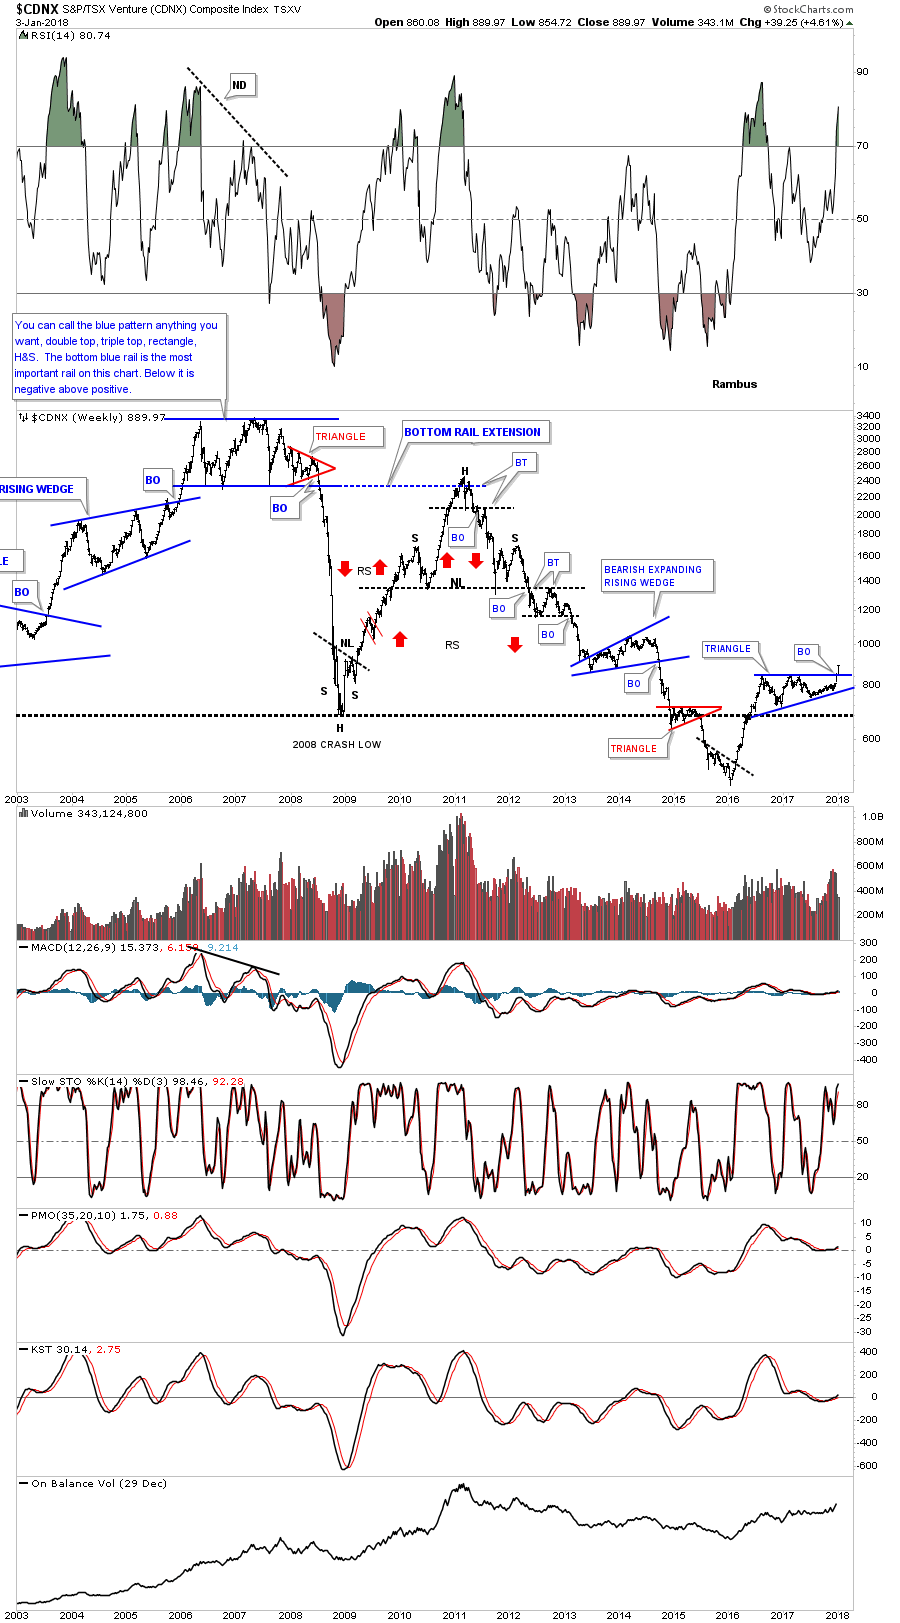
This next chart for the CDNX is a long term weekly look which helped me find the top, back in late 2007. At the time, I called that huge trading range anything you wanted, because there were several pattens that could work out. The bottom line was, whichever way the price action broke out, a big move would follow. Keep in mind that was at the height of the bull market up until that point, and no one wanted to believe that big trading range could be a top.
The big clue came when the small red triangle formed on the right side of the trading range. Until it broke down I still couldn’t say with any confidence which way the big trading range would breakout, but once the price action broke below the bottom rail of that red triangle the writing was on the wall. Again, there was no way to know the magnitude of the collapse only that an important top was in place and an impulse move to the downside would follow. This was also about the time I had to quit posting at the original Goldtent because so many gold bugs were getting angry with my bearish posts.
The CDNX is a good producer of chart patterns as the monthly chart below shows. Our current triangle consolidation pattern has formed just above the 2008 crash low and is now making a multi year high.
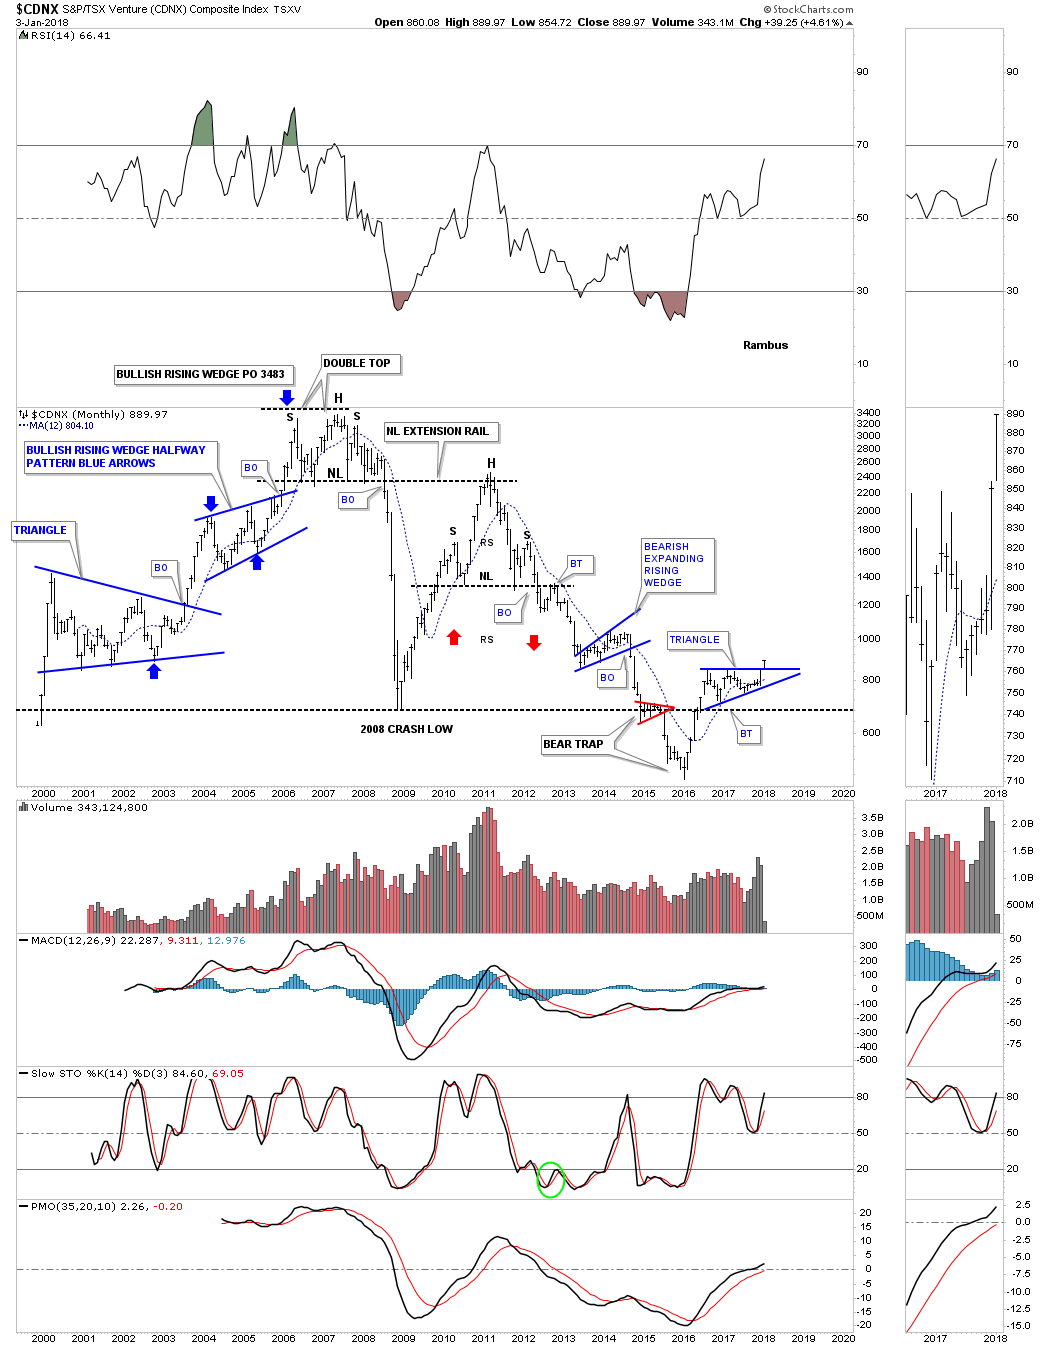
I believe the breakout on this chart is potentially very significant for all the markets we cover here at Rambus Chartology.
All the best
Rambus

As Ecclesiastes notes, “There is nothing new under the sun.” This, too, applies to the stock market.
The average investor trap is the same throughout whatever period you wish to review. Markets become overexuberant, see a correction, sentiment resets, and markets rally on to their next phase of overexuberance. It is really that simple. Yet, we overcomplicate matters by relying on economics and fundamentals, which have proven to be relatively useless at major market turning points.
Whatever occurred in the prior year is often not going to be instructive as to what will occur in the upcoming year, and that is what you do when you rely on fundamentals and economics to linearly forecast 2018. Life is not linear, and neither is the stock market.
Also, many of the old market adages I hear year after year will not help you in 2018 either. Remember the old market saying that as January goes, so goes the rest of the year? How did that turn out in 2016? Even in 2017, January was a sideways month, yet the market went on to major gains. How did sell in May and go away work for you in 2017? Well, don’t say I did not warn you at the time. This is what I wrote on Seeking Alpha:
Sentiment Speaks: If You Sell In May, Be Prepared To Buy Back What You Sell
Markets are really quite simple if you take a broad perspective approach. Society generally progresses through history, so we should expect that our financial markets would follow society’s general path of progression. However, there are periods of time of regression which make us forget that we are generally on a path of progression. This is why I continually try to point out that those who are able to rise above all the noise presented to you on a daily basis will likely do much better than the average investor.
During the last two years, we have heard a significant amount of bearish “noise.” There were a myriad of reasons presented as to why this market was going to imminently collapse, and I have listed them for you many times in the past. I guess someone forgot to tell Mr. Market. Yet, market participants continue to pour over old economic data or news events in wasted efforts to glean the next stock market directional cue. And, if the last two years has not taught you this lesson, then nothing likely will. Sometimes, it is hard to recognize that we wear blinders, as they become too comfortable to take them off. In fact, the story of the stock market is not much different than the movie The Matrix. But, I digress.
So, let’s look back at 2016-2017, and then consider how we see 2018 within that context.
While I was strongly bullish the SPX as we came into 2017, as we certainly had much higher to achieve before we struck the long-term targets we set years ago for this degree of wave structure, the SPX has surpassed our targets during the last few months of the year by approximately 4%.
Whereas we were looking for a rally from the 1800 region to as high as the 2611 region, which would have provided a 45% gain, the market actually provided closer to a 49% gain from the lows struck in 2016. While I certainly wish we were able to be perfect, unfortunately, there is no such thing as perfection when dealing with non-linear systems such as the stock market.
Yet, if I told you two years ago that I would be confident about a 45% rally in the stock market over the coming two years, but I may miss the last 4-5% of the market move, I think you would be quite happy with analysis that guided you confidently for 90% of that market move. And, when you consider that we caught that last 9% move in the IWM, well, I think we did quite well for 2016-2017 when most seemed to be looking down.
As for looking to the future, please recognize that by no means are we looking for the end of the bull market which began in 2009. Rather, we are now within wave (3) of the 5th wave of the larger degree 3rd wave within a 5-wave Elliott structure off the 2009 lows (as you can see on the monthly SPX chart).

Double Click Chart for Larger Version
And, as I have tried to relate this to baseball terms, it is akin to being in the 6th inning of a baseball game. We likely still have several years to go before we complete this bull market run off the 2009 lows, and we will not likely see the 7th inning stretch until 2019, after we complete all of wave 3.
Since we use Elliott Wave analysis to “count” how mass sentiment moves through bullish and bearish periods of progression and regression, our perspective is that we are completing a wave (3) in the equity markets, which often ushers in a wave (4), as long as the number 4 comes after the number 3. And, since our numeric system has not changed since I learned it as a child, I am going to expect that we will see wave (4) in 2018.
But, as I have noted in prior weekend analysis to my members, the market may continue to levitate until March. You see, some indices have potentially completed their respective wave (3), such as the IWM, but others suggest that we still need a smaller degree 4th and 5th wave before all of wave (3) completes, such as the XLF.
This would mean that we can see a pullback into early 2018 in all indices, with some counting as a smaller degree 4th wave (XLF), whereas others would be an (A) wave of their wave (4) already (IWM). Moreover, this would make the expected rally into the March time frame a 5th wave in some indices (XLF), whereas it may be a lagging b-wave in others (IWM). Ultimately, it seems to suggest that the bigger pullback we want to see in a wave (4) may not occur until the late Spring or early Summer.
As I have noted many times before, the drop I expect in 2018 will likely be considered the end of the bull market by many, so I still suggest you ignore the noise in 2018. Our analysis suggests that it will likely be another buying opportunity for the next phase of the rally which will likely be targeting the 2800-3000 region next. In fact, if we are able to complete the full structure I have outlined on my monthly chart, we will not likely complete this bull market off the 2009 lows until the early 2020’s. So, if you are going to dust off your bear suit for 2018, please make sure to recognize that it will only be for a short-term engagement.
I would like to take this opportunity to wish everyone a happy, healthy and prosperous new year to you and your families.
See charts illustrating the wave counts on the S&P 500, IWM and XLF.
Avi Gilburt is a widely followed Elliott Wave technical analyst and author of ElliottWaveTrader.net (www.elliottwavetrader.net), a live Trading Room featuring his intraday market analysis (including emini S&P 500, metals, oil, USD & VXX), interactive member-analyst forum, and detailed library of Elliott Wave education.

 Key takeaways
- My base case scenario remains that the stock market will continue to perform well in 2018 — although that doesn’t mean we won’t experience a pullback during the year.
- Global growth and still-accommodative monetary policies are likely to be key drivers of stocks.
- We need to be mindful of the potential for downside volatility.
2017 was a positive year for the economy and capital markets. The global economy grew at a faster pace than in 2016, and risk assets also rose significantly.1 However, investors are wondering whether the current environment will continue through 2018. Following are my 10 key expectations for the new year:
1. Upward bias for stocks globally.
As we enter 2018, there are two key drivers creating an upward bias for stocks and other risk assets globally: improving global growth and the continuation of accommodative monetary policy. These are two very powerful influences that I believe should support risk assets in general and stocks in particular.
Now, that doesn’t mean we won’t experience a correction, particularly in the US, but it does suggest it could be more short-term in nature.
The eurozone, Japan, the US and a number of emerging markets are experiencing rising growth, and that dynamic is likely to continue well into 2018, although there will likely be hiccups along the way. In addition, earnings growth is solid and improving in most major markets; this should also be supportive for global stocks. At the same time, most of these economies are experiencing relatively low inflation, which gives central banks more flexibility to remain very accommodative.
2. More disruption and greater volatility. Disruption — both positive and negative — is abundant right now, which increases the chance that volatility will rise from its extremely low levels.
Geopolitical disruption. Tensions are rising in a variety of places around the world, from North Korea to Saudi Arabia. However, geopolitical disruption typically doesn’t impact the stock market unless it becomes extreme. And, if it does have an impact, it’s usually short-term in nature. What I worry more about is the potential for countries around the world to adopt more protectionist policies in response to the geopolitical disruption created by nationalist movements intent on de-globalization. We can’t forget that many economists blame protectionism for exacerbating the Great Depression in the 1930s, and we can’t ignore the threat of protectionism that is very real today.
And then there is the risk of political disruption in the US stemming from lofty expectations about the success of the Trump legislative agenda, particularly tax reform and infrastructure spending. The US stock market rallied dramatically after the election, helped by an improvement in earnings but largely buoyed by legislative optimism. However, this agenda has not yet come to fruition — and, in my estimation, is in danger of not meeting initial expectations. This creates vulnerability for the US stock market.
Monetary policy disruption. The large-scale asset purchase plans that have been a major policy tool of key central banks over the past decade are experiments that have had a very significant impact on asset prices — and market volatility. Now that central banks are starting to “normalize” this experimental monetary policy, there is the potential for disruption to capital markets. While this is not my base case, this is a distinct possibility, especially given that this potential is amplified by several different factors that all increase the odds of a policy error. First, in the US, there will be a significant number of new Federal Open Market Committee members in 2018, including the chair and the vice chair. Second, the US Federal Reserve (Fed) is utilizing two different monetary policy levers simultaneously — the federal funds rate and the Fed’s balance sheet. Finally, several other major central banks are starting to normalize monetary policy, albeit ever so gently.
3. Lower for longer rates and a continued hunt for income.
While a number of central banks have begun to get slightly less accommodative — including the Fed, the Bank of Canada, the Bank of England (BOE) and the European Central Bank (ECB) — they still remain very accommodative in relative terms. Recent events suggest this will continue in 2018 — specifically the November 2017 nomination of Jerome Powell as the next Fed chair, given that he is likely to maintain the status quo set by outgoing Chair Janet Yellen, and the ECB’s decision to keep the end date of quantitative easing open-ended. This suggests that the hunt for investment income will continue in 2018.
4. Increased debt levels.
I expect leverage, including government and private debt, to increase and become riskier in some regions in 2018.
The People’s Bank of China’s outgoing governor has warned repeatedly about the threat of high leverage in China’s financial system and the importance of financial reforms. We will want to see if Chinese President Xi Jinping will prioritize those reforms. It will also be critical for the People’s
Bank of China to negotiate monetary policy effectively, given the risks of high debt levels and the need to support the Chinese economy without causing it to overheat.
In addition, Japanese government debt is at very high levels, which will make it difficult for the Bank of Japan to normalize its monetary policy. The US also has a high level of government debt that is projected to climb much higher. On top of that, US consumer debt recently hit a new record, and defaults are rising for sub-prime auto loans. In Canada, the household debt situation is even worse — in late 2017, household debt as a percentage of disposable income was above the level reached by the US in 2007, before the start of the global financial crisis.
5. Continued UK uncertainty, with fatter tails likely.
I believe the odds are increasing that there will be an extreme outcome to the Brexit negotiations — either a pre-Brexit relationship between the EU and UK, or no relationship at all. The longer it takes to reach an agreement, the more likely it is that companies begin to relocate. In addition, the UK faces another headwind to its economy: The BOE decided in November to raise rates for the first time in more than a decade. While there is no strong growth that the BOE needs to moderate, it is attempting to move the pound sterling higher in order to combat the relatively high level of inflation that the UK is experiencing as a result of Brexit-related currency shifts. However, the BOE intimated in its decision that it is not on any kind of significant tightening path, so sterling didn’t show the strength that the BOE hoped for. This is problematic and suggests the potential for a stagflation scenario. We will want to follow sterling and inflation closely.
6. A focus on critical economic reforms.
French President Emmanuel Macron has embarked on ambitious labor market reforms for his country. This has already inspired much-improved business sentiment that could result in higher capital expenditures. Macron also intends to take a lead on reforms for the European Union, which are vital to future stability and growth in the EU. In addition, Indian Prime Minister Narendra Modi is in the process of a transformative reform agenda for his country. In 2017, India enacted a Goods and Services Tax, a de-monetization plan, a new bankruptcy law, an inflation-targeting framework for its central bank, and a Real Estate Regulation Act. India’s growth is moderating, and the country needs continued and more successful reforms in order for growth to accelerate.
7. The need for infrastructure.
A number of major economies are desperately in need of infrastructure spending — particularly the United States and India. Infrastructure is a priority focus for India going forward, both rural (housing, roads, electricity) and national. In the US, there is a need to replace and rebuild a variety of different types of infrastructure, including water pipes, bridges and tunnels, and telecommunications structures. Infrastructure can be a very powerful form of fiscal stimulus in both the short term and the longer term. I expect countries that actually spend wisely on infrastructure to see a significant tailwind to economic growth and benefits to several different sectors (industrials, materials, telecommunication services). Conversely, failure to focus on infrastructure next year may have negative implications.
8. The potential for currency surprises.
This past year saw significant and unexpected weakness for the US dollar, as diminished growth expectations and political setbacks weighed on the currency. In addition, emerging markets currencies have reacted to recent political developments. I would expect more surprises and fluctuations in 2018. A number of central banks will likely continue to slowly tighten monetary policy, which should, depending on timing, cause changes in the relationships of different currencies. A less-than-fully synchronized global economic recovery could also contribute to currency fluctuations.
9. A mixed outlook for commodities.
While the US dollar weakened, the price of oil did not rise significantly in 2017 — despite a rise in prices for industrial metals. This suggests that relationships are changing among different commodities, with metals prices more greatly impacted by emerging market demand. I expect agricultural commodities to benefit from improving global demand, and gold to move based on several different influences, particularly the fear trade and the inflation trade. In general, I expect a mixed performance by commodities next year, but with a relatively lower correlation to equities and fixed income.
10. Possible rotation in leadership.
We need to recognize that this is still a very macro-driven environment. Political developments — specifically the success or failure of key legislative initiatives such as tax reform or infrastructure spending — will likely cause relatively swift rotations in leadership between growth and value in the US stock market for the year. We are also likely to see rotations in leadership among asset classes, styles and sectors, as the global economic recovery will not be perfectly synchronized, favoring certain regions and asset classes at different times.
Market outlook
In summary, despite all the outstanding risks, my base case scenario remains that the stock market will continue to perform well in 2018. However, given rising risks to capital markets, we need to be mindful of the potential for downside volatility.
1 Risk assets are securities, such as stocks or certain types of bonds, that carry a degree of risk.
Kristina Hooper
Global Market Strategist
Kristina Hooper is the Global Market Strategist at Invesco. She has 21 years of investment industry experience.
Prior to joining Invesco, Ms. Hooper was the US investment strategist at Allianz Global Investors. Prior to Allianz, she held positions at PIMCO Funds, UBS (formerly PaineWebber) and MetLife. She has regularly been quoted in The Wall Street Journal, The New York Times, Reuters and other financial news publications. She was featured on the cover of the January 2015 issue of Kiplinger’s magazine, and has appeared regularly on CNBC and Reuters TV.
Ms. Hooper earned a BA degree, cum laude, from Wellesley College; a J.D. from Pace University School of Law, where she was a Trustees’ Merit Scholar; an MBA in finance from New York University, Leonard N. Stern School of Business, where she was a teaching fellow in macroeconomics and organizational behavior; and a master’s degree from the Cornell University School of Industrial and Labor Relations, where she focused on labor economics.
Ms. Hooper holds the Certified Financial Planner, Chartered Alternative Investment Analyst, Certified Investment Management Analyst and Chartered Financial Consultant designations. She serves on the board of trustees of the Foundation for Financial Planning, which is the pro bono arm of the financial planning industry, and Hour Children.
For Wednesday December 27, 2017 3:00 PM Pacific.
DOW + 28 on 325 net advances
NASDAQ COMP + 3 on 54 net advances
SHORT TERM TREND Bullish
INTERMEDIATE TERM Bullish
STOCKS: There is a theory that tax loss selling, which usually takes place in October, did not take place because of uncertainty about the tax bill. Supposedly it is taking place now. Of course, you can never be sure, but something seems to be retarding progress in the markets.
Every time we look to be starting up, selling comes in. It could also be a large sell program. If a major institution is decides to unload shares, they won’t announce it. They simply bleed stocks into to the market and once it’s over, shares frequently explode to the upside.
GOLD: Gold moved up $9. Lower bond rates may have helped, but the momentum from its last oversold condition is more likely the reason.
CHART: The S&P 500 has been waffling sideways for over a week, but the advance decline line continues to make all time highs.

BOTTOM LINE: (Trading)
Our intermediate term system is on a buy.
System 7 We are long the SSO from 110.59. Stay with it on Thursday.
System 8 We are in cash. Stay there for now.
System 9 We are in cash.
NEWS AND FUNDAMENTALS: Consumer confidence came in at 122.1, lower than last month’s 128.6. Pending home sales rose 0.2%, lower than the expected .05%. On Thursday we get the trade deficit, initial claims and oil inventories.
INTERESTING STUFF: Never interrupt your enemy when he is making a mistake. ——–Napoleon Bonaparte
TORONTO EXCHANGE: Toronto was up 38.
BONDS: Bonds surged.
THE REST: The dollar was lower again. Crude oil fell back a bit.
Bonds –Bullish as of Dec. 15.
U.S. dollar – Bearish as of Dec. 11
Euro — Bullish as of Dec. 11.
Gold —-Bullish as of Dec. 13.
Silver—- Bullish as of Dec. 13.
Crude oil —-Bullish as of Dec. 26.
Toronto Stock Exchange—- Bullish as of September 20, 2017.
We are on a long term buy signal for the markets of the U.S., Canada, Britain, Germany and France.

Monetary conditions (+2 means the Fed is actively dropping rates; +1 means a bias toward easing. 0 means neutral, -1 means a bias toward tightening, -2 means actively raising rates). RSI (30 or below is oversold, 80 or above is overbought). McClellan Oscillator ( minus 100 is oversold. Plus 100 is overbought). Composite Gauge (5 or below is negative, 13 or above is positive). Composite Gauge five day m.a. (8.0 or below is overbought. 13.0 or above is oversold). CBOE Put Call Ratio ( .80 or below is a negative. 1.00 or above is a positive). Volatility Index, VIX (low teens bearish, high twenties bullish), VIX % single day change. + 5 or greater bullish. -5 or less, bearish. VIX % change 5 day m.a. +3.0 or above bullish, -3.0 or below, bearish. Advances minus declines three day m.a.( +500 is bearish. – 500 is bullish). Supply Demand 5 day m.a. (.45 or below is a positive. .80 or above is a negative). Trading Index (TRIN) 1.40 or above bullish. No level for bearish.
No guarantees are made. Traders can and do lose money. The publisher may take positions in recommended securities.
The economy is like a large ship in at least one way: Neither a ship nor the economy can turn on a dime.
It takes miles of clear blue ocean and time to safely turn a large ship. The same is true for the economy. It takes time for the economy to change direction.
That reality of slow change means 2018 looks like a good year for the U.S. economy. That’s because a key indicator is ending this year in an uptrend.
The Industrial Production Index Through Booms and Busts
Industrial production is rising, but it’s only been rising for about a year. In the past, uptrends in this indicator generally continued for at least five years. Its young trend bodes well for next year, as the trend is likely to continue.
The chart below shows the year-over-year percentage change in the Industrial Production Index (IPI) as the blue line. The S&P 500 index is the black line in the chart. Notice how trends in the two indexes tend to be in the same direction.

The Federal Reserve calculates the Industrial Production Index. It’s designed to measure the inflation-adjusted output of all manufacturing, mining, and electric and gas utilities located in the United States.
Since the Fed calculates the index, it’s obvious Fed officials believe it’s important data. History shows the data series is also important to stock market investors.
The chart above is a long-term chart showing almost 40 years of data. Through booms and busts, the two indexes have almost always moved in the same direction.
Skeptics point out manufacturing isn’t as important as it was 40 years ago. That might be true, but the IPI includes the production of electricity. If bitcoin mining, for example, is now more important to the economy than manufacturing cars, the index will capture that change.
This index tracks the stock market in addition to the economy. It is one of the few economic indicators that stock market investors should follow.
Investing in the S&P 500 only when the rate of change in the IPI was higher than it was a year earlier resulted in market-beating results over the past 30 years. It also reduced risk by about 18%.
Looking ahead, this indicator tells us 2018 is likely to be a good year for the economy. This indicator also tells us to buy stocks because they are likely to deliver double-digit returns.
Regards,
Michael Carr, CMT
Editor, Peak Velocity Trader

-
I know Mike is a very solid investor and respect his opinions very much. So if he says pay attention to this or that - I will.
~ Dale G.
-
I've started managing my own investments so view Michael's site as a one-stop shop from which to get information and perspectives.
~ Dave E.
-
Michael offers easy reading, honest, common sense information that anyone can use in a practical manner.
~ der_al.
-
A sane voice in a scrambled investment world.
~ Ed R.
Inside Edge Pro Contributors

Greg Weldon

Josef Schachter

Tyler Bollhorn

Ryan Irvine

Paul Beattie

Martin Straith

Patrick Ceresna

Mark Leibovit

James Thorne

Victor Adair