Stocks & Equities

Ed Note: Since Martin Armstrong wrote a post in his blog January 29th predicting a January correction the Dow has dropped 646 points from is January 29th opening tick. Martin writes a followup and clarifies his correction thinking in the blog posting Jan 31st below: MoneyTalks Editor
COMMENT: OK Mr. Armstrong. Looks like the government was right. You come out and said the Dow reached a turning point and it crashes. You posted: “In the US Share Market, this is now a turning point we have reached. I have warned for months that exceeding the November high would lead to a January high.” You are too influential.
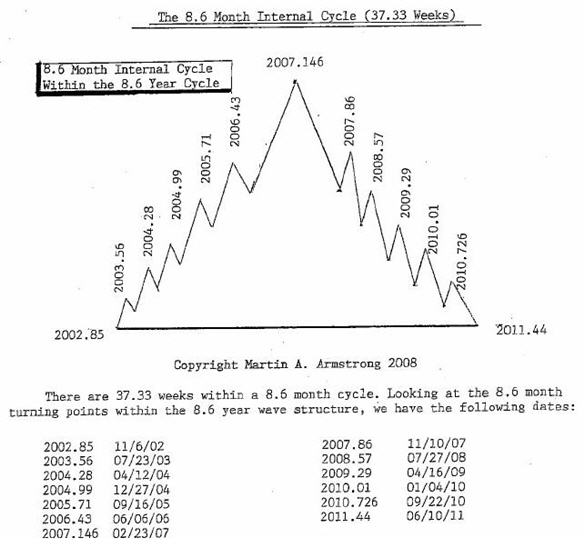
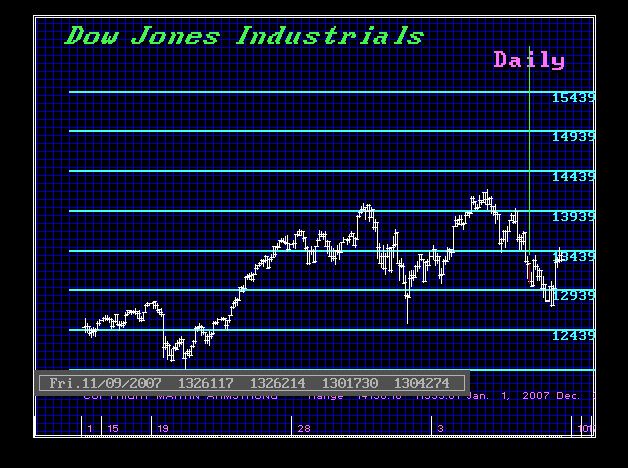
REPLY: Or perhaps our models are correct. This nonsense that people can move the market is absurd. Governments have spent trillions and failed. Why is it I am the only person who can move the world? Does a tree make a sound when it falls in a forest even when nobody is there to listen? They tried to silence me yet it still did not matter. Here is the internal 37.33-week cycle within the Economic Confidence Model. The target date 2007.86 was November 9th/10th. It was November 9th, 2007 that all four Daily Bearish Reversals were elected from the major high. Why do things take place precisely to the day even when I do not announce them?
So far, we have elected the first Daily Bearish Reversal. There are three more to go before we can say we are headed into a March low. Time will tell. It should be choppy for the next couple of weeks. When you gap lower like this, you normally will bounce and eventually fill that gap. So caution is always advisable.
The first high was the precise day that the Real Estate market peaked in 2007. They called that Armstrong’s Revenge on the trading floor that day since it was again to the day. That was precisely to the day of which the same calculation produced the very day of the low during the 1987 Crash. Markets peak and bottom in sync with our models around the world even when I do not mention them. Even Greece petitioned the IMF for help precisely on the turning point. Then on the very day, Russia entered Syria on 2015.75. These events are all the same model and the calculations are cast in stone.
Sorry – there is just something beyond the surface that warrants our attention. These dates are not random. They cannot be fudged. You can blame me, but they have existed before my time and will continue beyond my lifetime.
This video explores the possibility that stocks are currently giving us a brief pull back before the next powerfully rising intermediate cycle begins.
https://blog.smartmoneytrackerpremium.com/


![]()
In this week’s issue:
- Stockscores’ Market Minutes Video – The Morning Stair Master
- Stockscores Trader Training – Does Size Matter?
- Stock Features of the Week – Profiting from a Correction
Stockscores Market Minutes – The Morning Stair Master
Stocks are making most of their move in the opening hour and then going sideways for the rest of the day. There are some situations where stocks will trend all day long. I discuss this, my market analysis and the day trade of the week on PFE in this week’s Market Minutes.
To get instant updates when I upload a new video, subscribe to the Stockscores YouTube Channel
Trader Training – Does Size Matter?
Investors often group stocks by their market capitalization, the total value of the company based on the price of their shares multiplied by the number of shares outstanding. Microcap stocks might have 20,000,000 shares out with a price of $0.50 – these tend to dominate the TSX Venture Exchange. A company with a few hundred million is more of a real business but still considered a small company compared to the large cap stocks that dominate the major market indexes, each valued at many billions of dollars. Apple, currently the largest company listed in North America, has a market cap of $865 Billion.
There are significant differences in how stocks small cap stocks trade compared to large caps. It is important to understand these differences so you can approach trading them in the right way. Here are some things to consider:
Liquidity – liquidity is a measure of how actively a stock trades and how smooth the price movements are for a stock. Generally, large cap stocks are more actively traded and make less volatile changes in price. Small cap stocks don’t have as many investors which makes them subject to a higher level of price volatility. This means that the reduced liquidity of small cap stocks makes them riskier. A stock that does not trade actively can make big price swings because of the actions of one large investor.
From a practical standpoint, this means you can suffer a bigger loss than you plan for in your risk management. You may plan to exit a trade if the stock hits your stop loss point at $5. However, if the stock is not very liquid and many investors try to exit at the same time, you could end up getting out at a much lower price than what you had planned for.
Correlation – every stock has some correlation to what the overall market is doing. If the general market is going up in value, most stocks will also go up. Large cap stocks tend to be more closely correlated to the market index. If you look at a chart comparing Microsoft (MSFT) with the Nasdaq 100 (QQQ) you will find that they move all most exactly the same way.
This makes it important to analyze the market index as well as the stock when considering the purchase of large cap stocks. Even if the large company you are considering is doing great things in its business, it may not perform well if the overall market heads lower.
This also means that large cap stocks can outperform small cap stocks when the overall market is strong. We have seen this over the past year; small cap stocks have been flat while the large cap stocks have moved in a strong upward trend with the overall market.
If the overall market breaks its long term upward trend, we may see money look for market beating returns in small cap stocks because this group is not so closely correlated to what the overall market is doing.
Performance – small cap stocks have a greater capacity for percentage return, up or down. Smaller companies tend to have a less diverse business which means they can go up or down rapidly based on the performance of their products or services. Consider how a company making a smart watch would do if it was successful. For a company like Apple, the launch of a smart watch might bring in a few billion dollars in sales but that, in the context of their overall business, will not have a huge impact on earnings. If a small cap company had the same success with the same product (and it was their only product), the effect on their stock price would be massive.
Of course, the failure of a business can also have a huge effect on share price. We often see small cap biotech stocks suffer painful and sudden sell offs when a drug that they are developing fails to get approval.
This defines the risk reward trade off that comes with selecting between market caps when investing. Large stocks have a hard time significantly beating the overall market. Small caps can achieve this but they can also suffer significant losses. With smaller cap stocks, risk management is more important.
Yield – many investors like stocks that pay a dividend since they rely on their portfolio for income. Most small cap stocks are working to grow earnings and use their capital to reinvest in their business. Once companies get large, they begin to return their earnings to shareholders as dividends. If you want to collect dividends, you will generally focus on larger cap stocks.
Fun – historically, I have found that trading smaller cap stocks is more fun. It is enjoyable to buy a stock at $5 and watch it go to $10 in a few days. That can happen with small cap stocks, it is rare with large cap.
Of course, making good returns is always going to be fun and you ultimately have to go to where the trend is strong. Large cap stocks have been in an upward trend for a number of years making it likely that any investor in boring, large cap stocks has felt pretty good watching them go up, even it has been slow and steady.
Stock Features of the Week – Fear Rising
In this week’s Market Minutes video, I highlight the optimism building in the chart for the VXX. That means there is a slow growth in fear and the expectation for a near term pullback in the market. A good way to profit from a correction is by trading the VXX or some of the similar ETNs like UVXY or TVIX.
It is important to recognize that the charts for the major market indexes have not broken down yet and they remain in strong upward trends. However, the chart of the VXX is giving a short term buy signal that we should not ignore for an early signal that weakness may be coming.
1. VXX
Break up from a rising bottom for the VXX, breaking its downward trend line. Support at $27.50.

If you wish to unsubscribe from the Stockscores Foundation newsletter or change the format of email you are receiving please login to your Stockscores account. Copyright Stockscores Analytics Corp.
References
- Get the Stockscore on any of over 20,000 North American stocks.
- Background on the theories used by Stockscores.
- Strategies that can help you find new opportunities.
- Scan the market using extensive filter criteria.
- Build a portfolio of stocks and view a slide show of their charts.
- See which sectors are leading the market, and their components.
Disclaimer
This is not an investment advisory, and should not be used to make investment decisions. Information in Stockscores Foundation is often opinionated and should be considered for information purposes only. No stock exchange anywhere has approved or disapproved of the information contained herein. There is no express or implied solicitation to buy or sell securities. The writers and editors of this newsletter may have positions in the stocks discussed above and may trade in the stocks mentioned. Don’t consider buying or selling any stock without conducting your own due diligence.
This video explores a provocative hypothesis that stock’s current parabolic move will end much differently than anyone imagines.
Gary make the case that the market is only 1 month into its parabolic move and that when the correction comes it won’t be a collapse but a prelude to a further move higher.

 Frank Holmes of US Global Investors; Rick Rule of US Sprott Holdings; and Marin Katusa of Katusa Research share their top stock picks of the year.
At this year’s Vancouver Resource Investment Conference (VRIC), there were plenty of investors eager to learn more from mining experts and thought leaders.
One of the most well-attended panels on Sunday (January 21) featured Frank Holmes of US Global Investors (NASDAQ:GROW); Rick Rule of US Sprott Holdings; and Marin Katusa of Katusa Research. They shared a few of their top stock picks for the coming year.
Here’s a closer look at their favorite companies. If you missed VRIC this year, don’t forget to check out our notes from the floor for day one — and be sure to stay tuned for more articles and interviews from the conference.
Frank Holmes:
1. Dolly Varden Silver (TSXV:DV)
Current price: C$0.76; year-to-date gain: 7.04 percent
Dolly Varden Silver is a mineral exploration company focused on exploration in Northwestern BC. Dolly Varden has two projects — its namesake Dolly Varden silver property and the nearby Big Bulk copper–gold property.
2. Tristar Gold (TSXV:TSG)
Current price: C$0.28; year-to-date gain: 23.91 percent
TriStar Gold is an exploration and development company focused on precious metals properties in the Americas that have the potential to become significant producing mines. The company’s current flagship property is Castelo de Sonhos in Brazil’s Pará state.
3. New Pacific Metals (TSXV:NUAG)
Current price: C$1.30; year-to-date gain: -11.56 percent
New Pacific Metals is a Canadian exploration and development company that owns the Silver Sand project, located in the Potosi department of Bolivia. It also holds the Tagish Lake gold project in the Yukon, and the RZY project in Chinan’s Qinghai province.
Rick Rule:
1. EMX Royalty (TSXV:EMX)
Current price: C$1.12; year-to-date gain: 8.74 percent
EMX Royalty leverages asset ownership and exploration insight into partnerships that advance its mineral properties, with EMX receiving pre-production payments and retaining royalty interests. EMX complements its royalty generation initiatives with royalty acquisitions and strategic investments. Its royalty and property portfolio spans five continents, and consists of a balanced mix of assets.
2. Sprott (TSX:SII)
Current price: C$2.89; year-to-date gain: 18.44 percent
Sprott is an alternative asset manager and a global leader in precious metals and real asset investments. Through its subsidiaries in Canada, the US and Asia, the company provides investors with investment strategies that include exchange-listed products, alternative asset management and private resource Investments. The company also operates merchant banking and brokerage businesses in both Canada and the US.
Marin Katusa:
1. Equinox Gold (TSXV:EQX)
Current price: C$1.30; year-to-date gain: 16.07 percent
Equinox Gold has a multi-million-ounce gold resource base, near-term and growing gold production from two past-producing mines in Brazil and California and a long-term growth platform with a diverse portfolio of gold and copper assets in North and South America. Construction is underway at the company’s Aurizona project in Brazil, with the objective of pouring gold by the end of this year. A prefeasibility study is underway at the company’s Castle Mountain project in California.
2. Blackbird Energy (TSXV:BBI)
Current price: C$0.32; year-to-date gain: -7.14 percent
Blackbird Energy is an oil and gas exploration and development company focused on the condensate and liquids-rich Montney fairway at Elmworth, near Grande Prairie in Alberta. Blackbird holds a 100-percent working interest in 132 gross (112.4 net) sections of highly prospective Montney rights.
3. Uranium Energy (NYSEAMERICAN:UEC)
Current price: $1.64; year-to-date gain: -7.34 percent
Uranium Energy is a US-based uranium mining and exploration company. The company’s fully licensed Hobson processing facility is central to all of its projects in South Texas, including the Palangana ISR mine, the permitted Goliad ISR project and the development-stage Burke Hollow ISR project. Additionally, the company controls a pipeline of advanced-stage projects in Arizona, Colorado and Paraguay.
Don’t forget to follow us @INN_Resource for real-time news updates!


 –
–


