Stocks & Equities
An important letter written by Stephen Todd, who was Ranked #1 in 2017 by the venerable Timer’s Digest with a 31.6% return for 2017. In this evenings letter, Stephen makes a case for a rally in stocks tomorrow. Perhaps more importantly, as of today Feb 20th Stephen changes to Bullish the US Dollar & Bearish Gold, Silver & the Euro – Robert Zurrer for Money Talks
For Tuesday February 20, 2018
Available Mon- Friday after 6:00 P.M. Eastern, 3:00 Pacific.
DOW – 254 on 976 net declines
NASDAQ COMP – 5 on 963 net declines
SHORT TERM TREND Bullish
INTERMEDIATE TERM Bullish
Editor’s note.— For those of you who missed the interview on Saturday with Michael Campbell, you can hear it by clicking on THIS LINK
It is our belief that this was a pullback within an uptrend albeit a somewhat scary one. I liked the fact that the NASDAQ and high tech indices were not down nearly as much. Check out the chart.
GOLD: Gold was down a whopping $25. The Wall Street Journal blamed a rising dollar and rising interest rates. I’m not so sure, but I don’t have an alternate theory. I’ll keep checking.
CHART: The SOX or semiconductor index was up nicely on Tuesday in spite of the drop by the S&P 500 and Dow (right arrow). The SOX frequently leads the broader averages so a rebound tomorrow would not be a big surprise. The other arrows show previous occurrences.

BOTTOM LINE: (Trading)
Our intermediate term system is on a buy.
System 7 We are long the SSO from 107.03. Keep your stop at 110.03.
System 9 We are on a buy from Friday Feb. 2.
NEWS AND FUNDAMENTALS: There was nothing of importance on Tuesday. On Wednesday we get the PMI Composite Flash, existing home sales and the FOMC minutes from the last meeting.
INTERESTING STUFF: Any man can make mistakes, but only an idiot persists in his error. ——-Marcus Tullius Cicero
TORONTO EXCHANGE: Toronto lost 13.
BONDS: Bonds were down somewhat.
THE REST: The dollar rebounded from a support zone. Crude oil was flat, giving up intraday gains.
Bonds –Bearish as of Jan. 9.
U.S. dollar – Change to bullish as of Feb.20.
Euro — Change to bearish as of Feb. 20.
Gold —-Change to bearish as of Feb. 20.
Silver—- Change to bearish as of Feb. 20.
Crude oil —-Bullish as of Feb. 14.
Toronto Stock Exchange—-Bullish as of Feb. 12.
We are on a long term buy signal for the markets of the U.S., Canada, Britain, Germany and France.

Monetary conditions (+2 means the Fed is actively dropping rates; +1 means a bias toward easing. 0 means neutral, -1 means a bias toward tightening, -2 means actively raising rates). RSI (30 or below is oversold, 80 or above is overbought). McClellan Oscillator ( minus 100 is oversold. Plus 100 is overbought). Composite Gauge (5 or below is negative, 13 or above is positive). Composite Gauge five day m.a. (8.0 or below is overbought. 13.0 or above is oversold). CBOE Put Call Ratio ( .80 or below is a negative. 1.00 or above is a positive). Volatility Index, VIX (low teens bearish, high twenties bullish), VIX % single day change. + 5 or greater bullish. -5 or less, bearish. VIX % change 5 day m.a. +3.0 or above bullish, -3.0 or below, bearish. Advances minus declines three day m.a.( +500 is bearish. – 500 is bullish). Supply Demand 5 day m.a. (.45 or below is a positive. .80 or above is a negative). Trading Index (TRIN) 1.40 or above bullish. No level for bearish.
No guarantees are made. Traders can and do lose money. The publisher may take positions in recommended securities.

This gentleman makes the case very powerfully that stocks are not in a bubble. This jibes with Martin Armstrongs view that the Dow is heading to 35,000 – 39,000 in the next two years as money flows from the Treasury markets to Stocks. Definitely worth watching this youtube below by Gary Savage who uses the $XVG Value Line Geometric Average as a proxy as it measures all the stocks in the US Market – Robert Zurrer for Money Talks
Stocks have only recently broken above a 20 year long consolidation period. Price may now enter a parabolic phase or be beginning another long term bull market. In either case, this video explains why stocks are not presently in a bubble.
https://blog.smartmoneytrackerpremium.com/


For Thursday February 8, 2018 3:00 PM Pacific.
DOW – 1033 on 2283 net declines
NASDAQ COMP – 275 on 2080 net declines
SHORT TERM TREND Bullish
INTERMEDIATE TERM Bullish
STOCKS: On Tuesday I said that we would probably get at least a partial retest of the lows. Well, this was more than a retest. Most important indices closed under the previous closing lows and intraday lows. The Dow and Russell 2000 were exceptions, but not by much.
Was there any good news? Actually yes. The put call ratio finally expanded to 1.15 showing that option buyers are finally getting scared. Also, we’re starting to hear bear market talk after so many market commentators were advising buying into the decline. In other words, sentiment is starting to come around.
Also, our traders have managed to largely avoid this drop. The SSO is down 8.29 for the year. Traders are up 6.85. We’ll discuss more about our short term posture on tomorrow’s update.
GOLD: Gold bounced $6. We still are getting higher rates and a higher dollar. Looks like a bounce within a downtrend.
CHART: Help may be on the way. We’re seeing panic volume for the ETF of the NASDAQ 100, QQQ. These volume spikes tend to come at multi week lows.

BOTTOM LINE: (Trading)
Our intermediate term system is on a buy.
System 7 We remain in cash. Stay there for right now.
System 9 We are on a buy from Friday Feb. 2.
|
NEWS AND FUNDAMENTALS: Jobless claims came in at 221,000, less than the expected 235,000. Nothing of importance on Friday. INTERESTING STUFF: In any moment of decision, the best thing you can do is the right thing, the next best thing is the wrong thing, and the worst thing you can do is nothing. ——–Theodore Roosevelt |
|
|
TORONTO EXCHANGE: Toronto lost 265.
BONDS: Bonds made another new low for this move.
THE REST: The dollar moved higher. Crude oil was down sharply again. Good for the latter.
Bonds –Bearish as of Jan. 9.
U.S. dollar – Bullish as of Feb. 5.
Euro — Bearish as of Feb.5.
Gold —-Bearish as of Jan 26.
Silver—- Bearish as of Jan 26.
Crude oil —-Bearish as of January 30.
Toronto Stock Exchange—-Bearish as of January 29, 2018.
We are on a long term buy signal for the markets of the U.S., Canada, Britain, Germany and France.

Monetary conditions (+2 means the Fed is actively dropping rates; +1 means a bias toward easing. 0 means neutral, -1 means a bias toward tightening, -2 means actively raising rates). RSI (30 or below is oversold, 80 or above is overbought). McClellan Oscillator ( minus 100 is oversold. Plus 100 is overbought). Composite Gauge (5 or below is negative, 13 or above is positive). Composite Gauge five day m.a. (8.0 or below is overbought. 13.0 or above is oversold). CBOE Put Call Ratio ( .80 or below is a negative. 1.00 or above is a positive). Volatility Index, VIX (low teens bearish, high twenties bullish), VIX % single day change. + 5 or greater bullish. -5 or less, bearish. VIX % change 5 day m.a. +3.0 or above bullish, -3.0 or below, bearish. Advances minus declines three day m.a.( +500 is bearish. – 500 is bullish). Supply Demand 5 day m.a. (.45 or below is a positive. .80 or above is a negative). Trading Index (TRIN) 1.40 or above bullish. No level for bearish.
No guarantees are made. Traders can and do lose money. The publisher may take positions in recommended securities.
.

Before we look at tonight’s chart I would like to reiterate once more that we have traded one of the best bull markets runs in history. There was hardly a time over the last year or so that the stock markets were down more than 2 or 3 days in a row. It seemed like everyday I would log on to Stock Charts in the morning the SPX would always be up 3 to 5 points. It was just a steady move higher with little volatility.
Last Friday that nice gentle uptrend we had grown accustomed to came to an exciting climax. What we are experiencing right now is the beginning of some volatility that is going to take some time to get back under control. Think of dropping a super ball off the top of the Empire State building. First you get a really big bounce followed by a big decline then another bounce that is less strong with the next bounce getting weaker. At some point the initial volatility will be reduced back into normal price action.
During those volatile swings we should see some type of consolidation pattern build out that will be unrecognizable in the beginning, but as time passes it will slowly show itself. We know where the top of the new trading range is, but the bottom still needs some confirmation that Tuesday’s low is in fact the low for this next consolidation phase.
Lets start by looking at the 12 year monthly combo chart which has the VIX on top and the SPX on the bottom. When we looked at this chart on Monday night the VIX still hadn’t reached the 43 to 47 area which has shown us in the past where an important low on the SPX was. Tuesday we got the spike into the major buy zone which is strongly suggesting an important low is in place.
That being said a new trading range should develop to consolidate our previous impulse move up similar to what happened in 2011 and 2015. As you can see the VIX spike nailed the low, but there was a lot of chopping action before then next impulse leg up began which is how markets are supposed to work. The spike in the VIX marked the low in 2010, but it still took several months of bouncing along the bottom before the SPX rallied into the 2011 high. Even the 2011 VIX spike took the SPX three months of chopping around the bottom before the next impulse started.
It’s possible that the SPX could just reverse back up and takeout January’s high, but that would be the exception and not the rule. The horizontal black dashed lines show the 2011, 2015 and now our 2018 trading range that are all the same height. At this point in time I think it’s going to be more of a time thing than anything else as far the sideways price action goes.
This next chart is a daily combo chart we’ve been following for some of the US stock market indexes which is showing some interesting price action. I have mentioned many times in the past that an important trendline never dies, it just slowly fades away. From February to September of last year most of the US stock market indexes built out a bullish rising wedge formation. Normally during a corrective phase support can be found on top of a preceding consolidation pattern.
What I did on this combo chart was to extend the top rail of the rising wedges to see if they were still hot. In most cases they held initial support. Currently all the US stock market indexes are all trading above their top rails with the RUT being the weakest which is trading right on top of its top rail extension. It would be painful, but I wouldn’t be surprised if the top rails were backtested once more for good measure. If they held again that would be a very bullish setup.
This next chart is the weekly combo chart we’ve also been following which has the all important 30 week ema on it. This week the 30 week ema was tested on all the indexes except for the tech indexes, the COMPQ and the NDX, which came very close to testing their 30 week ema. It’s been well over a year on many of these stock market indexes when the 30 week ema was last tested. So we can now add two more layers of support, the 30 week ema, the top rail of the bullish rising wedges to go with the spike on the VIX above 47.
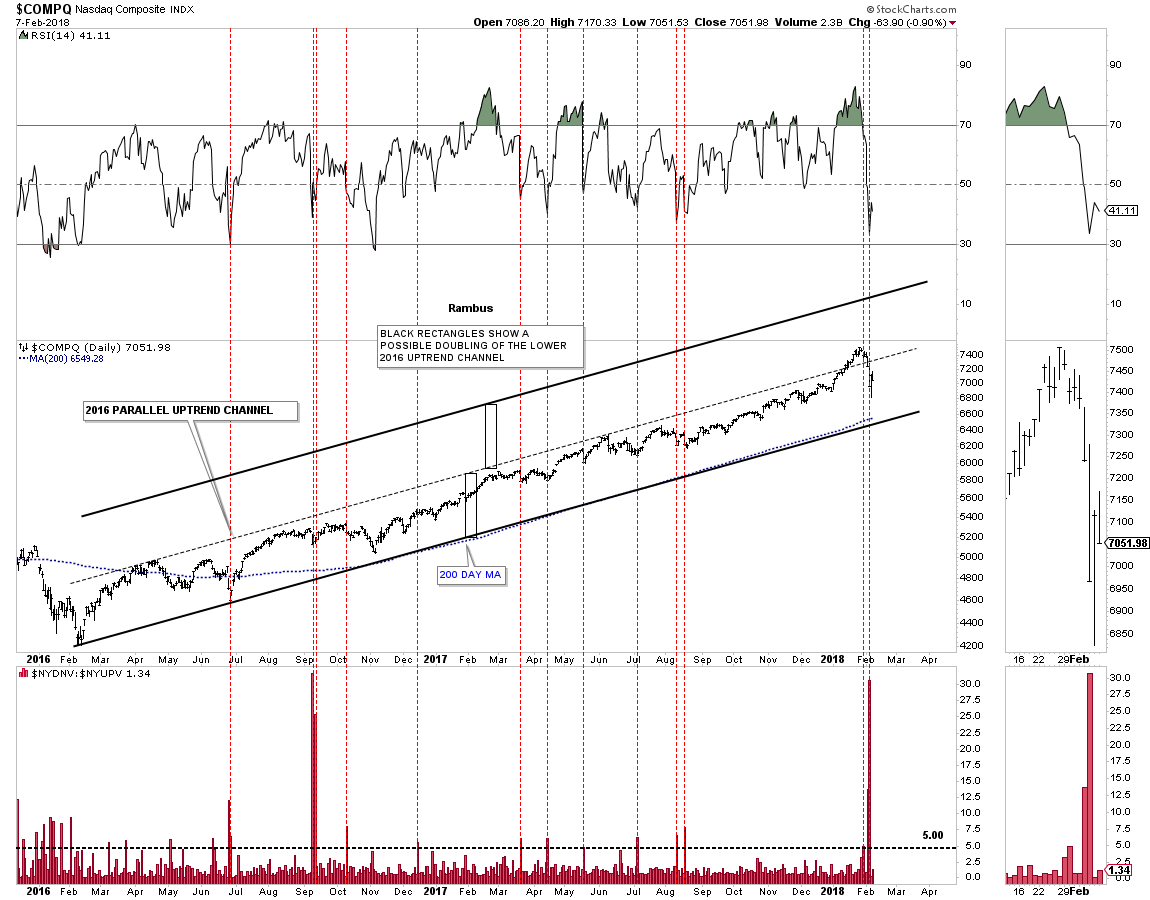
Next, lets look at some of the 2016 uptrend channels with the down to up volume chart below it, starting with the COMPQ. Normally when the down to up volume rises to 5.00 we are beginning to see some strong selling taking place which can start the bottoming process. The last time we had a massive spike in the down to up volume chart like we had on Monday was way back in September of 2015, which began the sideways trading range. Note how the 200 day moving average has formed the bottom trendline of the 2016 uptrend channel. Also note how the down to up volume spike looks on the RSI at the top of the chart.
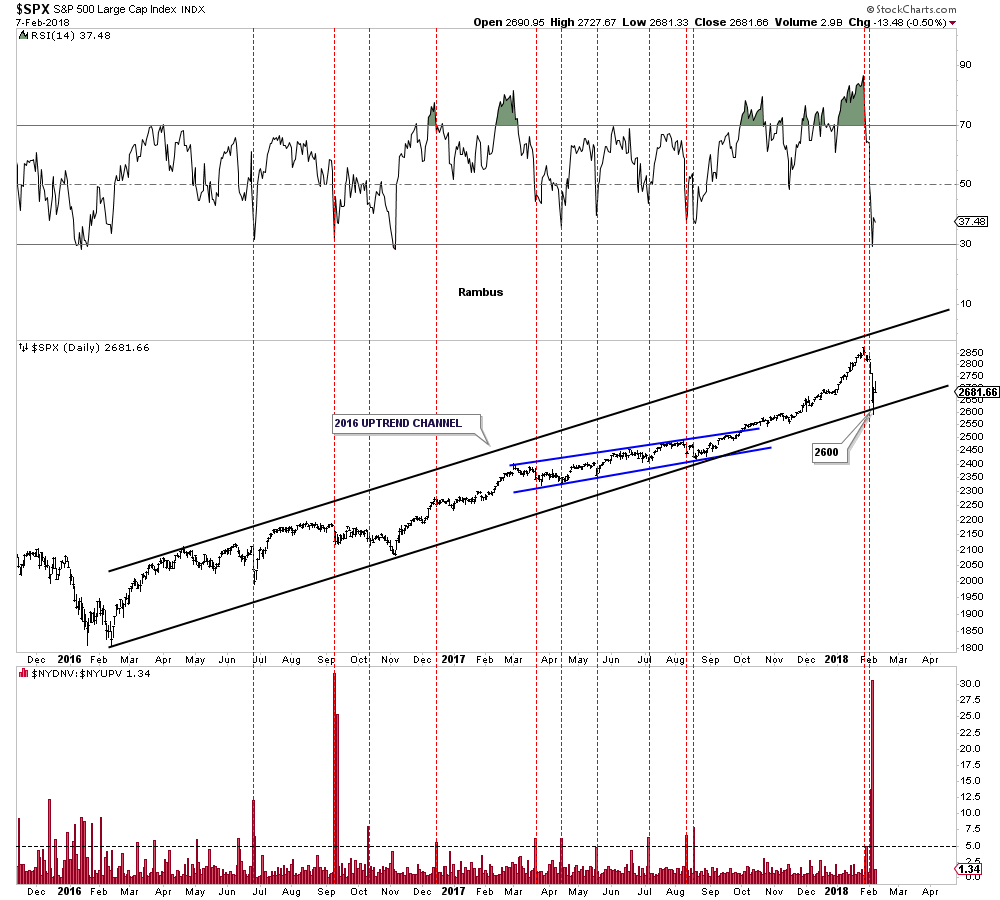
Below is the 2 year daily chart for the SPX which shows its 2016 bull market uptrend channel with the price action testing the bottom rail with the high, down to up volume spike on Monday.
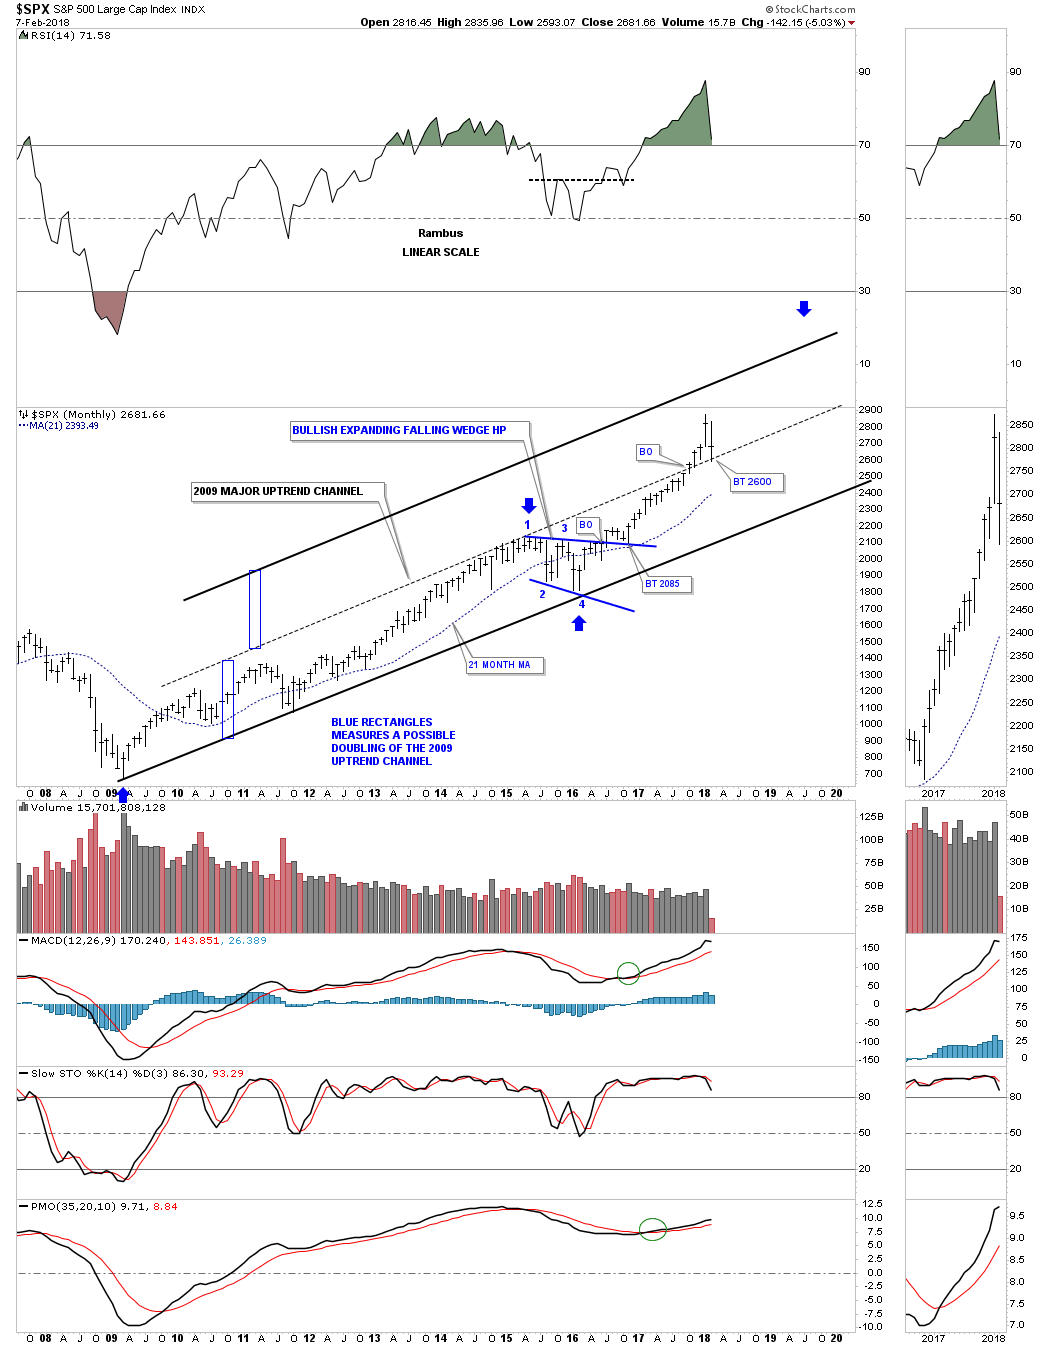
Below is a long term monthly chart for the SPX which shows its 2009 bull market uptrend channel. If the original 2009 bull market uptrend channel below the dashed mid line is in the process of doubling then I would like to see the dashed mid line hold support around the 2600 area.
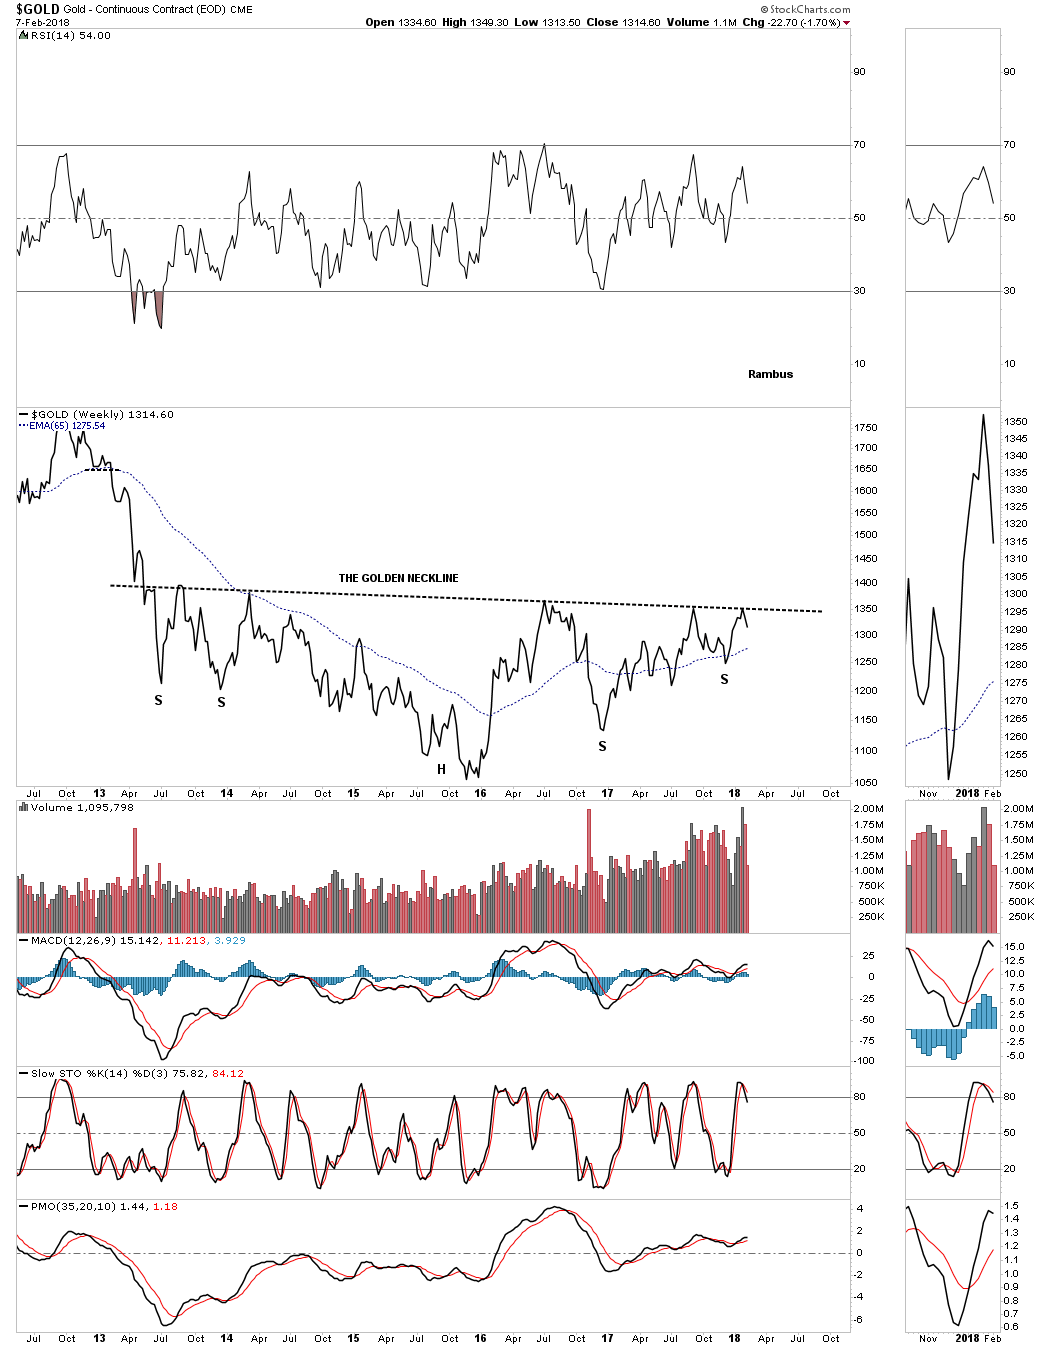
I’ve been so focused on the stock markets I haven’t had much time to look at the PM complex. Until gold can take out the golden neckline the bear market is still in force. That neckline is still holding resistance this week.
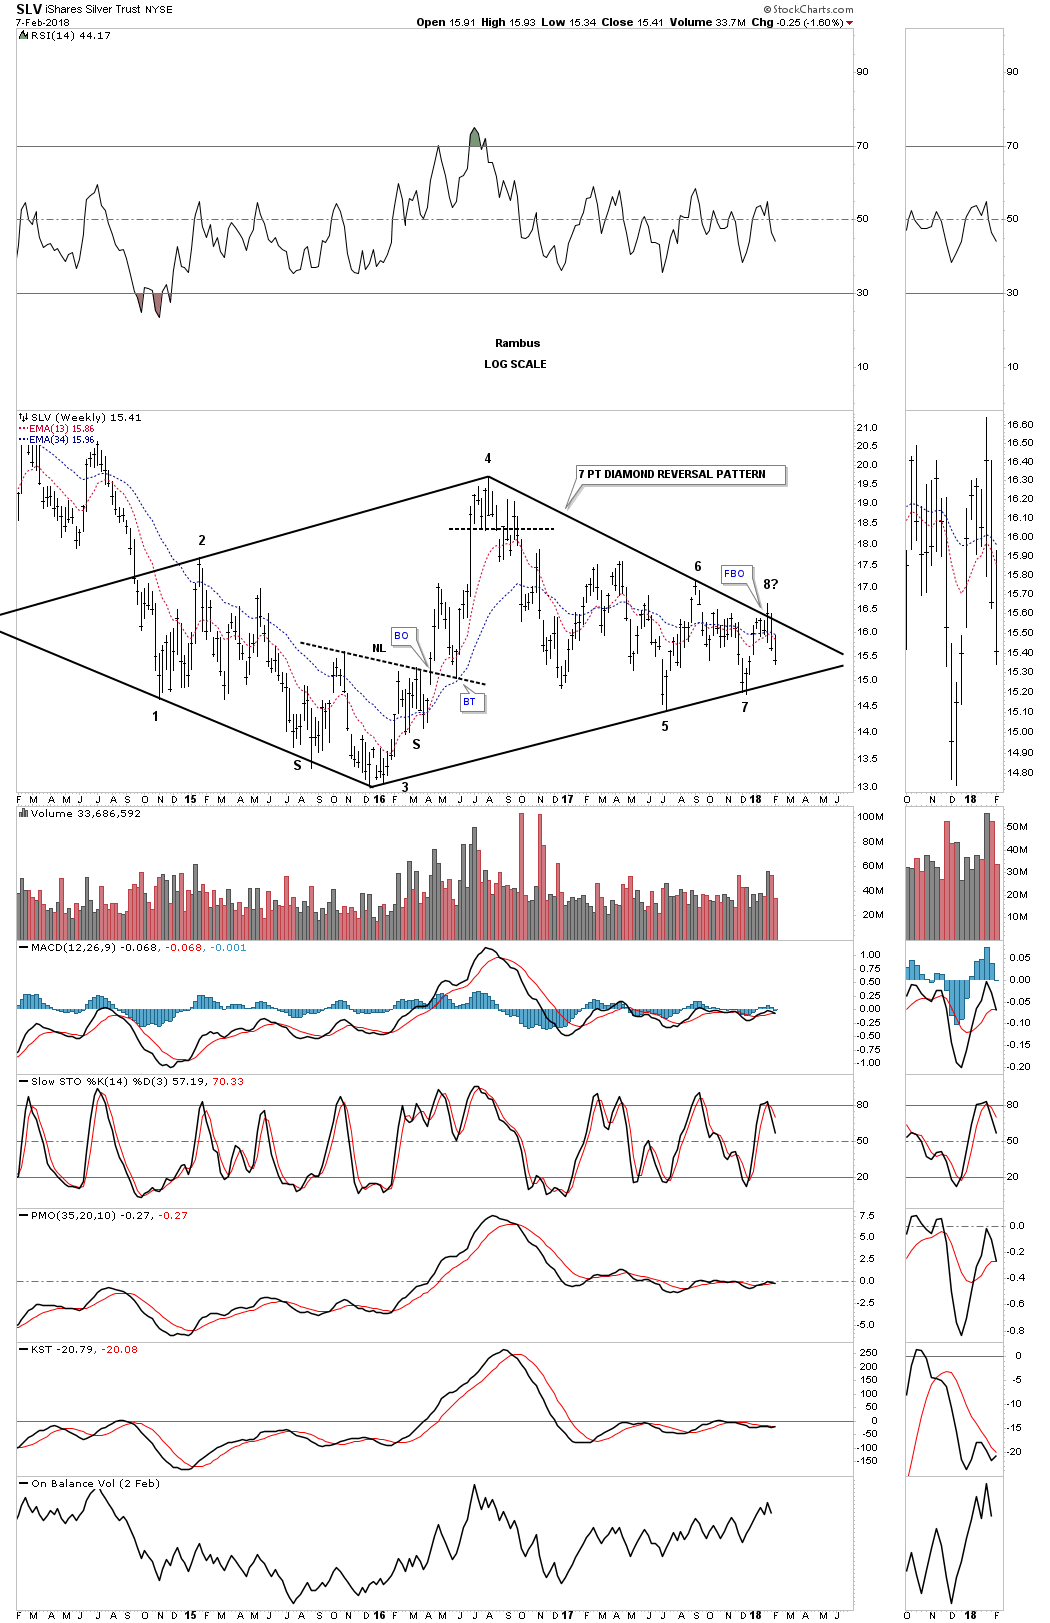
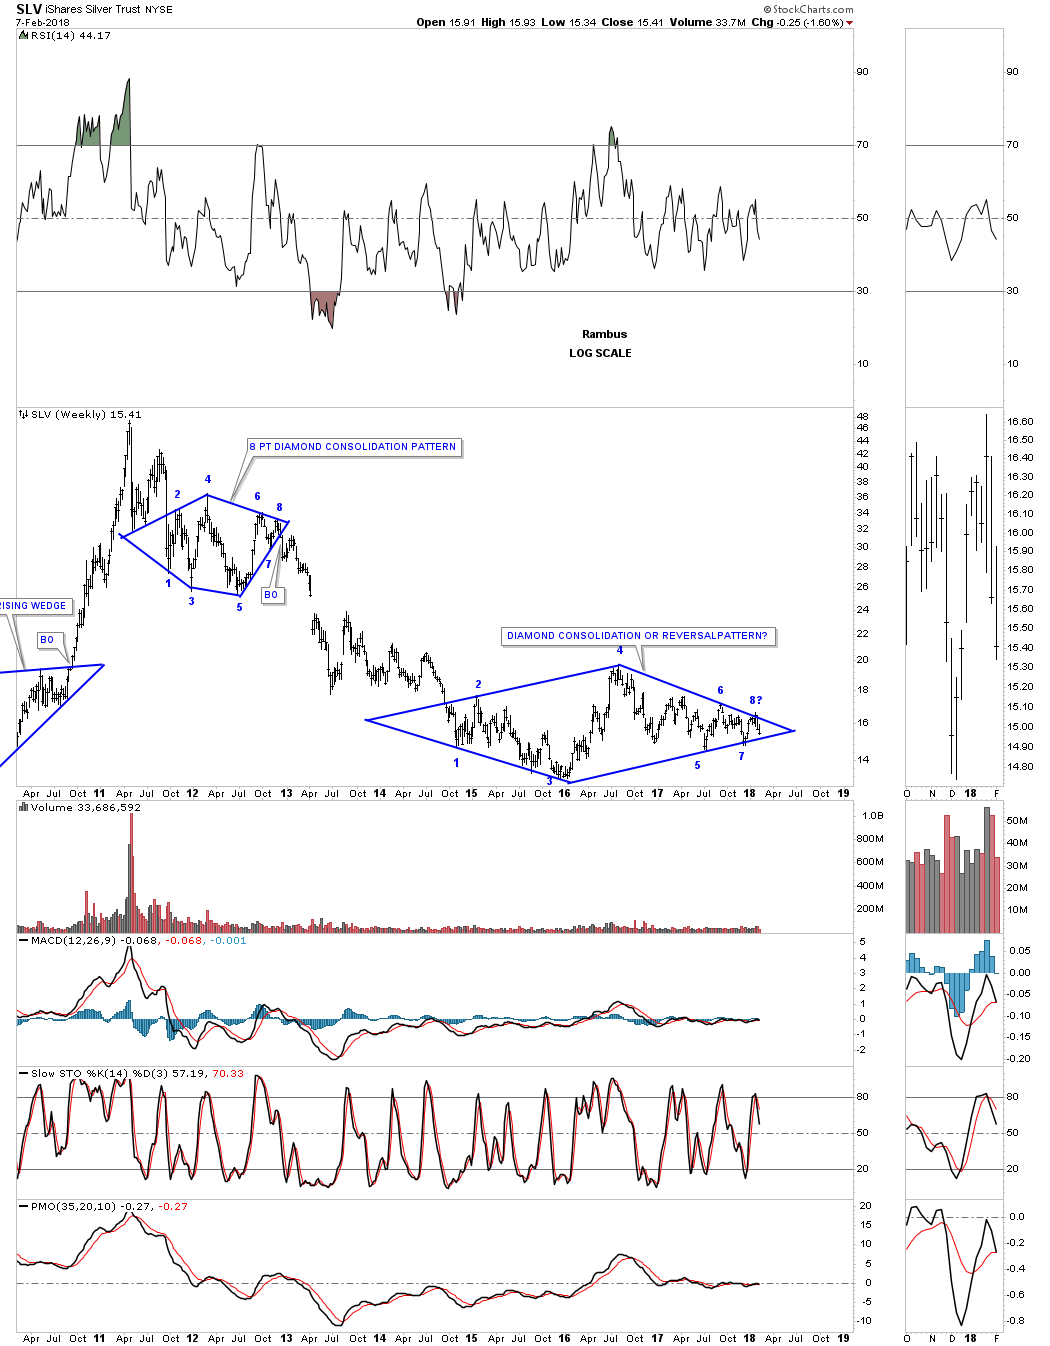
Three weeks ago it looked like SLV had a decent chance to finally breakout from that three plus year diamond pattern. When the price action hit the top rail that completed the seventh reversal point which would have put the diamond into the reversal category to the upside. The failure to breakout now put the price action into a possible 8th reversal point which would be a consolidation pattern to the downside if the bottom rail gives way. As you can see the price action is getting more compressed as the chopping action into the apex continues.
This long term weekly chart puts our current diamond in perspective. The million dollar question is what direction will the diamond breakout?
The easy part of our bull market in stocks is now over. Now the hard part starts. The volatility is going to be insane for awhile and that will drive most investors nuts. Understanding what is happening can relieve some of the pressure, but the markets are made up of emotions which is hard to control for most investors. Greed will trump fear every time. All the best…Rambus

What goes up, must come down. And it was finally the stock market’s turn to take some profits aside. Friday’s 2.13% decline in the S&P 500 was the bookend to a week’s drop of 3.86% – all while the majority of companies this week produced positive earnings and sales surprises. The correction this week served as a bearish engulfing pattern on the weekly chart, a reversal pattern of some renown.

No news event, no central bank catalyst, and no bubble bursting caused investors to sell this week. Merely, selling begot selling. Post the election in 2016, we haven’t had a 3% drawdown in the S&P 500. Looking at the counter, it has been essentially 311 trading days from the last 3% drawdown. So reversion to the mean is the name of the game.
The news this week could have fueled the advance further but it did not. Of the 251 companies that have reported their fourth quarter 2017 earnings, 80% have beaten sales estimates and 75% have beat on earnings estimates. The number of companies reporting sales surprises is record-setting with the 5-year average at 56%. The materials sector has had the largest upside surprise from estimates, at around 11%, while energy has had the largest downside difference between actual and estimated earnings, at -12%. The last report I read from FACTSET showed the earnings growth rate for Q4 stands at 13.4%, up from the estimated rate of 11% on Dec 31. Analysts are projecting S&P 500 earnings growth of 16.8% for the full 2018 year; that’s up from 12% at the beginning of the year as more companies have increased their guidance as a result of the reduction in corporate taxes.
So earnings are strong to very strong just as Seth Davis described his portfolio in the movie Boiler Room (2000): “Investors are selling stocks because earnings were better than expected.” Would make zero sense this week but that’s essentially what happened. Stock valuations are high, and it was time that a pause takes place in an otherwise uninterrupted advance in stocks.
The US stock market is mean reverting. The trend accelerated higher in January and the release valve was needed. It’s here now. With the kind of momentum we’ve seen, it’s very difficult to say that the bullish trend from November 2016 can end this immediately. A bearish reversal is formed when the bulls fail to rally prices to a higher high in the month to come. Calling a top here would be premature. In the article, Records Were Made to Be Broken, Chris Puplava showed in a study he did that the average returns for the S&P 500 from 1928 to today after the weekly relative strength indicator hit 80 were 4.23%, 8.46%, and 13.63% looking at forward returns 3, 6, and 12-months after the event. Momentum like we’ve had, without the parabolic move, usually paints a positive outlook for returns in the near future. So as we revert, don’t hit the red alert.
That said, certain stocks are trading in parabolic moves, many standard deviations away from their 200-day moving average. In such cases, it would be hard-pressed to say such moves could be prolonged so take precautions to set stop losses. Setting stop losses is just good unemotional risk management. As Steve Nison, a valued technician who formalized Japanese Candlesticks in the US through his books says, “all long-term trends begin as short-term moves”. The crystal ball is cloudy. Though the economy is strong, and Treasury yields have been rising on those terms, nobody knows at which point the top will show up.
For more information about Financial Sense® Wealth Management, our investment models, or investment services, click here to visit our website.


