
Stocks & Equities
STOCKS: So why did the market finally move lower after 8 days of positive breadth in a row? Some cited the unrest in Ukraine and Thailand. Others discussed a new terrorist threat for airplanes coming in from abroad.
We know the market likes to screw up as many investors as possible. A friend and fellow analyst, David Nichols of the Fractal Market Report suggested that the market destroyed the longs in January and then destroyed the shorts in February. We can see that in the chart.
CHART: The S&P 500 curled down from an overbought condition. Tops are not as easy to pinpoint as bottoms, but this is normally a negative for the next several days or weeks. Stay tuned.
SHORT TERM TREND Bearish
INTERMEDIATE TERM TREND Bearish

RANKED # 1 BY TIMER DIGEST
Timer Digest of Greenwich, CT monitors and ranks over 100 of the nation’s best known stock market advisory services.
Once per year in January, Timer Digest publishes the rankings of all services monitored for multiple time frames.
For the years 2003, 2004 and 2005, The Todd Market Forecast was rated # 1 for the preceding ten years. For the year 2006, we slipped to # 3 and in 2007, we were ranked # 5.
Our bond timing was rated # 1 for the years 1997, 2007 and 2008.
Gold timing was rated # 1 for 1997 and # 2 for 2006. Late word! We were rated # 1 for 2011.
We were # 1 in long term stock market timing for the years 1998 and 2004 and # 4 in 2010.
To subscribe go to Contact Us.

Stocks declined on Wednesday in midday trading as the S&P 500 faced a technical resistance level after a recent string of gains and investors turned cautious ahead of the release of the minutes from the Federal Reserve’s latest policy meeting.
At 2:00 p.m. EST, the Fed will release minutes from its January policy meeting, when the U.S. central bank decided to further trim its monthly bond-buying program.
“I don’t think the market is going to be surprised, but there is always caution ahead of these minutes. I think the one thing to look for is the collaboration between Bernanke and Yellen since this was Bernanke’s last meeting,” said Randy Frederick, managing director at Charles Schwab, in Austin, Texas.

A picture says a thousand words. That’s why the ability to read a stock chart is important for every investor, even on a basic level.
Read them incorrectly, and they can lead you in a very wrong direction. And if the data they contain is skewed, an investor has no chance!
For example, the chart below has made its rounds all over the Web and social media for the past several weeks. Bearish writers see a frightening similarity between the period just before the 1929 Crash and today.

Another such crash would be scary — but you see it in this chart only because someone completely manipulated the data!
Notice the numerical scales on each side. The left side is the Dow’s range today and the right side is the Dow in 1928-’29.
On a percentage basis, a drop from 400 to 200 is a 50% loss. A drop from 17,200 to 12,400 would be only a 28% loss.
The mismatched scales make 1928-’29 look much worse.
The next chart uses the broader S&P 500 instead of the 30-stock Dow Jones Industrial Average — and restarts both indexes at 100.
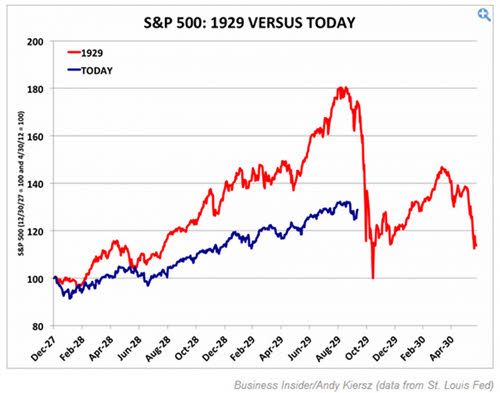
As you can see, today’s bull market isn’t remotely like the one leading up to the 1929 plunge.That doesn’t mean another crash is impossible — but it also doesn’t look imminent.
***
I’m not showing these charts to dispute anyone’s market outlook. My point is that it’s easy to look at two completely unrelated markets and draw a wrong conclusion — especially if you twist the data to “prove” your point.
Whoever first drew the “scary parallel” was probably already bearish for other reasons. He or she went looking for evidence to support a pre-determined conclusion.
That’s exactly backward. What you want to do is look at the data first and then decide what it means. If you already believe something, you’ll always find plenty of evidence for it.
I find many investors and even some analysts in our industry look for stories to support their market bias. Right now, I don’t see anything that would warrant a drop comparable to 1929.
The market benchmarks looked impressive last week and today, they clawed back toward break-even after a rough start to the year. That’s encouraging in the short term.
It needs to continue, though. We aren’t out of the woods yet.
***
My stories last week about the Keystone pipeline, Cutting the Cable TV Cord, and February Frugality brought tons of reader responses. Thanks!
Below are some quick examples. I’ll try to run more if no other big stories pop up this week.
***
Gene says he is an engineer and not afraid of Keystone.
Reader Gene R. says: “Energy pipelines are far better than thousands upon thousands of rail cars and tanker trucks rolling around. Remember, each one of those is loaded and unloaded with a large flexible hose and a lot gets spilled in the process, not to mention little leaks everywhere — it’s just reality. Plus, the vehicles are very dangerous to everybody else on the highways.”
Brad: Thanks, Gene!
***
Don is helping his parents save $1,000 a year …
Reader Don C. says: “Yes, I have cut the (pay TV) cord and am headed that way for my parents who are on a limited fixed income since retiring with little investments. The FCC has a webpage explaining how to do it. One link provides an estimate of local HD TV signal strength and identifies the channels based on ZIP Codes. The site shows the tower signal directions to help one aim the antenna to maximize reception.
“My parents can expect up to 37 channels and lower their TV expenses by about $1,000 annually since they do not use the Internet. With a $10 splitter, they can operate multiple TVs from one antenna. A $40 omnidirectional antenna suits their location since they are in a metro area versus rural location.”
Brad: The FCC web link is great, Don. Thank you for sharing.
***
Finally, this frugal reader thinks inflation understates the real cost of living.
Reader Shirley says: “Yes, I think people are cutting back on everything. The government tries to tell us inflation is not a problem. What country do they live in or what grocery store do they shop? Gas, clothes, food, everything is going higher. Cable TV, utilities and city services are going crazy.
“How is the average person to make a living? I don’t think we have seen anything yet. How can the average family save any money for a rainy day?”
Brad: I feel your frustration, Shirley. Officially, inflation is very low, but it’s still high enough to crimp consumer spending. Let’s hope it doesn’t get too far out of control.
***
You can go back and read the articles that inspired these comments at the links above. The feedback box is open for other topics, too. Just click here to send me a message.
***
Here is some news to start a shortened market week…
- The Nasdaq Composite had a good day, thanks to M&A action in the biotechnology space. The Dow and S&P 500 lagged.
- The ubiquitous Carl Icahn is doing well in Forest Labs (FRX), which jumped 27.5% today after a buyout offer from Actavis (ACT). Other biotech stocks jumped on speculation more such deals are coming.
- Coca-Cola (KO) held back the Dow today. The company reported its biggest quarterly loss since 2011, in part because of weak emerging market sales.
- Gold prices crept higher still. The April futures contract settled at $1,324.40 today, up another $5.80 despite some weakness earlier in the day.
- Silver and platinum look stronger, too. Maybe these are signs of that inflation pressure the Fed doesn’t see?
- Homebuilder stocks slid after a builder sentiment report looked weak. It turns out people don’t like visiting model homes during blizzards.
- The winter of discontent jumped hemispheres. Violent protests are still gripping the Ukraine, and now student protestors are blocking streets in Caracas, Venezuela.
European stock markets stay lower after the German ZEW survey indicates investors are less optimistic about the economic future in the euro zone’s largest economy than they were a month ago.
….full article HERE
“It’s not just tapering that is putting pressure on markets,” Marc Faber warns in thie brief clip. “Emerging economies have practically no growth and we have a slowdown in China that is more meaningful than strategists are willing to believe,” he adds and this is “causing a vicious circle to the downside” in inflated asset markets as most of the growth in the world over the last five years has come from emerging markets. Faber suggestsTreasuries as a safe haven in the short-term; but is nervous of their value in the long-term as “debt is becoming burdensome on the system.”
“A lot of economic growth was driven by soaring asset prices”
“For the next three to six months probably they are a better place to be than equities,”
“I don’t like [10-year Treasurys] for the long-termbecause the maximum you can earn is something like 2.65 percent per annum for the next 10 years, but Treasurys are expected to rally because of economic weakness and a stock market decline. In the last few years at least there was a flight into quality – that is, a flight into Treasurys.”
On China and shadow banking defaults:
“China can handle it by printing money but it will again have unintended negative consequences… but the
problem is real… but it’s not just in China…”
Faber warned of the risks of the present global credit bubble and said another slowdown could follow on the back of rising consumer debt levels – which had previously helped to create growth.
“Total credit as a percent of the global economy is now 30 percent higher than it was at the start of the economic crisis in 2007, we have had rapidly escalating household debt especially in emerging economies and resource economies like Canada and Australia and we have come to a point where household debt has become burdensome on the system—that is, where an economic slowdown follows.”
Marc Faber is an international investor known for his uncanny predictions of the stock market and futures markets around the world.Dr. Doom also trades currencies and commodity futures like Gold and Oil.
You might also like:


-
I know Mike is a very solid investor and respect his opinions very much. So if he says pay attention to this or that - I will.
~ Dale G.
-
I've started managing my own investments so view Michael's site as a one-stop shop from which to get information and perspectives.
~ Dave E.
-
Michael offers easy reading, honest, common sense information that anyone can use in a practical manner.
~ der_al.
-
A sane voice in a scrambled investment world.
~ Ed R.
Inside Edge Pro Contributors

Greg Weldon

Josef Schachter

Tyler Bollhorn

Ryan Irvine

Paul Beattie

Martin Straith

Patrick Ceresna

Mark Leibovit

James Thorne

Victor Adair