
Stocks & Equities
Two views, one from Forbes Magazine’s June 30th Issue titled How Much Will You Earn On Your Stocks And Bonds? and the following with an interesting take right underneath 1. Interest Rate – Editor Money Talks
As pointed by Warren Buffett, the percentage of total market cap (TMC) relative to the US GNP is “probably the best single measure of where valuations stand at any given moment.”
As of today, the Total Market Index is at $ 20796.5 billion, which is about 121.6% of the last reported GDP. The US stock market is positioned for an average annualized return of 1.2%, estimated from the historical valuations of the stock market. This includes the returns from the dividends, currently yielding at 2%.
Over the long term, the returns from stock market are determined by these factors:
1. Interest rate
Interest rates “act on financial valuations the way gravity acts on matter: The higher the rate, the greater the downward pull. That’s because the rates of return that investors need from any kind of investment are directly tied to the risk-free rate that they can earn from government securities. So if the government rate rises, the prices of all other investments must adjust downward, to a level that brings their expected rates of return into line. Conversely, if government interest rates fall, the move pushes the prices of all other investments upward.”—Warren Buffett
2. Long Term Growth of Corporate Profitability
Over the long term, corporate profitability reverts to its long term-trend, which is around 6%. During recessions, corporate profit margins shrink, and during economic growth periods, corporate profit margins expand. However, long-term growth of corporate profitability is close to long-term economic growth. The size of the US economy is measured by Gross National Product (GNP). Although GNP is different from GDP (gross domestic product), the two numbers have always been within 1% of each other. For the purpose of calculation, GDP is used here. The U.S. GDP since 1970 is represented by the green line in the first of the three charts to the right.
3. Market Valuations
Over the long run, stock market valuation reverts to its mean. A higher current valuation certainly correlates with lower long-term returns in the future. On the other hand, a lower current valuation level correlates with a higher long-term return. The total market valuation is measured by the ratio of total market cap (TMC) to GNP — the equation representing Warren Buffett’s “best single measure”. This ratio since 1970 is shown in the second chart to the right. Gurufocus.com calculates and updates this ratio daily. As of 06/19/2014, this ratio is 121.6%.
We can see that, during the past four decades, the TMC/GNP ratio has varied within a very wide range. The lowest point was about 35% in the previous deep recession of 1982, while the highest point was 148% during the tech bubble in 2000. The market went from extremely undervalued in 1982 to extremely overvalued in 2000.
Based on these historical valuations, we have divided market valuation into five zones:
| Ratio = Total Market Cap / GDP | Valuation |
|---|---|
| Ratio < 50% | Significantly Undervalued |
| 50% < Ratio < 75% | Modestly Undervalued |
| 75% < Ratio < 90% | Fair Valued |
| 90% < Ratio < 115% | Modestly Overvalued |
| Ratio > 115% | Significantly Overvalued |
| Where are we today (06/19/2014)? | Ratio = 121.6%, Significantly Overvalued |
A quick refresher (Thanks to Greenbacked): GDP is “the total market value of goods and services produced within the borders of a country.” GNP is “is the total market value of goods and services produced by the residents of a country, even if they’re living abroad. So if a U.S. resident earns money from an investment overseas, that value would be included in GNP (but not GDP).” While the distinction between the two is important because American firms are increasing the amount of business they do internationally, the actual difference between GNP and GDP is minimal as this chart from the St Louis Fed demonstrates:
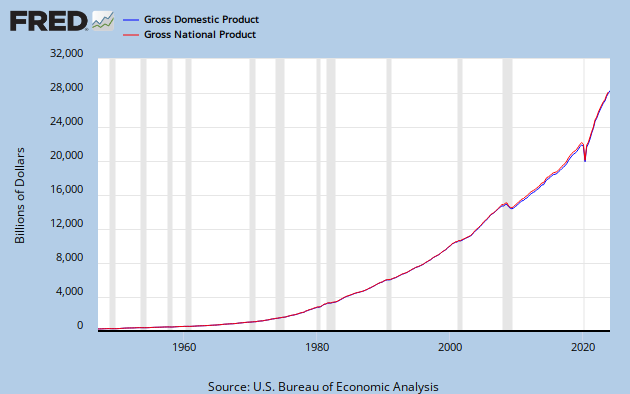

GDP in Q4 2012 stood at $15,851.2 billion. GNP at Q3 2012 (the last data point available) stood at $16,054.2 billion. For our present purposes, one substitutes equally as well for the other.
The Sources of Investment Returns
The returns of investing in an individual stock or in the entire stock market are determined by these three factors:
1. Business growth
If we look at a particular business, the value of the business is determined by how much money this business can make. The growth in the value of the business comes from the growth of the earnings of the business growth. This growth in the business value is reflected as the price appreciation of the company stock if the market recognizes the value, which it does, eventually.
If we look at the overall economy, the growth in the value of the entire stock market comes from the growth of corporate earnings. As we discussed above, over thelong term, corporate earnings grow as fast as the economy itself.
2. Dividends
Dividends are an important portion of the investment return. Dividends come from the cash earning of a business. Everything equal, a higher dividend payout ratio, in principle, should result in a lower growth rate. Therefore, if a company pays out dividends while still growing earnings, the dividend is an additional return for the shareholders besides the appreciation of the business value.
3. Change in the market valuation
Although the value of a business does not change overnight, its stock price often does. The market valuation is usually measured by the well-known ratios such as P/E, P/S, P/B etc. These ratios can be applied to individual businesses, as well as the overall market. The ratio Warren Buffett uses for market valuation, TMC/GNP, is equivalent to the P/S ratio of the economy.
What Returns Is the Market Likely to Deliver From This Level?
Putting all the three factors together, the return of an investment can be estimated by the following formula:
Investment Return (%) = Dividend Yield (%)+ Business Growth (%)+ Change of Valuation (%)
The first two items of the equation are straightforward. The third item can be calculated if we know the beginning and the ending market ratios of the time period (T) considered. If we assumed the beginning ratio is Rb, and the ending ratio is Re, then the contribution in the change of the valuation can be calculated from this:
(Re/Rb)(1/T)-1
The investment return is thus equal to:
Investment Return (%) = Dividend Yield (%) + Business Growth(%) + (Re/Rb)(1/T)-1
This equation is actually very close to what Dr. John Hussman uses to calculate market valuations. From this equation we can calculate the likely returns an investment in the stock market will generate over a given time period. In the calculation, the time period we used was 8 years, which is about the length of a full economic cycle. The calculated results are shown in the final chart to the right. The green line indicates the expected return if the market trends towards being undervalued (TMC/GNP=40%) over the next 8 years from current levels, the red line indicates the return if the market trends towards being overvalued (TMC/GNP=120%) over the next 8 years. The brown line indicates the return if the market trends towards being fair-valued (TMC/GNP=80%) over the next 8 years.
The thick light blue line in the bottom right chart is the actual annualized return of the stock market over 8 years. We can see the calculations largely predicted the trend in the returns of the stock market. The swing of the market’s returns is related to the change in interest rates.
It has been unfortunate for investors who entered the market after the late 1990s. Since that time, the market has nearly always been overvalued, only dropping to fairly valued since the declines that began in 2008. Since Oct. 2008, for the first time in 15 years, the market has been positioned for meaningful positive returns.
As of 06/19/2014, the stock market is likely to return 1.2% a year in the next 8 years.
Warren Buffett’s Market Calls
Based on these factors, Warren Buffett has made a few market calls in the past. In Nov. 1999, when the Dow was at 11,000, and just a few months before the burst of dotcom bubble, the stock market had gained 13% a year from 1981-1998. Warren Buffett said in a speech to friends and business leaders, “I’d like to argue that we can’t come even remotely close to that 12.9… If you strip out the inflation component from this nominal return (which you would need to do however inflation fluctuates), that’s 4% in real terms. And if 4% is wrong, I believe that the percentage is just as likely to be less as more.”
Two years after the Nov. 1999 article, when the Dow was down to 9,000, Mr. Buffett said, “I would expect now to see long-term returns run somewhat higher, in the neighborhood of 7% after costs.”
Nine years have passed since the publication of the article of November 22, 1999, and it has been a wild and painful ride for most investors; the Dow climbed as high as 14,000 in October 2007 and retreated painfully back to 8,000 today. Warren Buffettagain wrote in Oct. 2008: Equities will almost certainly outperform cash over the next decade, probably by a substantial degree.”
Related Links:
1. Warren Buffett Stock Picks
2. Buffett-Munger Screener: The stocks young Warren Buffett would buy
3. Market Valuations as measured by Shiller P/E ratio

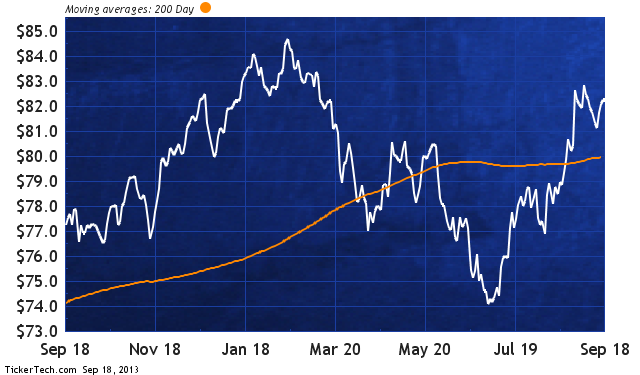
The CBOE Volatility Index (VIX) has dropped below 12. Below 12!!! Surely this must be one of the signs of the apocalypse.

Not so fast. A low VIX is a sign of option trader complacency, and complacency is a problematic sign for the market which can lead to a price decline. But when the VIX gets really REALLY low, the message changes. Sure, it is a sign of an absence of worry, and a correction is possible. But the really big price tops do not appear when the VIX is this low.
In 2000, the SP500 topped after the VIX had climbed up from the really low levels of a few years earlier. The final price top came when the VIX was at 16.54.
In 2007, the SP500 again topped with the VIX above 16. It had been much lower earlier that year, bottoming below 12 in April 2007 well in advance of the final price high. This is a consistent theme.
[Must Read: The Two Most Powerful Forces Pushing the Stock Market Higher]
When a toy top spins, it is at its most stable point when the RPM are high enough to maintain stability. Gradually the friction against the tip spinning on the floor slows the top, and the top starts to wobble. The wobbling is a prelude to the top falling over completely. In other words, instability increases ahead of the tipping point. When everything is as stable as it can be, that is not yet the tipping point. So while a VIX reading below 12 is a quite spectacular condition, history says it is not the sign of an ultimate price top.
On a shorter term time scale, the VIX can give us a hint of a brief change in trend direction. It is normal for the VIX to make a lower low as the SP500 makes a higher high. But when there is a disagreement, THAT is when we get useful information from the VIX. We have a tiny little divergence right now, with the VIX making higher postings at the same time when the SP500 is also making higher highs. On a short term basis, this is a sign of the spinning top starting to wobble, and sets up the opportunity for a countertrend price drop.

The divergence is a setup for potential trouble. The real trouble for short term price movements typically comes when the VIX rises up above its 50-day moving average (50MA). That is a topic I addressed here.
But we should not confuse a short term setup for a corrective move with the signs of a more important long term top. Seeing the VIX go this low is NOT the sort of condition consistent with the major tops of the past.
Related Charts (click image for larger view)
Golf Balls, Geese, and the VIX

Year-End VIX Plunge Coming

VIX ETN Not Right For Investors

(1) BEI.UN.CA Falls to Levels Below Book Value triggered: 06/10/2014
Boardwalk Real Estate Investment Trust is an unincorporated, open-ended real estate investment trust company. Through its subsidiaries, Co. is engaged in investing in revenue producing multi-family residential properties or interests.
| ame: | Boardwalk Real Estate Investment Trust | |
| Website: | www.boardwalkREIT.com | |
| Sector: | REITs | |
| Number of ETFs Holding BEI.UN.CA: | 3 (see which ones) | |
| Total Market Value Held by ETFs: | $21,078,215 | |
| Total Market Capitalization: | $3,108,000,000 | |
| % of Market Cap. Held by ETFs: | 0.68% | |
Click on the image to view all 10 Stocks
The FT reports “a cluster of central banking investors has become major players on world equity markets.” – Editor Money Talks
Of all the questions that need answers, I can think of none as universally pertinent as this:
Who is watching the watchers?
The question can be universally applied to just about every controversy and issue in the last several years.
The Patriot Act, rise of the police state, and big data retention with the subsequent rise of hacking certainly could use an answer to the question.
The NSA’s litany of issues need answering too, from wholesale mass surveillance, to lying to Congress while clandestinely monitoring congress members, to claiming that it cannot possibly provide court-mandated records because the systems are too complex to stop deleting evidence.
Here is one to add to the list — central banks and their new and increasingly dangerous addiction to the asset bubble and rising global systemic risk.
Positive Feedback Loop
Today, an organization called the Official Monetary and Financial Institutions Forum is releasing a report called Global Public Investor 2014.
This is the first comprehensive survey of investments held by 400 public sector institutions in 162 countries. These institutions now have $29.1 trillion in market investments, equivalent to about 40% of the global gross domestic product.
 The dominant group in this report is made up of central banks, and they account for $13.2 trillion of the assets.
“A cluster of central banking investors has become major players on world equity markets,” says the report. In a diplomatically worded warning, it also stated that the trend “could potentially contribute to overheated asset prices.”
It appears that the unprecedented economic interventions and policies designed to force investors and businesses into swallowing risk to pursue any meaningful returns have created a positive feedback loop.
Here is how it works:
1. Central banks offer incredibly low interest rates to spur investment by investors and businesses.
2. Investors are forced to accept higher risk to see any gains. Companies with reasonable valuations become increasingly rare.
3. Thanks to incredibly cheap debt from the low interest rates, businesses take the easy path to entice these investors by using share buybacks. They use rotating debt to boost earnings per share, instead of capital expenditures to create meaningful long-term growth.
Corporations capitalized on these low interest rates by issuing $18.2 trillion worth of bonds worldwide since 2008. Currently outstanding corporate debt has risen over 50% to $9.6 trillion over the same period.

4. The policies enacted by the central banks reduce their own revenue. To make up for the shortfall, the central banks invest in the very equities that they are forcing everyone else to buy.
5. Valuations creep up more as fundamentals are abandoned. More businesses and investors chase artificially inflated stock market gains.
6. Central bank policies become increasingly hard to change because any correction would be more severe. Investors, businesses and the central banks themselves would take greater losses. Interest rates stay abnormally low, and the behavior reinforces itself and repeats.
The “Minsky Moment”
At a certain point, this runaway positive feedback loop makes a “Minsky Moment” inevitable.
Paul McCulley of PIMCO coined this term back in 1998, naming it after the late economist Hyman Minsky.
Minsky’s work focused on understanding and explaining the characteristics of financial crises. In particular, he looked at credit cycles.
He argued that during prosperous times, when corporate cash flow rises beyond what is needed to pay off debt, a speculative euphoria develops. Debts eventually start to exceed what borrowers can pay off from their incoming revenue.
Banks and lenders are forced to tighten credit, even to companies that can afford loans. Unsustainable debt causes the forced sale of some assets.
This causes others to sell assets, which causes asset values to drop further and more forced sales to occur.
In the end, far more investors and businesses take greater losses than were actually required to correct the unstable bubble.
Interest rates will have to go up. There is no way around it in the long run. This could easily trigger the Minsky moment for us.
Since many corporations chose to forgo meaningful capital growth and focus on share buybacks, there is little room for revenue growth, making the increasingly expensive debt harder to maintain when rates rise.
If corporations start to fall, a shock would spread through the web of interconnected business to business spending and creditors.
The longer the positive feedback loop created by central banks persists without correction, the wider the gulf between reasonable equity prices and current prices becomes, the greater the damage.
Drinking the Kool-Aid
Perhaps a more reasonable scenario would be panning out right now if there wasn’t an unquestioned belief that central bankers know what they are doing and are in control.
Congress is technically in charge of central bank oversight, but is poorly equipped to question the Fed, let alone understand the implications of complex macroeconomic consequences.
As such, it is much like the NSA. Unless a question is perfectly worded, the same canned general responses are used.
For actual verification of what Congress is told, it takes specific legislation. Case in point: the amendment Sen. Bernie Sanders added to the Wall Street reform law in late 2011.
The amendment directed the GAO to do a comprehensive audit of the Fed. When the report was released, it detailed $16 trillion of transactions in bailouts to domestic and international corporations and banks, there was nothing that could be done about it.
Sen. Bernie Sanders stated, “No agency of the United States government should be allowed to bailout a foreign bank or corporation without the direct approval of Congress and the president.”
Yet there were no consequences for their actions and the implications were under-reported. The same will happen with the fallout from the feedback loop the Fed created. We’ll be reading about it in a postmortem report.
There is no oversight on how central banks are investing in equities. There are no 13F forms to publish holdings and keep tabs on the portfolio. The only option is to trust that they know what they’re doing.
Don’t question the Fed’s actions or the two starkly different classes it is creating in America. Keep buying overvalued equities. Keep making the inevitable “Minsky moment” worse and worse.
If this trend keeps up, central banks will implode with the blind faithful because they bought into their own manipulative scheme.
For your own sake, be very careful and have a contingency plan in place. Don’t drink the Kool-Aid with them.
Take Care,
Adam English
About Adam English
Adam’s editorial talents and analysis drew the attention of senior editors at Outsider Club, which he joined in mid-2012. While he has acquired years of hands-on experience in the editorial room by working side by side with ex-brokers, options floor traders, and financial advisors, he is acutely aware of the challenges faced by retail investors after starting at the ground floor in the financial publishing field. For more on Adam, check out his editor’s page.
*Follow Outsider Club on Facebook and Twitter.
 Gabelli’s 19.7% 5 year return boosts his average to 12.6% since inception of Gabelli Asset Management Company in 1987.
He is the founder, chairman, and CEO of his $30 billion dollar global investment firm headquartered in Rye, New York. Click on the image or HERE to see this comprehensive and easy to read the sector analysis and what Gabelli is Buying/Selling/Holding – Editor Money Talks

-
I know Mike is a very solid investor and respect his opinions very much. So if he says pay attention to this or that - I will.
~ Dale G.
-
I've started managing my own investments so view Michael's site as a one-stop shop from which to get information and perspectives.
~ Dave E.
-
Michael offers easy reading, honest, common sense information that anyone can use in a practical manner.
~ der_al.
-
A sane voice in a scrambled investment world.
~ Ed R.
Inside Edge Pro Contributors

Greg Weldon

Josef Schachter

Tyler Bollhorn

Ryan Irvine

Paul Beattie

Martin Straith

Patrick Ceresna

Mark Leibovit

James Thorne

Victor Adair