
Stocks & Equities
On Monday, the S&P 500 hit 2000 for the first time ever. This target was something I laid out very early this year following the Federal Reserve announcement in December that they would begin tapering the current Quantitative Easing (QE) program. To wit:
“This is something that I discussed previously . The chart below shows the historical correlation between increases in the Fed’s balance sheet and the S&P 500. I have also projected the theoretical conclusionof the Fed’s program by assuming a continued reduction in purchases of $10 billion at each of the future FOMC meetings.”
If the current pace of reductions continues, it is reasonable to assume that the Fed will terminate the current QE program by the October meeting. If we assume the current correlation remains intact, it projects an advance of the S&P 500 to roughly 2000 by the end of the year. This would imply an 8% advance for the market for the entirety of 2014.”
(**Note: for those interested in Sector Analysis Lance’s current has 8 charts & 4 Tables HERE – Editor Money Talks )

Note: The chart has been updated to current balance sheet and market figures.)
Following last week’s conclusion of the Jackson Hole Economic Symposium, Janet Yellen did indeed confirm that current round of Quantitative Easing will be completed by October. Via Bloomberg:
*YELLEN REITERATES ASSET BUYING TO BE COMPLETED IN OCTOBER
Next Stop 2100
Now that my target was achieved four months sooner than anticipated, and given that the Federal Reserve is on course to raise interest rates by mid-2015, the question is now “what next?
[For the record, no one really can forecast the future. These are just “best guesses” based on current data trends and are subject to exogenous shocks that change the underlying market dynamics.]
The chart below shows the current trend of the S&P 500 from the 2009 lows until present.

The orange dashed line shows the trend of the market from the 2009 lows through the initial market correction in 2010 following the end of the first round of QE. Very quickly, Bernanke figured out that the economy was far too weak to operate without support, and he quickly launched a second round of QE in September of 2011. However, the damage was done as the market broke the previous bullish trend line turning that previous support into permanent resistance.
The market was able to establish a new trend (blue dashed line) which became successful support during to declines in 2012 as the markets struggled with the demise of QE2. If you reference the first chart above, you will notice the Federal Reserve’s balance sheet stagnating for several months along with the market.
At the end of 2012, the markets and the economy were faced the onset of the “dreaded fiscal cliff.” Part of the debt ceiling negotiation in the summer of 2011 was the creation of the “Budget Control Act” which contained a trigger for automatic budget cuts, and tax increases, that would be triggered in January of 2013. Again, with the economy still running well below par, Bernanke acted quickly to provide enough liquidity to ensure financial and economic stability as the cuts and tax increases were enacted. The negative consequences of the “sequester”were much less than anticipated, and the deluge of $85 billion a month in liquidity ignited the markets into lift off establishing an accelerated trend higher (red dashed line.) Despite the successive push of liquidity into the markets, the S&P 500 has been unable to break above the overhead resistance of the longer term trend lines.
Based on this analysis, it is highly likely the markets will indeed drift higher within the current channel due solely to existing momentum. If this analysis is correct, it is likely that the markets could work their way towards 2100 by April of next year which would equate to an additional 5% gain from current levels.
Forecast Not Without Risks
1) There is no guarantee that the economy is strong enough to survive without the ongoing support of the Federal Reserve. After an extremely dismal Q1, the economy experienced a snap-back in Q2. The question of sustainability of that growth has yet to be answered.
2) Farmer’s Almanac, the 198-year-old publication that correctly predicted the past nasty winter while federal forecasters blew it, are predicting more of the same for the coming season. “Polar Vortex’s” are already likely farming and will be impacting roughly three-fourths of the U.S. this winter. Considering Q1 took more than a 2% plunge, WITH the Federal Reserve pumping in billions of dollars, it begs the question of how bad it could get without support this winter?
3) As I pointed out recently, the Mid-Term elections could pose a threat.
“The markets like ‘gridlock’ in government as it eliminates the risk of adverse fiscal policies. However, there is a rising probability that conservative Republicans could gain control of the Senate while maintaining majority control of Congress. The impact of such an outcome could be negative for the markets as it increases the probabilities of drastic cuts in government spending, reductions/reform of entitlement programs, and potential repeal, or ‘fix,’ of the Affordable Care Act (ACA). While moves to a more fiscally responsible government would provide longer term benefits, such actions would likely trigger an economic recession and stock market correction.”
4) Geo-political risks are still very prevalent and potentially getting worse.
5) The contraction of both the Eurozone and Japanese economies, along with the slow-down in China, is likely to weigh on the domestic economy and corporate profitability.
However, beyond those risks is the realization that the markets are very extended as the current bull run has leapt ahead unabated by a correction. The first chart below shows the S&P 500 on a weekly basis versus its 50-week moving average and bands representing 2-standard deviations from its mean.

The index is pushing the upper-limits of previous resistance levels which has typically led to at least a short-term correction. However, as seen in early 2012, as the Federal Reserve was winding down QE2, the correction was quite a bit larger than we have witnessed as of late. If we assume a similar pull-back following the end of QE3, a test of support at the 50-week moving average would be most likely at 1900 or a 5% decline.
Furthermore, as I have discussed in the past, moving averages act much like gravity for stocks prices. The longer the duration of the moving average, the greater the “gravitationalpull” on prices. The chart below shows the percentage deviation of the S&P 500 from its underlying 50-week moving average.

At over 8%, the recent correction at the end of July did little to correct the extension of the markets currently. Also, we are in one of the longer periods in recent history where the markets have consistently remained at more than 5% above its 50-week moving average. As you can see, deviations that are more than 5% above the longer-term moving average are not infinitely sustainable, 10% extensions are even more dangerous.
Following the very mild correction in July, it would not be surprising to see the markets push higher into the fall. However, the risk of a more significant correction has not been alleviated by any means and investors should be cognizant of the inherent risks.
Importantly, the current “bullish trend” remains intact, and therefore portfolios should remain invested currently. The rising levels of bullishness and complacency in the markets are sure warning signs that something “wicked this way comes,” however, as I stated earlier this week, “timing is everything.” Despite the ongoing litany of articles that suggest that “buy and hold” is the only way to win the long term game, the reality is that participating in rising markets is only half the battle. What wins the long-term investing game is avoiding a bulk of the declines.
Proving A Point
“I’ve had all I can stands, and I can’t stands no more.” – Popeye The Sailor
As I addressed above I have read an ongoing litany of articles about how active fund managers consistently underperform “buy and hold” index investing. However, the problem with all of these articles is that they are comparing mutual funds that have internal operating expenses with indexes. Furthermore, the vast majority of these “actively managed” mutual funds are simply closet index funds with no real sell discipline or strategy.
My premise has always been that it is entirely fine to underperform the index when prices are rising. However, it is critical not to capture the drawdowns during a market decline.
However, which theory is actually correct? I am going to put it to a live test. Now, mind you, the results of this test will not be known until after the next major correction. However, if I don’t start the test now, there will be no actual evidence to validate which theory is actually correct.
This coming week I am going to build a model portfolio that can be tracked real time with a very simple buy/sell strategy overlay. I am also going to test the theory that equal weighting a portfolio will outperform a market weighted portfolio over time as well.
In order to keep things fairly simple, reduce portfolio turnover and associated costs – I am going to use a basket of ETF’s to build a diversified portfolio. The portfolio will then be benched to the S&P 500 index, and relative performance will be tracked from there on a capital appreciation basis only.
I will post the model next week along with a discussion on the current arguments surrounding the passive/active investing debate. Going forward, I will track the results and report changes and performance along the way, along with continued discussions about the strategy, to validate which theory is actually correct.
Model Changes
Last week I stated:
“For this week, I suggest remaining “pat” and awaiting for market action to confirm the recent breakout. With the markets still on “sell signals” currently, there is a possibility that the current corrective action in the market is not over as of yet.
Investor “bullishness” and excessive complacency have quickly returned to the market which is now once again very overbought on a short term basis. Any dip in the market that does not violate short term supports, and reduces some of the short term overbought conditions, can be used to add selective exposure back to equities.”
The markets did indeed hold their ground this week and both initial “sell signals” are on the verge of turning positive. Therefore, the portfolio allocation model will revert back to full target allocations.

IMPORTANT: As I stated when the initial sell signal was given, by the time that occurs the markets are usually oversold on a short-term basis, and bounces should be used to sell into. This also holds true to “buy” signals. By the time “buy” signals are issued the markets are generally overbought on a short term basis. Therefore, add exposure to equity risk selectively and on short term corrections.
Do not misunderstand me, there is a fairly high degree of risk in the markets currently and just as the recent “sell signal” was quickly reversed, it can go in the opposite direction just as quickly. As Mr. Kotok recently stated: “For today, we are back in, but we are fully prepared to change rapidly if risk premia warrant such action.”
With this, I completely agree. Pay attention, things are likely to get interesting from here.
Have a great Labor Day Weekend **note: for very professional and informative section with 8 charts & 4 Tables go to Lance’s current Sector Analysis – Editor Money Talks
Road To Retirement – Chasing ROI (Part 2)
 There must be a better way
While you were out chasing rates of return a group of us were better positioning our lives to take control of our money. There is arising a greater desire to put our lives into a financial position where we can use our own money and pay ourselves back. Capital is critical but most of us lack the ability to use it wisely.
It really is three-sided
Far too much focus has been on increasing our wealth in a one-sided manner – chasing rates of return. There truly are three parts to your financial self. Accumulation surely is one but transfers are another and lastly but most importantly there is our lifestyle. All three are intricately woven into our longer lasting reality. Chasing a rate of return on the accumulation side will not win the race you run if your lifestyle erodes everything else. The rate of return on accumulation can’t significantly improve your financial picture if you are transferring dollar after dollar in the manner you make purchases whether you use someone else’s money or whether you pay cash.
Perhaps there are areas in your own life that would benefit by recapturing lost opportunities or lost wealth transfers or lost costs. Of course, to do that would require we admitted some weakness in the manner in which we handle our money. Wouldn’t recapturing bad spending increase your accumulation corner a bit? Remember the old adage, how to make 18% on your money would be to pay off then cease using credit cards?
What Am I Missing?
What are your current savings dollars earning for you? Have you any missed opportunities?
If you lose a dollar you didn’t want to lose it is not just the dollar that you will miss. You will miss what that dollar could have earned for you along the way. This is an “opportunity cost” many of us do not consider and are therefore transferring away wealth during our income-producing lifetimes. Think of all those dollars sent in monthly to pay for that car you drive to and from work every day. What if you earned a penny on every payment you have ever made?
In your current planning have you considered what impact college funding will have on your retirement dollars or other children’s education or your lifestyle money? What impact will the opportunity costs on those dollars have ultimately on your retirement years? Or have you been hypnotized into “free money match” to provide for your retirement plan while ignoring funding your children’s education? College will still occur first and you will find a source to pay for it. A better method would be to plan for it and let retirement planning adjoin it.
What money have you spent over the years on financing automobiles? Most families experience anywhere from $300k to $500k in lost opportunity costs on the dollars they finance to drive to and from work every day in those shiny new toys.
 How about credit cards? If you do not pay them off every 25-30 days how will they offset that rate of return you were bragging about at last week’s dinner party?
Did you buy term and invest the difference? How much in premium will you pay when the term is over and insurance is gone? We refer to that as an unnecessary wealth transfer with no result. Hope your debts are completely paid when the term ends and your family has no need to replace your income.
What value is there to you if you increased the deductible on your auto insurance? Could it put more money in your pocket? What would you do with the money?
What gain could be had if you increased the deductible on your homeowner’s coverage? Are there more dollars you have not explored that could increase your wealth? Unknowingly transferring your wealth and the lost opportunity costs associated with it erode all of those returns you’ve been chasing.
Did you believe the banker when they gave you a great deal on a 15 year mortgage instead of a 30 year mortgage? There is over $9 trillion in equity in today’s homes. That is money the bank is earning on instead of you. Ever ask yourself why you want that house paid off in 15 years? What if you had the money available in 15 years but you were in control of it and it was growing without taxation? Which scenario would you choose then? Pay off or have the money to pay off?
 is critical. Over the course of your lifetime in chasing rates of return your exhaustion even if quite successful will not offset the losses experienced through opportunity and interest payments.
Having money in the bank is not the answer because the banker is earning money on your money.
Having money in equity in your home is not the answer because it is the mortgage company earning money on your money.
Sending money into government sponsored savings plans is not the answer because they can sweep in with an excise tax at any time to capture what you thought were your earnings.
Increasing your wealth is an optimum motivator but focusing only on the accumulation aspect while ignoring significant transfers of wealth will greatly affect your resulting lifestyle money whether in the near future or the distant future.
For those of you saving 10-20% of your annual earnings send me an email to tell me what portion of those funds you control. Let’s somewhat define control for this conversation.
- Control means: if the banks close their doors; you are not concerned.
- Control means: If stock falls, your earnings do not.
- Control means: If the market crashed you still have access – it’s your money.
- Control means: If taxes rise you are not impacted – not now or in the future.
- Control means: You pay no fees on the increase – no monthly fees for advice.
- Control means: The money is not at risk.
Do yourself a favor, sit down with all of your feel-good statements and assess your total cash position. If you are a consistent saver we know you do this often. One more time will not hurt, or will it? Ask yourself these questions this time:
- How much of it is protected?
- How much of it can’t be touched by lawsuit?
- How much of it is insured against your death?
- How much of it is safe if you become disabled?
- How much of it is insulated from higher taxation?
- How much of it can you put your hands on in a pinch?
- How much of it can be used tax-free?
- How much of it will be needed to fund your life after “retirement” into old age if you live that long?
Truly, if it’s less than thirty percent you are in for a rude awakening some day. If all of your money is piled up in your taxable distributions, get ready for a wave because it’s coming. It’s a wipeout with your name on it.
Any program sponsored by the government up front, and has the IRS tagged as “it” on the backside was not designed for your benefit at all. The government has a plan and it will implement it.
Do you?
You see, most of what even one generation ago could rely upon is no longer true. What you think to be true likely has changed while you slept. How long will you pretend to be asleep continuing the status quo? It’s your life. It’s your savings. The sad news is that most of us have the lion’s share of it stacked inside a program the government owns. And they will rejoice and be glad when you retire!
Conservative * Disciplined * Different– sometimes means the message is stranger than you are accustomed to, but the history of those implementing a different system speaks for itself…successfully.
Have A Happy And Safe Labor Day Weekend.

Lance Roberts
Lance Roberts is the General Partner and Chief Portfolio Strategist for STA Wealth Management. He is also the host of “The Lance Roberts Show,” Chief editor of the X-Factor Investment Newsletter and the Streettalklive daily blog. Follow Lance on Facebook, Twitter and Linked-In

For these swing trade ideas at Jason Bond Picks I’m looking at 1-4 day hold times with +5-10% profit goals. I almost always take half my position off the table once I get up +5% to make sure I get a win – then I try to lock the other half at +10%.
SCOK – Support developing at $2.70 this is a strong uptrend with a lot of short interest that could squeeze above the recent $3.17 high. News out this morning should drive shares higher, look for a test of $3.50′s. The top trendline is in the low $3′s so watch how it handles that chop.

CTIC – Working nicely off the 20 Moving Average now I’m looking for entry close to $2.50 with a goal of the 200 Moving Average around $2.85. Short interest at 15 days to cover provides a nice backstop in this pattern. I wouldn’t be shocked to see this run to $3 soon given this pattern.

EVRY – The company sold its U.K. business which drove shares higher in the middle of August. A symmetrical triangle has formed here and it’s coiled tight so watch for an explosive move to the upside with decent range to $3 and potential for more if it can hold the trend.

DRWI – Extremely hot back in June DragonWave killed momentum with an offering. time has passed and short interest has grown. Now that shares are back down to excellent support at $1.40 I like the risk / reward here. Major Moving Average support and trendline support makes this rise in volume Wednesday top my list.

FCEL – Good news drove shares to overbought at $2.84 back in the middle of August. Now shares have settled just above the 20 Moving Average in a hot sector that also works nicely as a sympathy play on PLUG news. Entry here above $2.50 with a goal of the upper $2′s is what I’d look for on this swing.

MEET – Not my favorite pick on this list but I do believe it’s going to turn back up soon. The issue is the range to $2.65 resistance doesn’t leave much room for error on the entry and exit. So the game plan here is to get entry closer to $2.10 if shares continue to come in, then swing for the $2.50′s which would make a great trade. The company is good at putting out hot news on mobile growth which is why it’s in play on pullbacks.

STEM – Huge mover back in June that’s cooled off considerably. Short interest no doubt has grown as big hitters faded the $2.43 high and now it’s back down to good support above the 200 Moving Average. There’s also solid support around $1.50 from price action back in the spring. Working the 200 Moving Average as a stop, look for this to trade back into the upper $1′s provided $1.80 resistance consolidates and comes out on top.

Up +$100,000 this year swing trading I’m looking to add to those gains with these picks. For real time alerts by email and text plus access to Wall Street’s hottest stock chat with over 400 traders daily – join Jason Bond Picks premium newsletter here.
Last week I said, “It looks like the S&P 500 can clear 2,000 before our next pullback.”
The S&P 500 climbed above 2,000 each day this week in intraday trading, and closed above this key level Tuesday (2,000.02) and Wednesday (2,000.12).
Just prior to these new all-time closing highs, I suggested it was time to invest in stocks again. And at an individual stock-picking level, we’ve been closely following one S&P 500 component, United Parcel Service (UPS).
Let’s see how “Brown” is delivering this week. I’ll also reveal another name that’s looking ripe for a breakout …
UPS had dropped from a high of $105.09 to its price last week of $99.35. The approach discussed was to buy the stock and to buy a put to protection from any more downside action.
A couple weeks ago we exited the UPS put, and now the recommendation is to be long the stock. The put was closed out at $4.05. So the new cost basis is $97.25, which adds in the gain on the put.
The stock is at $97.38, as of Wednesday night’s close, so what was a loss is now a gain and we remain confident the low is in. Stay long the stock.
Stocks are generally on the rise, and our Market Crash Indicators remain at 75% invested for a second week after ending the third five-week period of 50% invested since we began that model.
At 75% invested, we suggest owning the SPDR S&P 500 (SPY). But another stock index, the small cap Russell 2000, is also on the rise.
Last week I said setups abound for the Russell 2000 but we needed “final” confirmation of the move (as opposed to trading on just the “potential”). We now have that confirmation.
The Russell 2000, via the iShares Russell 2000 ETF (IWM), is back above its last retracement from the May low to July high at $115.80.
This is looking like a breakout to buy.
Gold is also poised for a breakout. Gold via the SPDR Gold Trust (GLD) is stuck in a range here of $124 to $128, but keep in mind that September is usually a strong month for gold.
But Will September Continue
To Be Strong for Stocks, Too?
Next week the big dogs return to their desks and volume should improve as we enter the fall trading session.
Key to successful trading in the fall will be tracking volume.
Remember, for every buyer there is a seller … BUT the price at which shares are sold determines whether the buyers or sellers are in control.
A tool I use called the Erlanger Volume Swing (EVS) tracks up-to-down volume. It’s excellent for determiningwhen trading volume is really positive or negative, as opposed to “kind of” positive or negative.
Total volume for the period being reviewed is divided into two portions according to the position of the close between the period’s true high and true low.
- True high is the higher of the period’s high and the prior period’s low.
- True low is the lower of period’s low and the prior period’s high.
In other words, this volume indicator looks at the previous low and compares it to the current high.
If there is little difference, then the move is artificial and likely to fail. However, if day after day we observe a nice spread, then we know some large player is accumulating shares.
The importance of the EVS is to know when it is above or below 0. When it moves above 0, it is time to buy. It’s time to sell when it breaks below 0.
‘Volumes’ of Reasons to Buy IWM
As noted above, the Russell 2000 is starting to gain traction. So, let’s look at the EVS on the iShares Russell 2000 ETF (IWM).
I prefer to look at EVS on both a daily and weekly basis. The daily EVS turned positive on the Aug. 19 close.
A nice way to track improvement on EVS is to create a Moving Average Convergence/Divergence (MACD) line on the EVS. Doing this produced an aggressive buy signal on Aug. 7.
The MACD confirmed when the signal and diffusion lines moved above 0 on Monday.
The weekly EVS is currently positive. It turned down the week of July 14 and positive again last week.
The weekly MACD on EVS is still below 0, but the diffusion line is above the signal line.
Even Light Trading Volume
Can Produce Strong Signals
Although moves in the market can be exaggerated by low volume, the EVS still works well in summer-light trading conditions. This model has done a great job of revealing legitimate buying activity.
Personally, I create my own scoring system using the daily and weekly EVS with the MACD on EVS. Currently, the daily gets 2 out of 2 points. One point is given for a positive EVS and a positive MACD on EVS.
The weekly get 1.5 out of 2 points. A point is given for a positive EVS and the MACD has yet to get a point. However, the cross nets 0.5, and the overall score is a 3.5.
This ranking system is my way of quantifying EVS across multiple time frames in such a way that I am right 75% of the time.
Bottom line, I will not buy a stock with a score below 2.5 and even then it would be started as a partial position.
Key to this fall will be the ability to buy weak stocks that have begun to rebound on the EVS from both a daily and weekly basis.
The IWM looks like a buy here because it’s breaking out, and I will be keeping a close eye on this indicator for more stock and ETF names to send your way in the coming months.
Cheers and Hit ‘Em Straight,
Geoff Garbacz

Upcoming US Events for Today:
- Weekly Crude Inventories will be released at 10:30am.
Upcoming International Events for Today:
- German Consumer Confidence Survey for September will be released at 2:00am EST. The market expects 8.9 versus 9.0 previous.
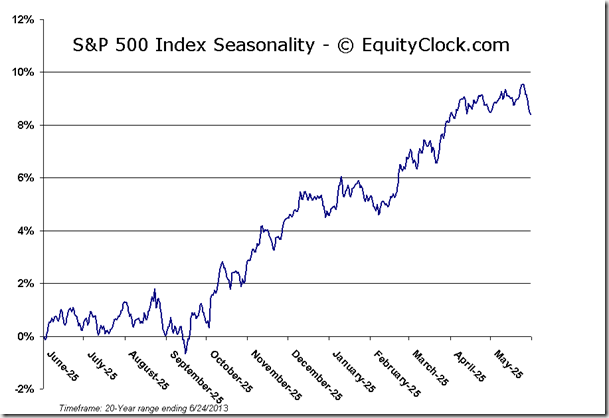
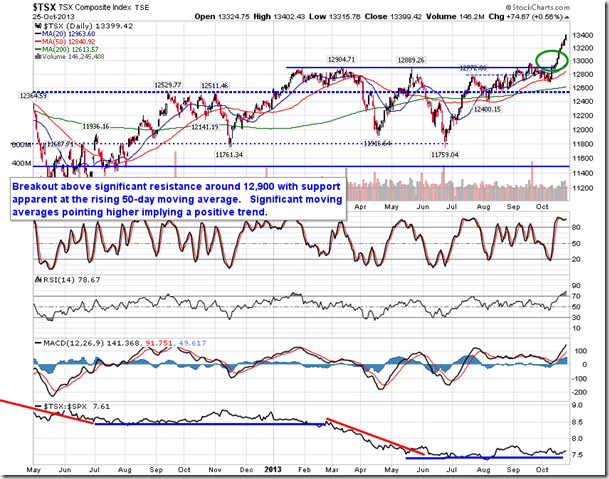
The Markets (read entire analysis including 10 individual companies HERE)
Stocks continued to gain on Tuesday, led by shares of Energy companies as investors start to nibble at the beaten-down sector. The large cap index closed above a key psychological level at 2000, albeit on continued low volume. Volume on Monday, according to the S&P 500, was one of the lowest in years, surpassed only by the shortened sessions ahead of the Independence Day, Christmas Day, and Thanksgiving Day holidays over the past three years. The last regular trading day that didn’t precede or follow a holiday that had lower volumes than what was recorded on Monday was on March 2nd of 2011, just prior to the correction attributed to the Tsunami in Japan. A few months later it became apparent that the low volume trading environment during the first half of 2011 was part of a topping process that led to the last major correction that equity markets have realized. Despite the typical drop-off in volumes at the end of summer, often leading to equity market volatility, the level of conviction that investors have to the all-time highs appears to be low as investors show caution in putting new money to work. The only other time that the volume on the S&P 500 Index has been lower during an August trading day was on August 5th of 2008, just ahead of the plunge declines that followed though to the 2009 lows. Recent precedent of significantly low volume sessions has not been kind to the equity market over the months that followed.
…continue reading about the seasonality of 10 individual stocks, further market commentary, seniment & volume analysis HERE
All major U.S. indices closed higher for the third consecutive week, led by the Dow Jones Industrial Average, which was up 2%. Year to date, by far the strongest major index has been the tech-heavy Nasdaq 100 (NDX), which is up 12.8%. This leadership by technology has been a key catalyst in the 2014 broad market advance, helping the SP 500 post a 7.6% gain despite a weak small cap sector. This strength in tech must continue to keep the broader market headed higher.
From a sector standpoint, last week’s advance was led by financials, industrials and consumer discretionary, but all sectors of the SP 500 ended in positive territory.
Key Indices Held Major Support Levels in August
Many key indices, including the SP 500, Dow Jones Industrial Average and PHLX Semiconductor Index, have rebounded nicely from major support levels that were tested during the first week of August, and finished last week at or near their 2014 highs.
The SPDR Dow Jones Industrial Average (NYSE: DIA), which I first mentioned as a potential buying opportunity in the May 12 Market Outlook, closed out last week 3.7% above its Aug. 7 test of its 200-day moving average, a widely watched major trend proxy, and less than 1% below its July 17 all-time high of $171.32.

Although I remain cautiously positive on DIA heading into this week, I am still apprehensive about its more intermediate-term sustainability due to frothy investor sentiment, weak August-to-September seasonality, and major overhead resistance in the market-leading Nasdaq 100.
Technology Faces a Formidable Challenge
The next chart plots the Nasdaq 100 monthly since 1994, and shows that Friday’s 4,053 closing level positions the index just 2.3% below its 4,147 September 2000 high.

Major benchmark highs like this one are seldom meaningfully and sustainably broken without at least a multi-week corrective decline first. So, especially considering that technology issues have led and fueled the 2014 broader market advance, I am watching the Nasdaq 100’s reaction to 4,147 as a potential coincident or leading indication of an upcoming market correction.
Bearishness in Europe Could Spread to Our Shores
Another potential pothole to be aware of this quarter is European stocks, which are positively correlated to the SP 500 and whose economies have much more to lose than the United States on any further geopolitical tensions in Ukraine.
The next chart shows that, unlike the major U.S. indices, the iShares MSCI Germany (NYSE: EWG) recently declined below its 200-day moving average and its Feb. 3 low, indicating an emerging major bearish trend change. Moreover, the 50-day moving average (minor trend proxy) crossed below the 200-day, which I view as more evidence that a tangible bearish shift in intermediate-term price momentum has occurred.

Considering EWG closely tracks Germany’s DAX index, and that the DAX has maintained a positive correlation to the SP 500 for the past 25 years, this suggests that either the 25-year correlation has suddenly become irrelevant, or one of these two indices is temporarily mispriced. I’m inclined to go with the latter, and more specifically, I think Germany is better handicapping upcoming economic and/or geopolitical risk in Europe that will eventually have an adverse effect on the U.S. market.
U.S. Bond Market Isn’t Enthusiastic Either
Recent apprehension in the U.S. bond market appears to be increasing. In the July 28 Market Outlook, I pointed out that the 2-year/10-year yield curve had flattened below its March 2012 steep (meaning wide) extreme at 200 basis points (bps), saying, “This clears the way for an additional 15 bps of flattening to the next key level at 180 bps.” I also pointed out this was likely to coincide with a decline in the yield of the 10-Year Treasury note.
The next chart shows that the curve has since flattened to 187 bps. Meanwhile, the yield on the 10-year note has coincidentally declined to as low as 2.3%.

A flattening yield curve amid declining long-term interest rates suggest that the typically prescient bond market sees some economic trouble/weakness ahead, which I view as another good reason to watch the Nasdaq 100’s reaction to 4,147 overhead resistance during the next several weeks. Last week’s flattening in the curve clears the way for at least an additional 7 bps move to the next key level at 180 bps.
Putting It All Together
Many key U.S. stock indices tested, held and aggressively rebounded from major support levels earlier this month, which, at best, means that investors still collectively believe the market is headed even higher this year and, at the least, indicates that the “buy the dip” mentality is alive and well as managers remain terrified of missing the next quantitative easing-fueled leg higher.
I am still cautiously positive on this market on a near-term basis, but I also believe investors need to be acutely aware of potential problems ahead due to a number of things including extreme bullish investor sentiment, an historically weak August-to-September period, an emerging bearish trend change in the German stock market, and falling long-term U.S. interest rates.
Considering these factors, I would view the Nasdaq 100’s inability to rise and hold above overhead resistance at 4,147 as a good reason to more aggressively protect profits on long positions.
Editor’s note: One way to add some protection now while still participating in any potential upside is to “rent” your stocks for extra monthly income. If you’re not familiar with Amber Hestla’s Maximum Income service and want to learn how you could earn an extra 9%-plus monthly income from the stocks you already own, click here.
This Week’s News

In the past year, Street Authority recommendations on individual stocks have gained +72%, +26% and +60% all in less than six months… and recently, their trades could have made you +26% in 42 days and +42% in less than one month. Click here to get the free trading advisory — Trade of the Week.

-
I know Mike is a very solid investor and respect his opinions very much. So if he says pay attention to this or that - I will.
~ Dale G.
-
I've started managing my own investments so view Michael's site as a one-stop shop from which to get information and perspectives.
~ Dave E.
-
Michael offers easy reading, honest, common sense information that anyone can use in a practical manner.
~ der_al.
-
A sane voice in a scrambled investment world.
~ Ed R.
Inside Edge Pro Contributors

Greg Weldon

Josef Schachter

Tyler Bollhorn

Ryan Irvine

Paul Beattie

Martin Straith

Patrick Ceresna

Mark Leibovit

James Thorne

Victor Adair