
Stocks & Equities

December 11, 2014
The two big financial news items in December have been the multiple Hindenburg Omen signals and the crash in crude oil prices. I recently went on CNBC to talk about the former. Its relationship to the latter is inescapable.
A Hindenburg Omen occurs when the number New Highs and New Lows on the NYSE both exceed a specified percentage of total issues. See this article for more details. There are other requirements, such as that the NYSE Comp be in an uptrend, and the McClellan Oscillator needs to be negative. Those other criteria are important, because there is no sense getting an omen when you are already in a downtrend, or when the market is too strong to be able to go down. This month we have seen the New Lows list expanding, thanks to the poor performance of multiple issues with the words “resources”, “energy”, or “drilling” in the companies’ names.
So does it really count if the New Lows list is populated mostly by members of a single sector?
That is a really great question, and we are going to see the answer provided over the next several weeks. My assumption is that things would be a lot worse if it were financial stocks instead of energy stocks that were populating the new lows list, since financial stocks are farther up the food chain and thus a more problematic indicator if they start to turn unhealthy.
Still, the Hindenburg Omen has a well-earned reputation for signaling trouble ahead of every major decline. Its problem is that it has also signaled trouble at times that did not lead to calamity, leading to a separate reputation as a wolf-caller indicator. But as the late Jim Miekka liked to point out, an omen is not the same thing as a guarantee of trouble. It is a sign that something is hinky, but not necessarily a sure harbinger of additional trouble. And the more signals that one sees in a short time frame, the more certainty it can offer about trouble to come.
For these latest Hindenburg Omen signals to really bring trouble, they are going to have to fight against positive seasonality, strong breadth numbers, and the positive implications of the 3rd year of a presidential term. Those are a formidable set of forces to have to oppose.
So what does it really mean for the market when oil prices have a big decline? Let’s take a look at history to see what it can tell us. Over the past 4 decades, there have been 4 really big price declines before this latest one:

I would set aside the first Iraq War in 1990-91 and the 2008 Commodities Bubble as separate types of events. The declines in each of those cases originated from unnatural spike highs.
But the declines in 1985-86 and in 1998-99 originated from a flat price structure for oil prices, which was more like the decline we are seeing right now. In each of those prior two cases, the result was fairly bullish for the stock market, notwithstanding a 2-month dip in 1998 that was attributed to Ralph Acampora turning bearish on CNBC in August 1998. So the current oil price decline is more like those two instances.
Many analysts are likening the oil price drop to a big tax cut, with an associated stimulative economic effect. But how much?
According to the Energy Information Agency the U.S. consumed 126 billion gallons of gasoline during the 12 months ending Sep. 2014. So given the drop in RBOB gasoline futures from the top at ~$3.10 in June to $1.64 today, that $1.46 difference would amount to $183 billion over 12 months. That’s just gasoline, and it assumes that today’s price sticks for the long run. It does not include other factors that affect actual prices which consumers pay at the pump.
But if we consider that gasoline is just one of the uses for crude oil, then the savings magnify. According to the EIA data on crude oil consumption, annual U.S. consumption of crude oil during the latest 12 months was 6.9 billion barrels. So the price drop from ~$107/barrel at the June 2014 high to ~$59 today represents a total presumptive savings of $332 billion per year, assuming prices stay exactly here, and that consumption does not change. That is well short of the $85 billion per month that the Fed was doing during the peak of the latest round of QE, but it is not nothing.
So while the FOMC has ended QE, the global crude oil market has presented us with its own form of stimulative easing. Ironically, history shows that the oil market can yank back its own QE faster than the Fed seems to be able to.
From another standpoint, the current oil price decline does indeed have terribly bearish implications for the stock market… for 10 years from now. There is a 10-year leading indication relationship between oil prices and the stock market, as shown in this chart:

The current oil price slide says that sometime around 2024, we can expect to observe some type of “echo” in stock prices from this year’s oil price drop. I am not sure why this relationship exists in this way, with stock prices echoing oil price movements with a 10-year lag. But after seeing that it has “worked” for over 100 years, at some point we can say that there is enough evidence to accept it, even if we cannot explain it.
For now, the message of this leading indication is that the oil price rally from 1998 to 2008 has yet to see the full extent of its echo during the 2009-2018 period. While the current dip in oil prices is going to be bad for stock prices about 10 years from now, it is not really a problem for stock prices in real time. So any worries that investors express over this oil price decline represent an opportunity for us to take advantage of irrational fears over the oil price collapse.
Tom McClellan
Editor, The McClellan Market Report
Related Charts


Last week we became bearish the US stock market when the indexes lost the support parameters originally laid out in an update on Tuesday. Then, on the sharp rebound NFTRH+ noted a short trade on SPY. That is still in progress. So what is next for a market that is taking a much deserved correction of its excesses?
We should not feel the need to predict because NFTRH’s approach is intuitive in reading charts by daily, weekly and monthly views, checking macro data that matter (i.e. look forward) like the upcoming Semiconductor Book-to-Bill ratio for November, and to lay out possibilities and refine probabilities.
Despite global news items, last week’s drop in the US stock market was a probability owing to the deplorably over bullish sentiment we noted in #320 and its over bought proximity above important moving averages that we also talked about recently.
The Dow, S&P 500 and Nasdaq 100 (i.e. US market headliners) are on plan for a corrective hit in the first half of December (recall also the typical December seasonal we reviewed on page 33 of NFTRH 319) and we need to finish managing that before any thoughts of bounces, rebounds or bull continuation via a Santa rally.
If Santa does come on schedule, we will only call it a bounce until it proves otherwise.
On Friday, in the midst of bearish markets far and wide, I wrote an article speculating about a potential counter-trend bounce in the beaten down ‘inflation trade’ http://nftrh.com/2014/12/12/is-inflation-oversold/ and this theme could mesh with a ‘Santa Rally’ and/or ‘January Effect’ rally that could begin to get itself together over the next several weeks.
Things are actually getting interesting because we have downside movement in the major US markets, ‘tax loss’ season in full swing, commodities and the global ‘inflation trade’ (incl. certain global markets like Canada, Australia and Emerging) approaching support levels (ref. the Canada and Aussie dollar targets/support in the article linked above) and silver and gold, however uninspiring they seem at the moment, providing a hint as silver leads the recent relative strength in the precious metals vs. commodities and stocks.
As is always the case, any year-end speculations are taken against the unchanged big picture view of a global economic contraction and the slow erosion (some would say deflation*) of previously inflated asset bubbles.
I don’t care what kind of upside Dow targets come out of Martin Armstrong’s computer. Our simple charts have shown again and again the precarious nature of the US stock market as an inflated thing with no backing fundamentals outside of policy making. So that is the caveat as always. The chart shows Monetary Base and Debt-to-GDP fading and flat lining, respectively.

Please take a moment to really look at that chart. Let it tell its story. Frankly, seeing something like that makes me feel a little uncomfortable even writing a segment about a would-be Santa Rally because nothing has changed for people who want to look beneath the surface (admittedly a distinct minority in the gambling casino filled with wild eyed players) and consider what is really in play.
Total Public Debt to GDP has leveled off and the post-QE3 money supply is dropping. In response, the S&P 500 has only just begun to respond. You and I are not the only ones who see this. The average stock bull does not see nor care to see it, but our big brained friends at the Federal Reserve certainly do. Depending upon what transpires the first couple of days next week, this paints the upcoming FOMC meeting as a notable one.
The market’s interest rate price fixers issue their statement at 2:00 (ET), followed by a Yellen PC at 2:00 on Wednesday, December 17.
If Santa is coming, he may take his cue from whatever comes out of the orifice of this multi-headed group of autocrats. Again, they see clearly what we see in the chart above.
Bottom Line on Santa
So with a typically dour NFTRH caveat fest behind us, we can move on with the understanding that we are dealing in what is (a mocked up bull market, but a bull market nonetheless), not what I personally would like it to be (a more honest environment… ha ha ha, he sounds like a financial flower child, a hippie… an idealist!).
The market has lived by the policy and it will either continue to live by the policy or die by the policy unless our big picture macro view is wrong (always a possibility folks) and a sustainable bullish environment – sans QE – engages. Again, we will watch the likes of the Semiconductor b2b and also consider whether the plunge in energy and other important commodities is like a beneficial QE, to the US at least.
So with that, let’s play it straight and move on to the jolly rotund man in red.
*Note: the above is followed by 15 pages of different market sector analysis, charts and recommendations, all up to date, that can be read in full HERE – Money Talks Editor

 An investor’s first instinct is to prefer successful companies. The boss is revered, the stock is a rocket. General Electric was, in Jack Welch’s heyday, a prime example.
I have a contrary strategy: Buy shares of crappy companies. Look for a business whose stock has gone nowhere and whose corner office is covered with a thick layer of dust.
If you buy cheaply and patiently, you could get a nice windfall via a takeover. Even without such a rescue you could see a decent return. Perhaps the third-rate management gets replaced with second-rate management.
Canadian Pacific was a mediocre railroad when a fund run by William Ackman acquired a position. Ackman is a hands-on investor–perhaps we should say, hands-on-throat. He got the chief executive axed. In the three years since Ackman started making a stink, the stock has tripled.
I have a little list of companies that could benefit from some cage-rattling. Over the past decade their stocks have, according to Morningstar’s calculation of total return, lagged both the market and the average for industry peers. They have underexploited assets and complacent managers.
SCHOLASTIC (SCHL, 35) has a commanding presence in publishing for young readers, both in and out of schoolrooms. When you look at its bottom line, though, what you see is what could have been. As publisher of the Harry Potter and Hunger Games novels, it could have had a nice piece of the movies. Somehow those opportunities slipped between its fingers. Instead it sank money into a movie based on another children’s fantasy series. The Golden Compass came out in 2007, and we’re still waiting for the sequel.
Scholastic Chief Executive Richard Robinson has been with the company (which his father founded) since 1962. He has a good grip on his job, what with supervoting shares that give Robinson heirs control of the board. But maybe his relatives, or an outside investor, could persuade him that everyone would be enriched if he moved on.
TOOTSIE ROLL INDUSTRIES (TR, 29) is sitting on valuable candy brands, including Junior Mints and Charms. For the past half-century Melvin Gordon has been firmly in control. Someone might delicately suggest that it’s not too soon for him to retire (age in last proxy: 94).
….continue reading stocks 3-6 HERE
Briefly: In our opinion, speculative short positions are favored (with stop-loss at 2,085 and profit target at 1,950, S&P 500 index).
Our intraday outlook is bearish, and our short-term outlook is bearish:
Intraday (next 24 hours) outlook: bearish
Short-term (next 1-2 weeks) outlook: bearish
Medium-term (next 1-3 months) outlook: neutral
Long-term outlook (next year): bullish
The U.S. stock market indexes lost 1.5-1.6% on Wednesday, extending their short-term downtrend, as investors reacted to worsening global economic conditions. The S&P 500 index broke below its early November consolidation, as it got closer to the level of 2,000. The nearest important level of support is at around 2,000-2020. On the other hand, resistance level is at around 2,040-2,050, marked by previous local lows, among others. For now, it looks like a correction within an uptrend, however, a negative reversal scenario cannot be excluded here:

Expectations before the opening of today’s trading session are slightly positive, with index futures currently up 0.1-0.2%. The European stock market indexes have been mixed so far. Investors will now wait for some economic data announcements: Initial Claims, Retail Sales at 8:30 a.m., Business Inventories at 10:00 a.m. The S&P 500 futures contract (CFD) bounces off support level at around 2,020-2,025. The nearest important level of resistance remains at 2,030-2,035, marked by recent local low, and the next resistance level is at 2,050-2,060, as we can see on the 15-minute chart:

The technology Nasdaq 100 futures contract (CFD) follows a similar path, as it bounces off support level at around 4,200-4,220. The nearest important level of resistance is at around 4,250-4,260, marked by previous support level, among others, as the 15-minute chart shows:

Concluding, the broad stock market extended its short-term downtrend. We continue to maintain our already profitable speculative short position. Stop-loss is at 2,085 and potential profit target is at 1,950 (S&P 500 index). It is always important to set some exit price level in case some events cause the price to move in the unlikely direction. Having safety measures in place helps limit potential losses while letting the gains grow.
Thank you.
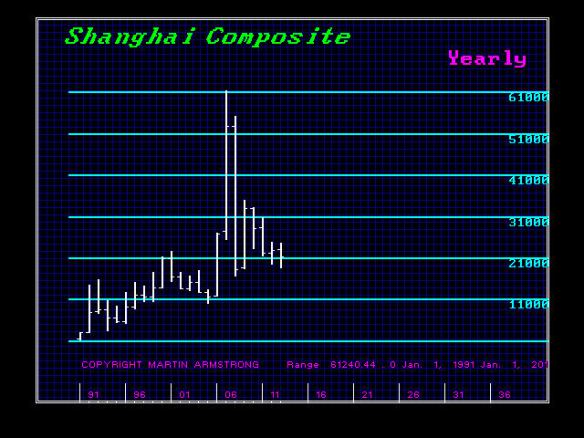
The US market has been hit in sympathy because of the chaos outside. This should be expected. We have warned that China peaked in 2007 and is headed lower. The US is the ONLY game in town and the US economy has been holding up the entire world. But the growth in the USA is anemic to put it best. Chinese stocks plunged Tuesday amid a broad decline in global markets. China’s main stock market index saw its largest fall since 2009. This development was triggered an announcement that the rules should be tightened in the lending business. This is what I mean about trend. In a bear market, every piece of news becomes bearish. People associate the decline with that news but the trend is bearish to start with. The global trend hit the US market in sympathy because generally still do not trust the uptrend. There is no froth yet because the retail are not yet in with both feet.
The Major Chinese oil and bank stocks fell, some by the daily limit of 10 percent allowed by regulators, as the market took a break from a buying frenzy that has pushed up the Shanghai benchmark by 41 percent since June. Investors had been driven by hopes for an economic rebound combined with outright cheerleading by the state press. But prices fell Tuesday after China’s clearing house for securities trades raised the minimum rating for corporate bonds it would accept in exchange for short-term credit, prompting concern about the availability of financing for trades.
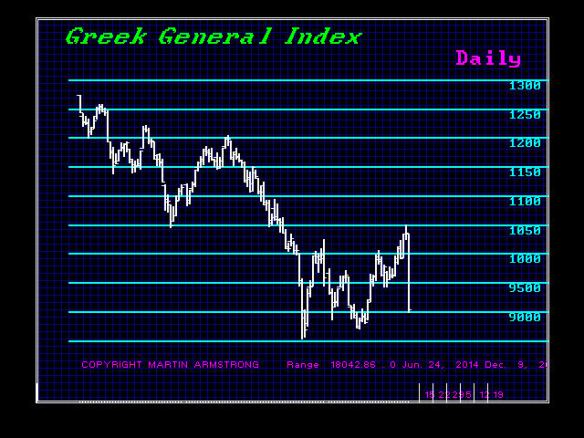
Greece was suffering its biggest one-day loss since 1987 on concerns that a political crisis might jeopardize its finances. The EU and Greece just agreed on billions more loans, and the campaign has broken out in Athens as the people are turning left thanks to the crazy austerity policies of the EU. The Greek stock market crashed because it is generally expected that the Left Party SYRIZA will dominate the agenda in the coming weeks. Meanwhile, Merkel is still trying to hold on to insanity as the Bundestag is again in a hurry to decide next week on an extension of the credit program for Greece, although the conditions are unclear. Politicians are still desperately trying to hold the Euro together yet
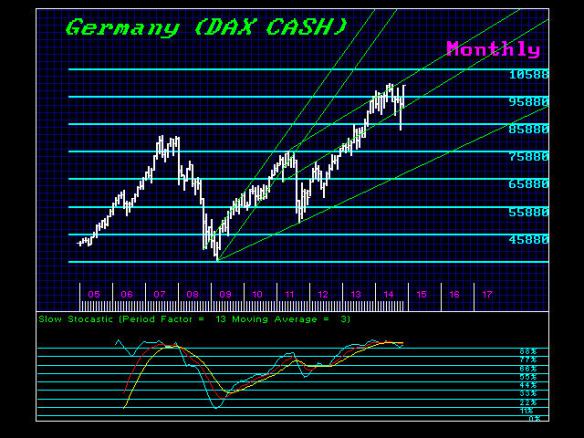
France’s CAC-40 fell 1.4 percent to 4,315.20 on Tuesday while Britain’s FTSE 100 shed 1.3 percent to 6,584.06, and the German DAX lost 1 percent to 9,915.88. Nevertheless, we can see where the German DAX has not peaked and its strength remains a direct result of the shift within capital flows inside Europe as this is a bet against the Euro.
Ed Note: Related Martin gives some targets for the Dow Industrials:
Dow Jones Update Dec 10, 2014
Also unrelated, but fascinating:
It is Now a Felony to Tape the Police Abuse in Illinois

-
I know Mike is a very solid investor and respect his opinions very much. So if he says pay attention to this or that - I will.
~ Dale G.
-
I've started managing my own investments so view Michael's site as a one-stop shop from which to get information and perspectives.
~ Dave E.
-
Michael offers easy reading, honest, common sense information that anyone can use in a practical manner.
~ der_al.
-
A sane voice in a scrambled investment world.
~ Ed R.
Inside Edge Pro Contributors

Greg Weldon

Josef Schachter

Tyler Bollhorn

Ryan Irvine

Paul Beattie

Martin Straith

Patrick Ceresna

Mark Leibovit

James Thorne

Victor Adair