
Stocks & Equities
Tuesday November 7, 2017 – Available Mon- Friday after 3:00pm PST.
DOW + 9 on 465 net declines
NASDAQ COMP – 19 on 1264 net declines
SHORT TERM TREND Bullish
INTERMEDIATE TERM Bullish
STOCKS: The market mostly slipped on Tuesday. Earnings were the main culprit and interestingly enough, dropping interest rates were cited. The latter because supposedly lower rates pressure banks. I think this is nonsense. Stocks rallied from ’09 through much of 2016 precisely because rates were near zero. But, we have to admit that the XLF or the financial ETF was down over 1% today.
Part of the problem was an overbought RSI on many indices. That can be ignored for a while, but at some point it tends to be a deterrent.
GOLD: Gold was fell back $5. The yellow metal is just waffling around right now.
CHART: The CBOE put call ratio closed above 1.0 today. When that happens, the S&P has a tendency to move higher over the next day or three.

BOTTOM LINE: (Trading)
Our intermediate term system is on a buy.
System 7 We bought the SSO at 102.50. Let’s stay with it through Wednesday.
System 8 We are in cash. Stay there for now.
System 9 We are in cash.
NEWS AND FUNDAMENTALS: Job openings (JOLTS) were 6.093 million, more than the expected 6.082 million. On Wednesday we get oil inventories.
INTERESTING STUFF: “Why don’t they pass a constitutional amendment prohibiting anybody from learning anything? If it works as well as prohibition did, in five years we will have the smartest people on earth.” —-Will Rogers
TORONTO EXCHANGE: Toronto added another 40.
BONDS: The bond market moved still higher.
THE REST: The dollar moved slightly higher. Crude oil hesitated today after a big run.
Bonds –Bullish as of October 27.
U.S. dollar – Bullish as of October 20.
Euro — Bullish as of October 10.
Gold —-Bullish as of November 1.
Silver—- Bullish as of November 1.
Crude oil —-Bullish as of October 10.
Toronto Stock Exchange—- Bullish as of September 20, 2017.
We are on a long term buy signal for the markets of the U.S., Canada, Britain, Germany and France.

Monetary conditions (+2 means the Fed is actively dropping rates; +1 means a bias toward easing. 0 means neutral, -1 means a bias toward tightening, -2 means actively raising rates). RSI (30 or below is oversold, 80 or above is overbought). McClellan Oscillator ( minus 100 is oversold. Plus 100 is overbought). Composite Gauge (5 or below is negative, 13 or above is positive). Composite Gauge five day m.a. (8.0 or below is overbought. 13.0 or above is oversold). CBOE Put Call Ratio ( .80 or below is a negative. 1.00 or above is a positive). Volatility Index, VIX (low teens bearish, high twenties bullish), VIX % single day change. + 5 or greater bullish. -5 or less, bearish. VIX % change 5 day m.a. +3.0 or above bullish, -3.0 or below, bearish. Advances minus declines three day m.a.( +500 is bearish. – 500 is bullish). Supply Demand 5 day m.a. (.45 or below is a positive. .80 or above is a negative). Trading Index (TRIN) 1.40 or above bullish. No level for bearish.
No guarantees are made. Traders can and do lose money. The publisher may take positions in recommended securities.

 This past week, we experienced yet another horrendous terrorist attack in New York City. And, amazingly, just like what occurred after several other terrorist attacks that have been experienced over the last year, the market rallied right after the attack.
It has almost gotten to the point that people now expect the stock market to rally after a terrorist attack. Have we really become this warped in our thinking? Must we hold fast to ridiculous notions that news is what drives the stock market to the point that we have to resign ourselves to believing that the market will rally “because” of a terrorist attack? Do you not see how ridiculous these perspectives really are?
Yet, if the market dropped after a terrorist attack, there is no question in my mind that every analyst and their mother would be absolutely certain that the market dropped specifically due to the terrorist attack. Every article the next day would have been pointing to the attack being the definitive “cause” of the market drop. And, if I then challenged this false exogenous causation theory, the response I would receive is “don’t you believe your eyes?” Yet, not a single analyst dares to suggest that the markets are rallying because of news of terrorist attacks despite seeing many instances of this occurring over the last two years. Do, they not believe their eyes?
Are you starting to see my point yet? Do you see through the intellectual dishonesty of maintaining these old perspectives of what moves the market?
I cite this study often, but I think the recent rally after the New York attack should drive this point home even further. In August 1998, the Atlanta Journal-Constitution published an article by Tom Walker, who conducted his own study of 42 years’ worth of “surprise” news events and the stock market’s corresponding reactions. His conclusion, which will be surprising to most, was that it was exceptionally difficult to identify a connection between market trading and dramatic surprise news. Based upon Walker’s study and conclusions, even if you had the news beforehand, you would still not be able to determine the direction of the market only based upon such news.
And, this past week’s stock market action further supports Mr. Walker’s conclusion. But, we have to begin to look at markets in a more intellectually honest manner in order to be able to see it. However, I am quite certain that the next time a news event coincides with a market move, all the usual suspects will be out front screaming how the news event was the certain cause of the market movement. And, therein lies the intellectual dishonesty inherent in most financial reporting and analysis today.
Price pattern sentiment indications and upcoming expectations
Before I begin this week’s expectation, I want to make a point about last week’s analysis. I noted that if the 2572SPX level broke early in the week, it opened the door to a drop down to lower support in the 2520-50SPX region. Many seemed to read that as suggesting that a break of 2572SPX would certainly drop us to the lower support region. But, that is not how Elliott Wave analysis works, nor is it how we use it to set up trades. Allow me to explain.
You see, a standard impulsive wave structure targeting the 2611 region directly had that 2572/74SPX region as support which would have taken us directly to the 2611SPX region this past week. However, the break down below 2572 added more complexity to the pattern.
In order for the break down below 2572SPX to point us down to the lower support, we would have had to see a 5-wave impulsive structure break below 2572SPX, which would then suggest we are heading down to our lower support region. However, the drop below 2572SPX only provided us with a 3-wave drop, which is most often viewed as a corrective drop. But, it also meant that we had to prepare for much more volatility and whipsaw because the upside structure then morphed into what we call an ending diagonal. That structure provides for the volatility and whipsaw for which we had to prepare, and which the market provided us for the rest of the week.
So, as I presented in a blog write up a few weeks ago, Elliott Wave analysis is to be used in logical progression, which is why we always provide our analysis within an if/then context. And, while we broke below 2572SPX, and it “opened the door” to drop down to the 2520-50SPX region below, the market never provided the requisite set up pointing down there after we broke 2572SPX, which caused us to continue to look higher within our primary structure.
But, based upon earlier break of 2572SPX, and the further overlapping nature of the market structure, there is much more complexity in this structure, which can provide us with further whipsaw before a top is struck. If the market should break 2570SPX in the coming week, it makes it much more likely that this break will have us target at least the 2555SPX region, with potential to drop as deeply as the 2520SPX region. But, that will still set us up for a rally back up towards the 2600+ region. However, as long as the market maintains over 2570SPX, I still see us heading to the 2600+ region before this wave (3) rally off the February 2016 lows can even be considered completed.
So, I would complete the title of this article by saying that nothing can bring down this market except when we finally complete this structure for wave (3).
By Avi Gilburt, ElliottWaveTrader.net

today’s videos and charts (double click to enlarge):
SF60 Key Charts & Video Update

SFS Key Charts & Video Update


SF Juniors Key Charts & Video Analysis


Morris
website: www.superforcesignals.com
Briefly:
Intraday trade: Our Tuesday’s intraday trading outlook was neutral. It proved quite accurate because the S&P 500 index gained just 0.1% following relatively narrow intraday trading range. We still can see some short-term overbought conditions. Yesterday’s reversal off new record high is a short-term negative signal. Therefore, intraday short position is favored. Stop-loss is at the level of 2,595 and potential profit target is at 2,545 (S&P 500 index).
Our intraday outlook is bearish today. Our short-term outlook is neutral, and our medium-term outlook is neutral:
Intraday outlook (next 24 hours): bearish
Short-term outlook (next 1-2 weeks): neutral
Medium-term outlook (next 1-3 months): neutral
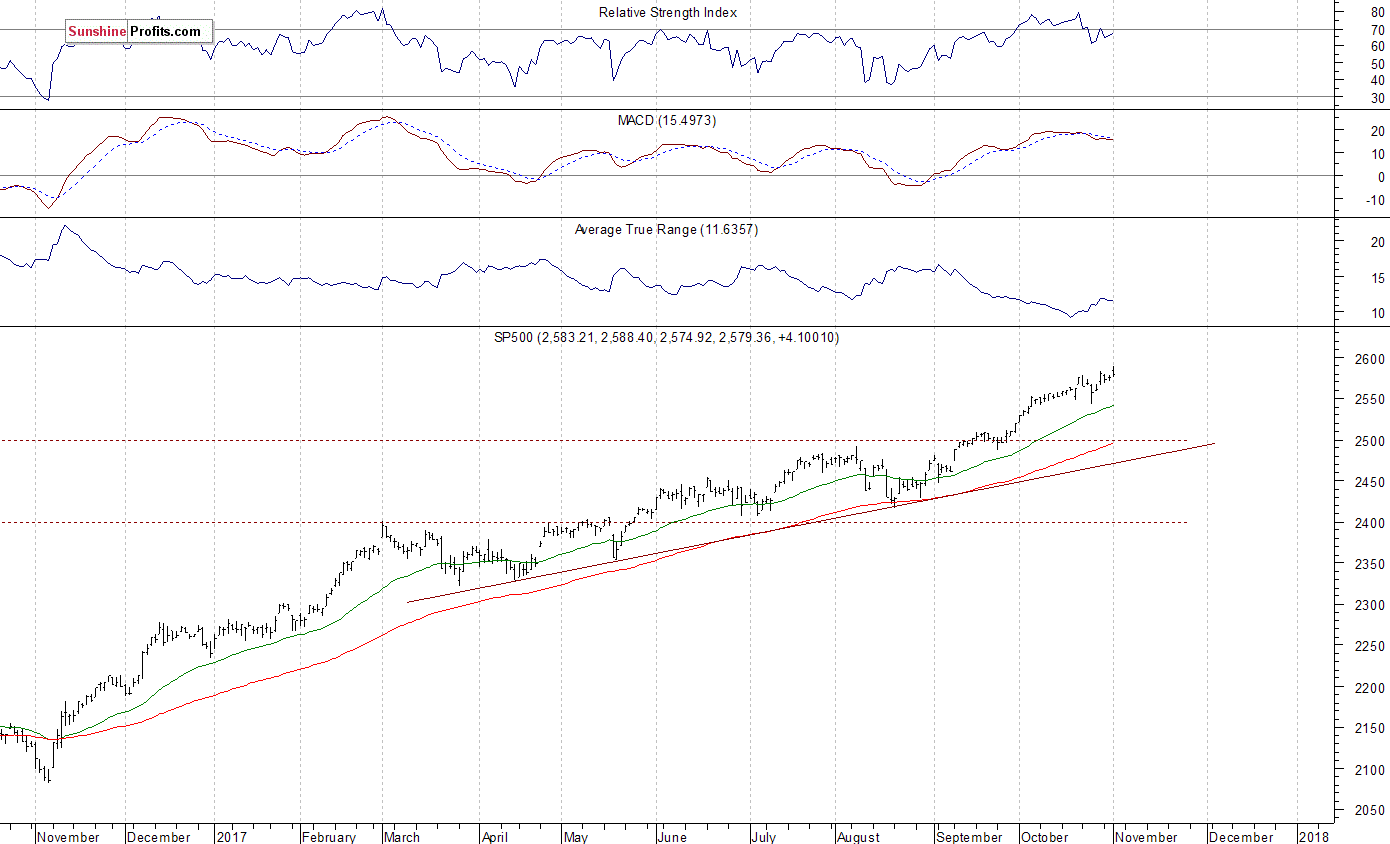
The main U.S. stock market indexes were mixed between -0.2% and +0.3% on Wednesday, as investors took short-term profits off the table following recent rally. The S&P 500 index reached new record high at the level of 2,588.40, before closing slightly below 2,580. The Dow Jones Industrial Average was relatively stronger than the broad stock market, as it gained 0.3%. The blue-chip index reached new all-time high at the level of 23,517.71. The technology Nasdaq Composite reached new record high at the level of 6,759.66, but it closed 0.3% lower. The nearest important level of support of the S&P 500 index is at 2,570-2,575, marked by some recent local lows. The next support level remains at 2,560-2,565, marked by previous local lows. The support level is also at 2,545-2,550, marked by last Wednesday’s daily low, among others. On the other hand, potential resistance level is at around 2,590-2,600, marked by record high. The S&P 500 index extended its over eight-year-long bull market yesterday, as it reached new record high closer to 2,600 mark. Will bull market continue? Or is this some topping pattern ahead of downward reversal? There have been no confirmed negative signals so far. However, we still can see medium-term technical overbought conditions:
Uncertainty Ahead Of Economic Data, Earnings
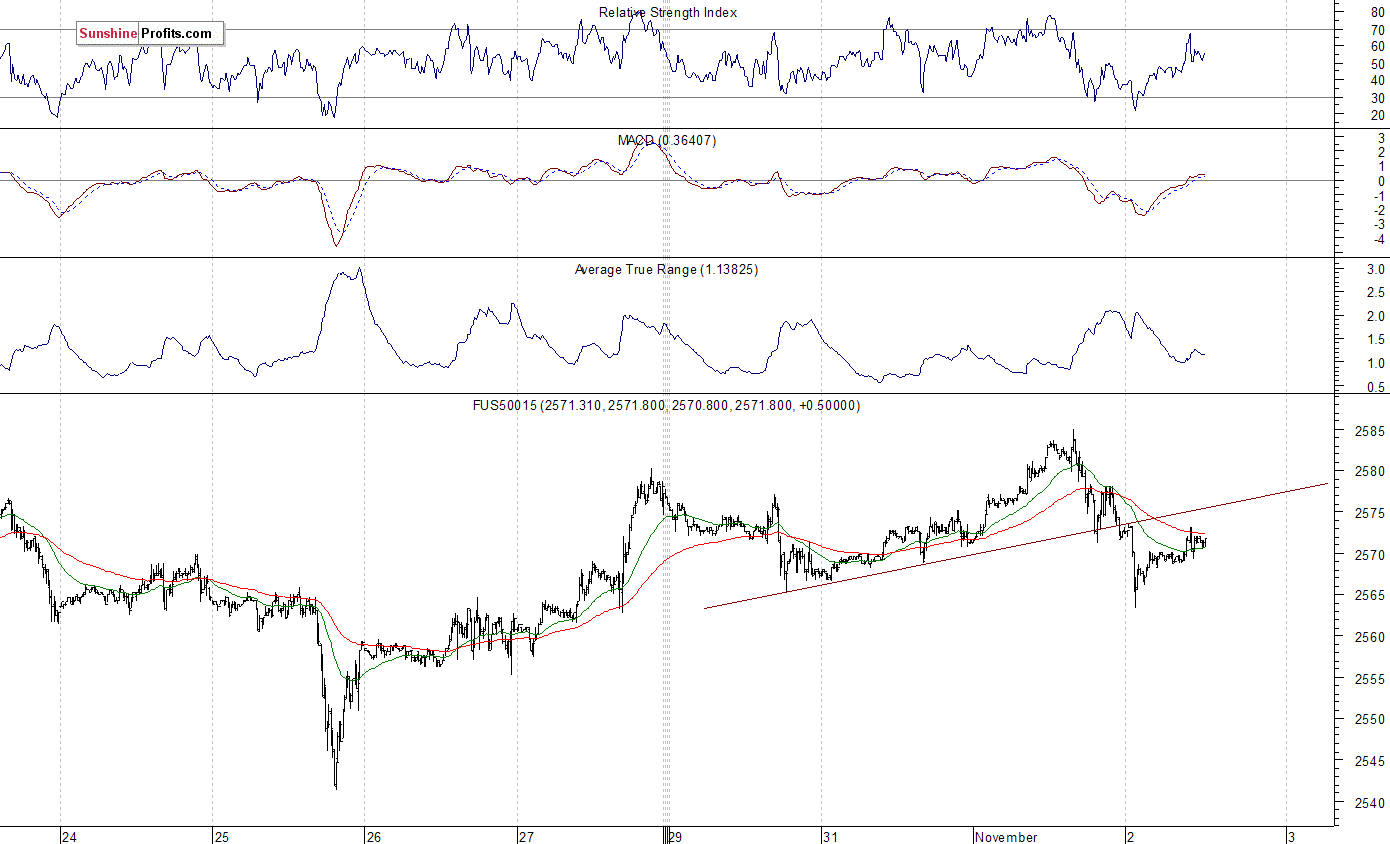
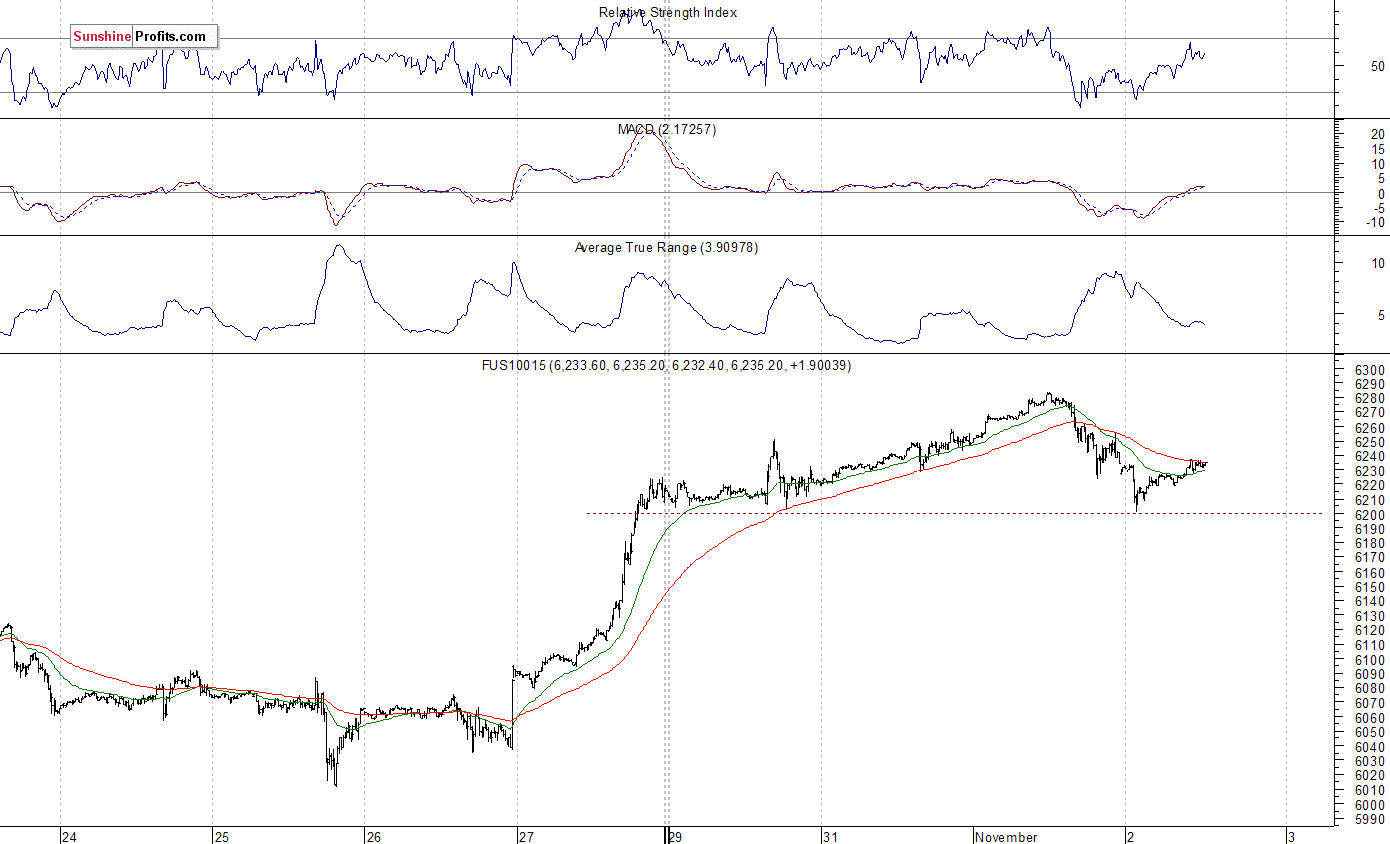
Expectations before the opening of today’s trading session are virtually flat, with index futures currently between -0.1% and -0.05% vs. their Wednesday’s closing prices. The European stock market indexes have been mixed so far. Investors will wait for some economic data announcements: Initial Claims, Productivity number at 8:30 a.m. The market expects that Initial Claims were at 235,000 last week. Investors will also wait for more quarterly corporate earnings releases. The S&P 500 futures contract trades within an intraday consolidation following yesterday’s move down. The nearest important level of support is at around 2,560-2,565, marked by local lows. On the other hand, resistance level is at 2,580-2,585, marked by new record high. The futures contract trades below its short-term upward trend line, as we can see on the 15-minute chart:
Nasdaq Relatively Weaker
The technology Nasdaq 100 futures contract follows a similar path, as it retraces some of its yesterday’s intraday move down. The nearest important level of resistance is at around 6,260-6,280, marked by new all-time high. On the other hand, support level is at 6,200, among others. Investors will wait for quarterly earnings release from Apple after the session close. The Nasdaq 100 futures contract remains above 6,200 mark, as the 15-minute chart shows:
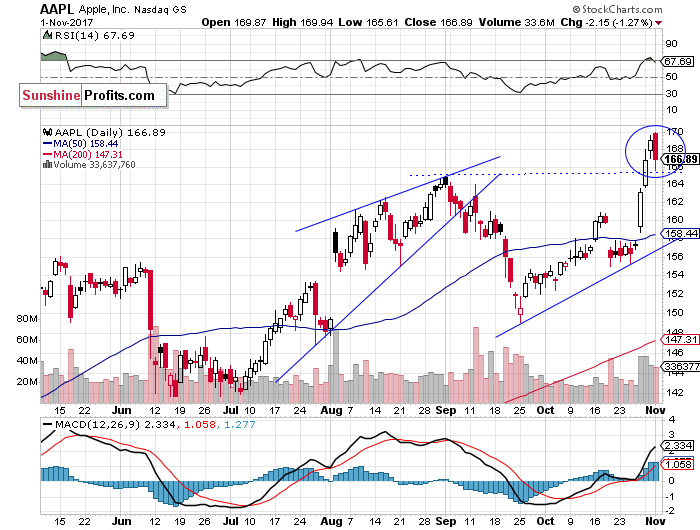
Let’s take a look at Apple, Inc. stock (AAPL) daily chart (chart courtesy of http://stockcharts.com). The price broke above its September 1 all-time high on Monday. It reached new record high of $169.94 yesterday, before closing lower. We still can see some short-term overbought conditions. We can say that something (i.e. individual asset, entire market, technical indicator) is overbought when its value rises so high that (according to the technical analysis) it’s unlikely to advance even further. Generally, an overbought market is a sign that a downward correction is likely to occur. Traders use indicators such as Relative Strength Index (RSI), Stochastic Oscillator, Money Flow Index to identify overbought conditions. For example, one can view a given market as “overbought” if the RSI indicator for this market is above 70. We can see negative bearish engulfing pattern on the daily chart, will uptrend reverse?
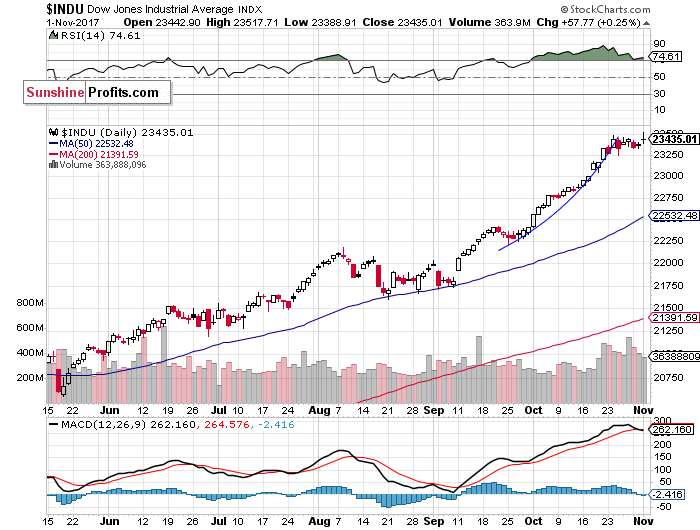
The Dow Jones Industrial Average daily chart (chart courtesy of http://stockcharts.com) shows that blue-chip index reached new all-time high yesterday, but it basically extended its over week-long consolidation. Is this a flat correction before another leg up or some topping pattern before downward reversal?
Concluding, the S&P 500 index reached new record high yesterday, before closing just 0.2% higher. Is this a topping pattern or just pause before another leg up? Will the market reach 2,600 mark? There have been no confirmed negative signals so far. However, we still can see medium-term overbought conditions along with negative technical divergences.
Thank you.
Paul Rejczak
Stock Trading Strategist
If you enjoyed the above analysis and would like to receive free follow-ups, we encourage you to sign up for our daily newsletter – it’s free and if you don’t like it, you can unsubscribe with just 2 clicks. If you sign up today, you’ll also get 7 days of free access to our premium daily Gold & Silver Trading Alerts. Sign up now.
Todd Market Forecast for 3:00 Pacific Wednesday November 1, 2017
DOW + 58 on 131 net advances
NASDAQ COMP – 11 on 791 net declines
SHORT TERM TREND Bullish
INTERMEDIATE TERM Bullish
STOCKS: Several factors seemed to be at work on Wednesday. One factor was strength in the overseas markets. Japan was up 408 points and Germany was ahead by 235 points. The latter is equivalent to a Dow gain of over 400. I contacted a friend in Germany and asked why the great strength and he said it was a mystery. He did say that the market breadth wasn’t all that great.
Our market jumped in sympathy, but the gains were soon capped and breadth was rather poor here too.
Earnings continue to be a positive. 65% of S&P 500 companies have reported profits and 75% have beaten estimates. The 5 year average is 69%.
GOLD: Gold moved up $5. We’re going to change our outlook below.
CHART: The supply demand 5 day m.a. reported nightly is under .45. This tends to be a level from which upmoves occur. The fact that we haven’t even had a decline complicates the forecast somewhat, but we’ll call it bullish. (check your introductory material for further explanations.)

BOTTOM LINE: (Trading)
Our intermediate term system is on a buy.
System 7 We are in cash. Stay there for now.
System 8 We are in cash. Stay there for now.
System 9 We are in cash.
NEWS AND FUNDAMENTALS: The ADP employment figures showed 235,000 jobs added, above the estimated 210,000. The PMI Mfg Index came in at 54.6, above the expected 54.5. The ISM Mfg Index 58.7, lower than the expected 59.5. Construction spending rose 0.3%, above the anticipated flat reading. Oil Inventories dropped 2.4 million barrels. Last week the rose 900,000. On Thursday we get jobless claims.
INTERESTING STUFF: “Glory is fleeting, but obscurity is forever.”
—— Napoleon Bonaparte (1769-1821)
TORONTO EXCHANGE: Toronto gained 4.
BONDS: The bond market rose again.
THE REST: The dollar moved higher. Crude oil fell back slightly.
Bonds –Bullish as of October 27.
U.S. dollar – Bullish as of October 20.
Euro — Bullish as of October 10.
Gold —-Change to bullish as of November 1.
Silver—- Change to bullish as of November 1.
Crude oil —-Bullish as of October 10.
Toronto Stock Exchange—- Bullish as of September 20, 2017.
We are on a long term buy signal for the markets of the U.S., Canada, Britain, Germany and France.

Monetary conditions (+2 means the Fed is actively dropping rates; +1 means a bias toward easing. 0 means neutral, -1 means a bias toward tightening, -2 means actively raising rates). RSI (30 or below is oversold, 80 or above is overbought). McClellan Oscillator ( minus 100 is oversold. Plus 100 is overbought). Composite Gauge (5 or below is negative, 13 or above is positive). Composite Gauge five day m.a. (8.0 or below is overbought. 13.0 or above is oversold). CBOE Put Call Ratio ( .80 or below is a negative. 1.00 or above is a positive). Volatility Index, VIX (low teens bearish, high twenties bullish), VIX % single day change. + 5 or greater bullish. -5 or less, bearish. VIX % change 5 day m.a. +3.0 or above bullish, -3.0 or below, bearish. Advances minus declines three day m.a.( +500 is bearish. – 500 is bullish). Supply Demand 5 day m.a. (.45 or below is a positive. .80 or above is a negative). Trading Index (TRIN) 1.40 or above bullish. No level for bearish.
No guarantees are made. Traders can and do lose money. The publisher may take positions in recommended securities.

-
I know Mike is a very solid investor and respect his opinions very much. So if he says pay attention to this or that - I will.
~ Dale G.
-
I've started managing my own investments so view Michael's site as a one-stop shop from which to get information and perspectives.
~ Dave E.
-
Michael offers easy reading, honest, common sense information that anyone can use in a practical manner.
~ der_al.
-
A sane voice in a scrambled investment world.
~ Ed R.
Inside Edge Pro Contributors

Greg Weldon

Josef Schachter

Tyler Bollhorn

Ryan Irvine

Paul Beattie

Martin Straith

Patrick Ceresna

Mark Leibovit

James Thorne

Victor Adair