
Stocks & Equities
Never argue with an idiot. They will drag you down to their level and beat you with experience.
Mark Twain
Over the past several years the Naysayers have predicted the Market would crash and burn; we blatantly disagreed and opted instead to state that the market would continue to soar higher and higher. Despite the severe beating these naysayers have taken, they insist on regurgitating the same trash over and over again in the blind hope that by some miracle their insane ramblings come to pass. As soon as October was upon us, these experts started screaming at the top of their lungs. What was their latest prediction; a repeat of the 1987 Stock Market Crash. We immediately repudiated these predictions. Here is a brief excerpt from the article we posted in October.
They never seem to let up on pushing this sewage onto the unsuspecting masses. This is a clear example of insanity in action; mouthing the same thing over and over again with the desperate hope that this time the outcome will be different. The outcome will not be different this time, at least not yet. These guys should focus on writing fiction for reality seems to elude them completely. For years we have stated (and rightly so) that until the sentiment changes, this market will continue to soar higher and higher.
The latest nonsense is to state market omens that have a terrible record of coming to pass are about to trigger a crash; ones odds are better if one looks at tea leaves, plays with skull bones or hires some monkey to throw darts at a board with the words up or down plastered on it. One has to determine the trend first and look at several underlying forces before one can attempt to predict where the market is headed. However, these fools read a book or two, memorisesomeone else’s theories and assume all of a sudden they are experts. Fundamentals and technical’s are both useless when used in isolation. One has to look at the emotion driving the markets. In other words, what are the masses thinking or doing? When one looks at the sentiment data, the conclusion is inescapable. Stock markets always crash on a note of euphoriaand the masses are far from being happy.
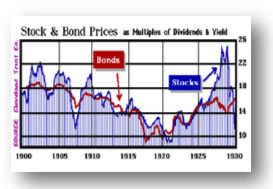
Masses are not embracing one of the Most Hated Bull Markets in History
The images below speak a thousand words, so there is no need for us to add any commentary.

The Technical Outlook

While the Dow is trading in the extremely overbought ranges, any pullback will most likely end in the 21,000-21,500 ranges. For the correction to pick up steam, it would need to close below this level on a weekly basis. As the trend is still positive, the odds of the Dow crashing are very low. At the most, the Dow would test its breakout point which falls in the 18,900-19,200 ranges unless the trend were to turn negative suddenly or the masses suddenly embraced the market with gusto. At this point, the trend is strong and showing no signs of weakening. Remember that the markets can remain irrational for much longer than most traders can remain solvent by betting against it.
Inflation remains a non-issue on a worldwide basis
Central banks worldwide are either standing down or opting for rate cuts. This indicates that while the economy is improving somewhat, the global economy is far from healthy and low rates will continue to dominate the scene. In a lower rate environment corporations borrow more money and the new game is to use this money to buy back shares and in doing so magically improve the EPS.
Conclusion
When the Dow was trading below 20K, we stated that the next target was 21K; this target was struck in a few short months. After that, we raised the target to 22 and 23K. Now we will go on record and state that the Dow is likely to test 28,000-28,500 with a possible overshoot to 30K before it crashes. We will be providing our subscribers with an in-depth analysis of the path the Dow will traverse to achieve this target. We don’t expect the Dow to just shoot to these targets, certain requirements have to be fulfilled, but so far the Dow is following the path we expected it to take.
Before you listen to these so-called experts who seem quite happy to dish out faulty information, take a look at their track record. A simple search will reveal that over 90% of them are full of hot air and had any of these Dr’s of Doom followed even a sliver of their advice, they would have been blown out of the game long ago. The fact that they are still here tells you that they are trying to pan their sage advice to you in return for a certain fee; advice they would never follow.
A simple game plan
View strong corrections through a bullish lens. This game plan will remain valid until the masses turn bullish or the trend turns negative. The stronger the deviation, the better the opportunity.
You can’t make anything idiot proof because idiots are so ingenious.
Ron Burns

Todd Market Forecast for 3:00 pm PST Tuesday November 14, 2017.
DOW – 30 on 725 net declines
NASDAQ COMP – 20 on 382 net declines
SHORT TERM TREND Bullish
INTERMEDIATE TERM Bullish
STOCKS: The weight of the evidence suggests a market that should move higher, but it’s being suppressed by the lack of progress on at tax reform plan. More revelations about Senate candidate Roy Moore are also contributing to the uncertainty. As you know, the market hates uncertainty.
One specific factor leading the market lower was a drop in commodities such as crude oil
GOLD: Gold was down in the early going, but came back to up by $2.
That is normally a bullish pattern.
CHART: We have been showing the put call ratio and noting that it shows sufficient bearishness to support a multi day rally. Here’s another measure of sentiment. It comes to us courtesy of Tom McClellan of McClellan Financial Publications.
It is the NAAIM Exposure Index and measures the overall market exposure of money managers. Right now it’s under 60%, which shows a lot of bearishness.

BOTTOM LINE: (Trading)
Our intermediate term system is on a buy.
System 7 We are long the SSO at 102.50. Stay with it on Wednesday.
System 8 We are in cash. Stay there for now.
System 9 We are in cash.
NEWS AND FUNDAMENTALS: The PPI final demand rose 0.4%, above the expected rise of 0.1%. On Wednesday we get the CPI, retail sales, oil inventories and the Empire State Mfg. Index.
INTERESTING STUFF: “A lie gets halfway around the world before the truth has a chance to get its pants on.”—– Sir Winston Churchill (1874-1965)
TORONTO EXCHANGE: Toronto got whacked for 113.
BONDS: The bond market moved solidly higher.
THE REST: The dollar was sharply lower. Crude oil took a solid hit.
Bonds –Change to bullish as of November 14.
U.S. dollar – Bullish as of October 20.
Euro — Bullish as of October 10.
Gold —-Bullish as of November 1.
Silver—- Bullish as of November 1.
Crude oil —-Change to bearish as of November 14.
Toronto Stock Exchange—- Bullish as of September 20, 2017.
We are on a long term buy signal for the markets of the U.S., Canada, Britain, Germany and France.

Monetary conditions (+2 means the Fed is actively dropping rates; +1 means a bias toward easing. 0 means neutral, -1 means a bias toward tightening, -2 means actively raising rates). RSI (30 or below is oversold, 80 or above is overbought). McClellan Oscillator ( minus 100 is oversold. Plus 100 is overbought). Composite Gauge (5 or below is negative, 13 or above is positive). Composite Gauge five day m.a. (8.0 or below is overbought. 13.0 or above is oversold). CBOE Put Call Ratio ( .80 or below is a negative. 1.00 or above is a positive). Volatility Index, VIX (low teens bearish, high twenties bullish), VIX % single day change. + 5 or greater bullish. -5 or less, bearish. VIX % change 5 day m.a. +3.0 or above bullish, -3.0 or below, bearish. Advances minus declines three day m.a.( +500 is bearish. – 500 is bullish). Supply Demand 5 day m.a. (.45 or below is a positive. .80 or above is a negative). Trading Index (TRIN) 1.40 or above bullish. No level for bearish.
No guarantees are made. Traders can and do lose money. The publisher may take positions in recommended securities.

![]()
In this week’s issue:
Stockscores Free Webinars
What are the Economics of Stock Trading?
Nov 15, 2017 6:00 PM PST
Whether you are a long term investor or a short term active trader, it is essential to understand the economics of trading. How should you measure your returns? What are the risks? How much capital does it take to trade? What are the potential gains? These questions and more will be addressed during this webinar. I will show performance data for my day, swing and position trading over the last few months.
Stockscores Market Minutes – Expect Failure
Whether it is the development of a new trading strategy or just the trades you make day to day, expect to fail often. Trading is simple, but it is not easy. Learn from your mistakes and don’t let failure stop you from achieving success. That plus this week’s Market Analysis and the trade of the week on RLOG.
To get instant updates when I upload a new video, subscribe to the Stockscores YouTube Channel
Trader Training – The Importance of Trading Less
It’s better to miss a good trade than to take a bad one. Missing a good trade doesn’t deplete your capital-it only fails to add to it. A bad trade will not only reduce the size of your trading account, it will eat up emotional capital and your confidence.
A losing trade is not a bad trade. Bad trades are simply taking the trade that doesn’t meet your requirements. Bad trades come from working hard to see something that’s not there, guided by your need to trade rather than the market offering a good opportunity.
I have read very few books about the stock market, but one that I’ve read more than once and that I think is a must-read for every investor is Reminiscences of a Stock Operator by Edwin Lefevre. Here is a wonderful quote from that book that captures the essence of what this chapter is about:
“What beat me was not having brains enough to stick to my own game-that is, to play the market only when I was satisfied that precedents favored my play. There is the plain fool, who does the wrong thing at all times everywhere, but there is also the Wall Street fool, who thinks he must trade all the time. No man can have adequate reasons for buying or selling stocks daily-or sufficient knowledge to make his play an intelligent play.”
-Reminiscences of a Stock Operator
I advise all my students that they will make more money by trading less, at least so long as trading less is the result of having a high standard for what they trade. If you tell yourself you’re limited to only making 20 trades a year, you’re probably going to be very fussy about what trades you take. With less than two trades to be made each month, only the very best opportunities will pass your analysis. All of the “maybes” or “pretty goods” will get thrown out.
We take the pretty good trades because we’re afraid of missing out. It’s painful to watch a stock you considered buying but passed on go up. You remember this pain and the next time you see something that looks pretty good, you take it with little regard for the expected value of trading pretty good opportunities.
Pretty good means the trade will make money some of the time and lose some of the time, and the average over a large number of trades may be close to breaking even. The fact that one pretty good trade did well is reasonable and expected. In the context of expected value, taking those pretty good trades many times will lead to less than stellar results when the losers offset the winners.
You shouldn’t judge your trading success one trade at a time. You must look at your results over a large number of trades. To maximize overall profitability requires you to have a high standard for what trades you make. Maintaining that standard will be easier if you take the trades that stand out as an ideal fit to your strategy, not by taking those that are marginal and require a lot of hard work to uncover.

Ran the Abnormal Breaks Market Scans for the US and Canada today, did not find too much I like but there is one stand out, listed on both the TSX and Nasdaq.

1. APTO
Three months of sideways trading on T.APS and APTO with a break to new highs today on strong volume. Support at $1.60 on the US listing and $2 on the Canadian.

If you wish to unsubscribe from the Stockscores Foundation newsletter or change the format of email you are receiving please login to your Stockscores account. Copyright Stockscores Analytics Corp.
References
- Get the Stockscore on any of over 20,000 North American stocks.
- Background on the theories used by Stockscores.
- Strategies that can help you find new opportunities.
- Scan the market using extensive filter criteria.
- Build a portfolio of stocks and view a slide show of their charts.
- See which sectors are leading the market, and their components.
Disclaimer
This is not an investment advisory, and should not be used to make investment decisions. Information in Stockscores Foundation is often opinionated and should be considered for information purposes only. No stock exchange anywhere has approved or disapproved of the information contained herein. There is no express or implied solicitation to buy or sell securities. The writers and editors of this newsletter may have positions in the stocks discussed above and may trade in the stocks mentioned. Don’t consider buying or selling any stock without conducting your own due diligence.

 One year on and the Trump rally is very much alive and well; U.S. dollar consolidating but further gains may lie ahead; GBP under pressure as May’s problems mount; Oil inventories eyed as oil rally continues.
One year on from Donald Trump’s election victory and U.S. equity markets are on course to open near record highs once again, having made stunning gains over the last 12 months – more than 30% in the case of the Dow and Nasdaq.
While many may claim that Trump’s achievements to date equate to very little given his difficulties repealing and replacing Obamacare, slower than expected progress on tax reform and minimal detail on fiscal stimulus, investors have clearly not been deterred as is evident by staggering gains in U.S. stocks. Of course, much of this may still be conditional on the President delivering on the latter two in particular and some is also attributable to the rally in global equity markets over the same period, but the Trump trade is clearly still alive and well.
This is despite the fact that the Fed has raised interest rates three times since the election and is likely to do so again next month, which many will have believed could have threatened the economic recovery and with that, the stock market rally. That is clearly not the case and with the economy having now come off two quarters of around 3% annualized growth, one may wonder whether there is any need for the spending element of the President’s plan to revive the economy. There certainly doesn’t appear to be the desire for it that we’ve seen for tax reform over the course of the year.
While political and geopolitical events have caused minor problems along the way, the rally has been very gradual and consistent with few hiccups along the way. In the absence of any major U.S. economic events this week, Trump’s tour of Asia will continue to attract the bulk of the attention, although I imagine the rhetoric coming from the meetings and press conferences will be broadly in line with what we’ve heard already. Assuming no slip ups along the way and no unexpected back and forth with North Korea – which is possible given the country is one of the main topics of conversation – there’s little reason to believe we won’t see more of the same in the markets.
USD consolidating but further gains may lie ahead
The U.S. dollar has consolidated over the last couple of weeks since rebounding off its lows on the prospect of more rate hikes and tax reform progressing more smoothly than thought – albeit not as quickly as one would hope. The greenback is still looking bullish into the end of the year though and the appointment of Jerome Powell as Janet Yellen’s replacement as Chair should support this, particularly if he is accompanied by other hawkish appointments on the board.
GBP under pressure as May’s problems mount
It’s been a relatively slow week for the markets so far, despite there being a number of concerning political stories that have the potential to cause further disruption down the line. The UK, as ever, is right at the top of this list, with Prime Minister Theresa May in the uncomfortable position of potentially being forced to sack another member of her cabinet at a time when her position is already seen by many as untenable in the aftermath of her disastrous election campaign.
Still, the softness we’re seeing in the pound today is likely more a reflection of the Bank of England’s decision to raise interest rates last week while adopting a dovish stance on future hikes. While much of the move was priced in on Thursday, we have seen a minor pullback since and I think today’s drop is simply a continuation of Thursday’s initial decline. The pound will face a big test around 1.30-1.3050 against the dollar should we reach those levels and a break of this could trigger a move back towards 1.28.
Oil inventories eyed as oil rally continues
The one notable release today will be crude inventory numbers from EIA, which come after API reported another small drawdown on Tuesday and as the political situation in Saudi Arabia – OPEC’s largest producer – becomes a growing concern. I don’t think this has been a big factor in oil’s recent rise given the talk of an output cut extension next year, growing demand forecasts and the stabilization in U.S. output. With momentum not slowing though there does appear to be more upside potential and the situation in Saudi Arabia may be supportive of this the longer is goes on.
About the Author
Craig Erlam is senior market analyst at OANDA who also writes for OANDA’s Market Pulse site, Marketpulse.com.
After a severe selloff, precious metals have enjoyed a bit of a respite. Corrections are a function of time and/or price. The correction to the recent selloff has been more in time than price. Metals and miners have stabilized over the past nine trading days but have not rebounded much in price terms. Gold has barely rallied $20/oz while GDX and GDXJ have rebounded less than 4% and 5% respectively. In addition to the weakness of this rally, the gold stocks are sporting a negative divergence and that does not bode well for an end of the year rally.
The negative divergence is visible in the daily bar charts below. We plot Gold along with the gold stock ETF’s and are own “mini” GDXJ index. The price action in Gold since October looks constructive. The market has held its October low and the 200-day moving average. It could have a chance to reach $1300-$1310. However, the miners are saying no to that possibility. Everything from large miners to small juniors made a new low while Gold did not. The second negative divergence is in regards to the 200-day moving average.

Gold has corrected $100/oz over the past seven weeks but the relevant sentiment indicators do not indicate much of a shift in sentiment. In the chart below we plot the net speculative position in Gold as a percentage of open interest (Gold CoT) and the GLD put-call ratio. The CoT remains elevated at 40%. The two important lows of the past 12 months occurred at 16% and 26%. The put-call ratio (which is smoothed by a 20-day moving average) has some work to do before it reaches a level associated with market lows. Finally, Gold is not oversold based on a simple 50-day ROC.
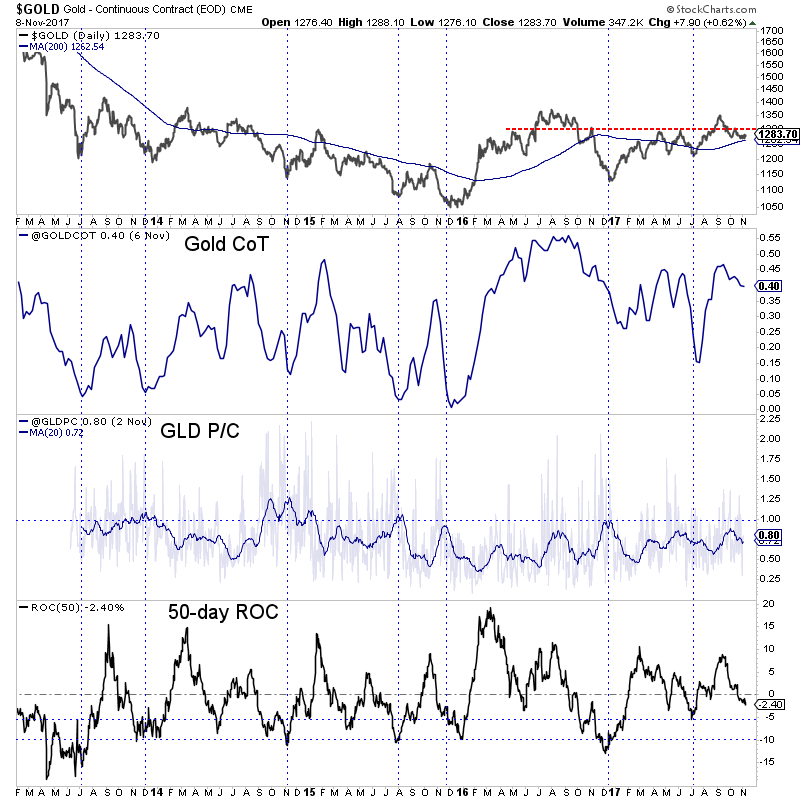
The relative weakness and negative divergence in the gold stocks coupled could portend to lower Gold prices by the end of 2017. Gold has important support at $1260 and if it loses that it threatens a decline to $1200-$1220. The gold stocks are lagging Gold across the board with the worst performers being the smaller juniors. Given the weak technicals and questionable fundamentals for Gold, we will continue to wait for lower prices, worse sentiment and a low-risk buying opportunity in the coming months. The good news is those who buy weakness in the months ahead can position themselves for strong profits in 2018. In the meantime, find the best companies and evaluate their potential value and catalysts that will drive buying.

-
I know Mike is a very solid investor and respect his opinions very much. So if he says pay attention to this or that - I will.
~ Dale G.
-
I've started managing my own investments so view Michael's site as a one-stop shop from which to get information and perspectives.
~ Dave E.
-
Michael offers easy reading, honest, common sense information that anyone can use in a practical manner.
~ der_al.
-
A sane voice in a scrambled investment world.
~ Ed R.
Inside Edge Pro Contributors

Greg Weldon

Josef Schachter

Tyler Bollhorn

Ryan Irvine

Paul Beattie

Martin Straith

Patrick Ceresna

Mark Leibovit

James Thorne

Victor Adair