
Real Estate
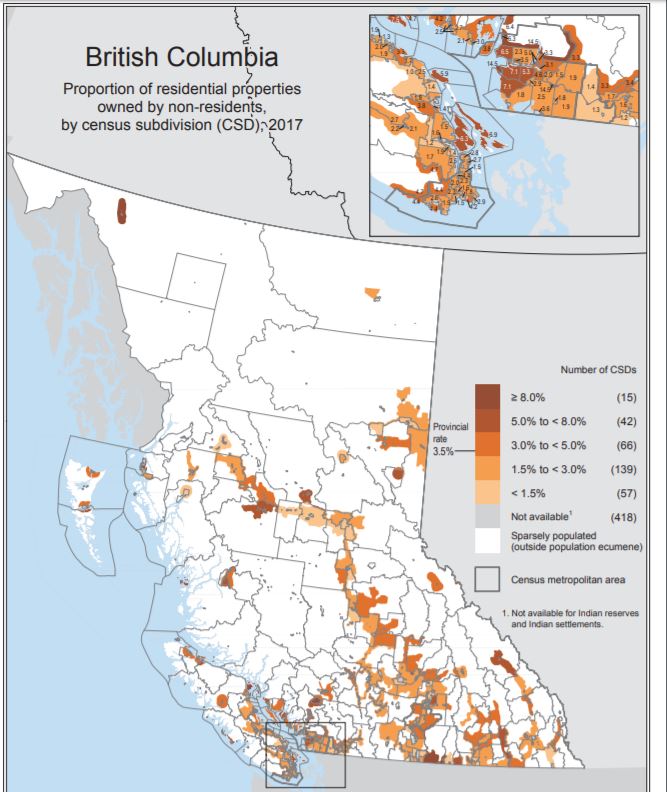
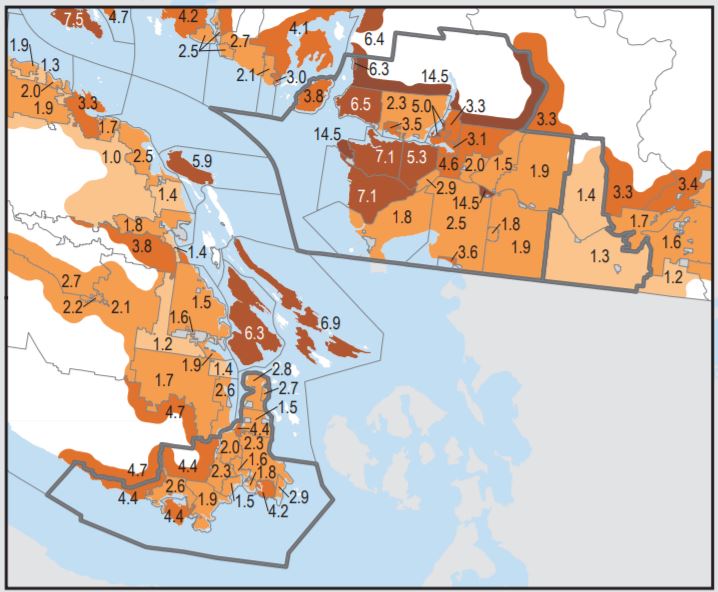
Yes, accurate data does matter – especially when it comes to making government policy designed to “cool” or “rein in” private markets. We’ve warned for some time that federal, provincial and municipal efforts to impede the housing market could have significant negative un-intended consequences. And this chart from Stats Can suggests the policies are be made to fix a problem that may not exist outside 3 or 4 high-end (never affordable at any time) neighbourhoods.

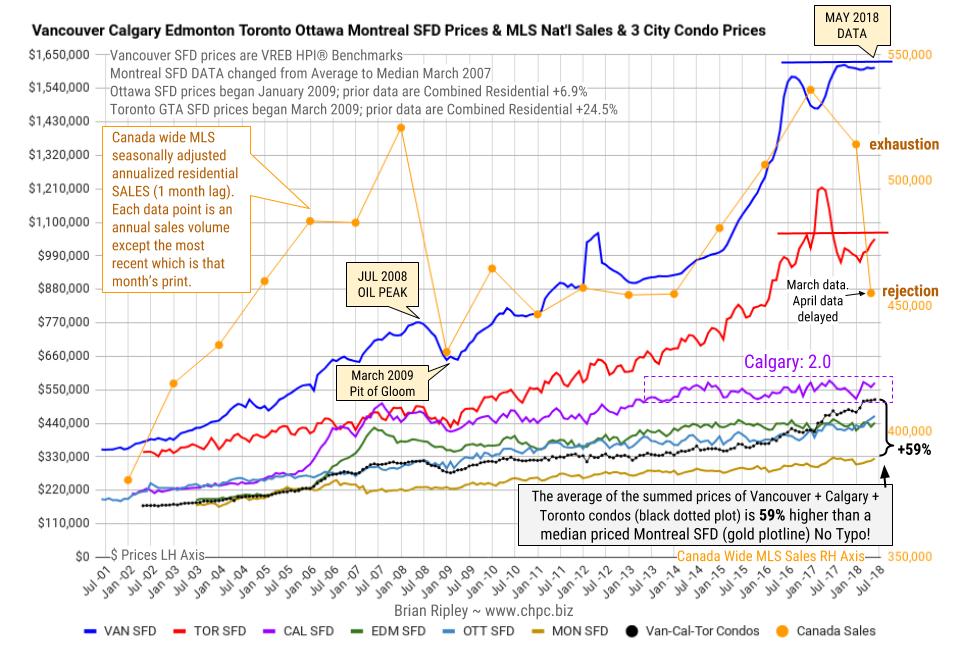
The chart above shows the average detached housing prices for Vancouver*, Calgary, Edmonton, Toronto*, Ottawa* and Montréal* (the six Canadian cities with over a million people each) as well as the average of the sum of Vancouver, Calgary and Toronto condo (apartment) prices on the left axis. On the right axis is the seasonally adjusted annualized rate (SAAR) of MLS® Residential Sales across Canada (one month lag).
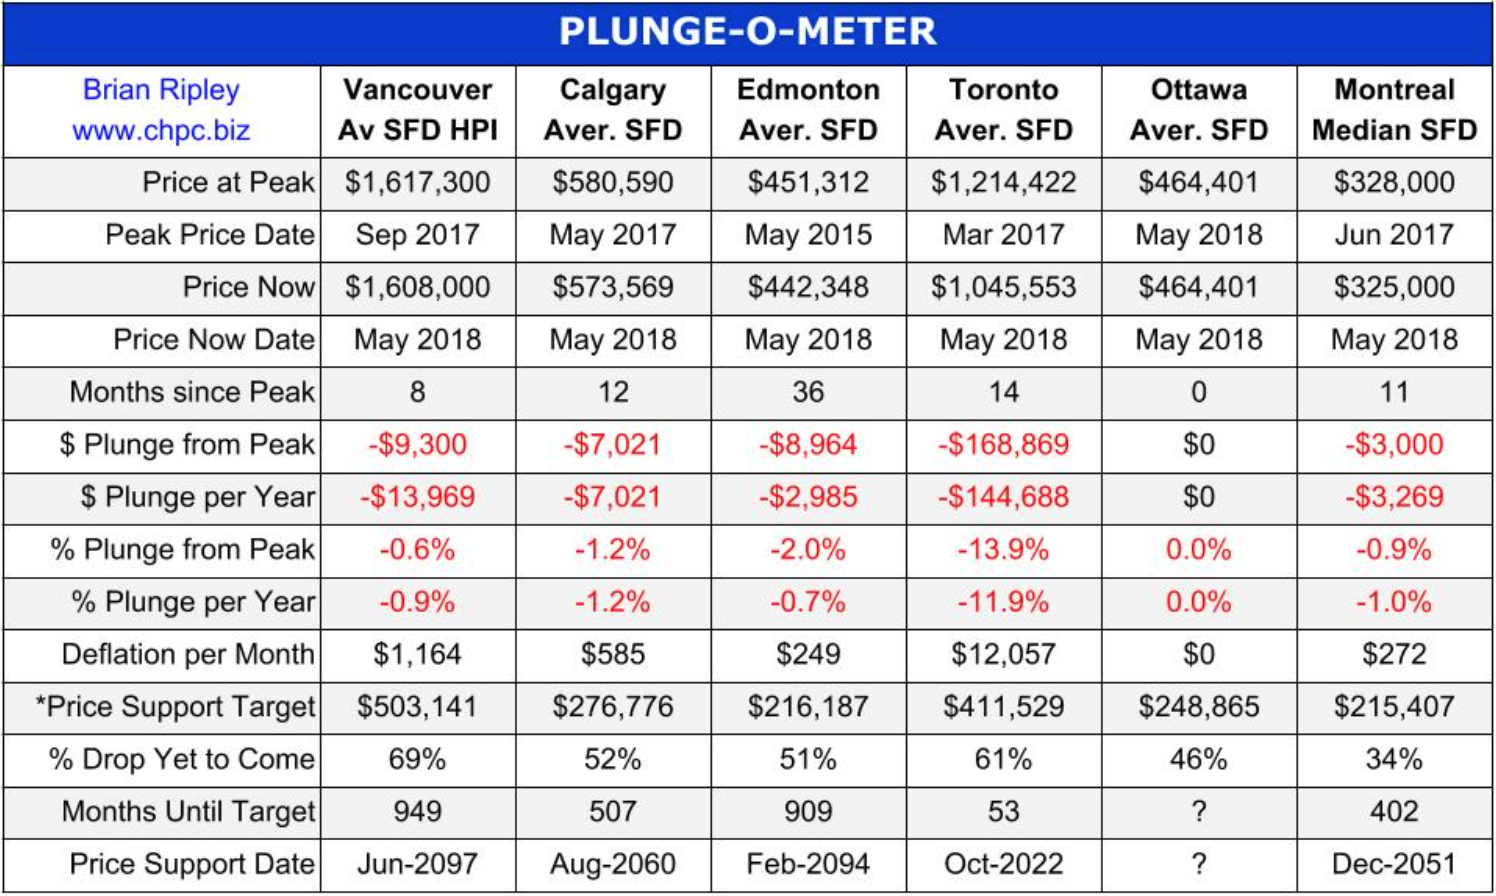
In May 2018 Toronto metro SFD prices remain under resistance and 14 months since the March 2017 spike and peak price, they have lost $168,869 or 14% (Plunge-O-Meter). Vancouver prices are still defying gravity but also at resistance. FOMO and speculative pricing is still on in the strata sector in some neighborhoods.
Anyone owning a detached house in the scorching hot Vancouver market is sitting on an unredeemed lottery ticket while the Bank of Canada interest rate up-moves and stress testing at street level are thinning the crowd even more.
|
In Calgary prices are labouring under the new Energy Sector 2.0 as the oil majors head for blacker fields; big money is fleeing Canada and has been for nearly 20 years, but on the street, Calgary buyers are buying the price dips.
|
It remains interesting to note that the combined average sum price of a Vancouver, Calgary & Toronto condo is currently 59% (no typo) more expensive than a median priced Montreal SFD. Montreal has more listing inventory available for sale than any of the other 5 biggest metros in Canada and the lowest monthly absorption rate based on total listings and sales.
CMHC is not so sure. In November 2015 CMHC had a private audience in New York City and brought along a stress test of $35/bbl oil and its potential effect on Canada. I covered the bullet points here and here. The Department of Finance is also worried:
The age-related deceleration in economic growth in Canada will take place amidst other powerful, slow-moving global forces. As in Canada, the world population is aging and productivity growth (Canadian Productivity Chart bottom of this page) has slowed across OECD countries. These structural forces are paving the way to slower global growth for the next number of years. Slower nominal GDP growth will thus reduce the growth rate of government revenues, thereby limiting the capacity of governments to continue to maintain the growth rates of public expenditure at levels as high as in the past. At the same time, population aging is also expected to put upward pressure on public expenditure, notably for age-related programs such as elderly benefits. Department of Finance Canada December 2016

The end is in sight for “fire sale” mortgage rates as Banks begin to push their rates up. In the meantime BC’s & Toronto’s unaffordable mania now leaves only one rational market left in play, where the last 4 years prices have been sideways and winding up for an eventual advance – R. Zurrer for Money Talks
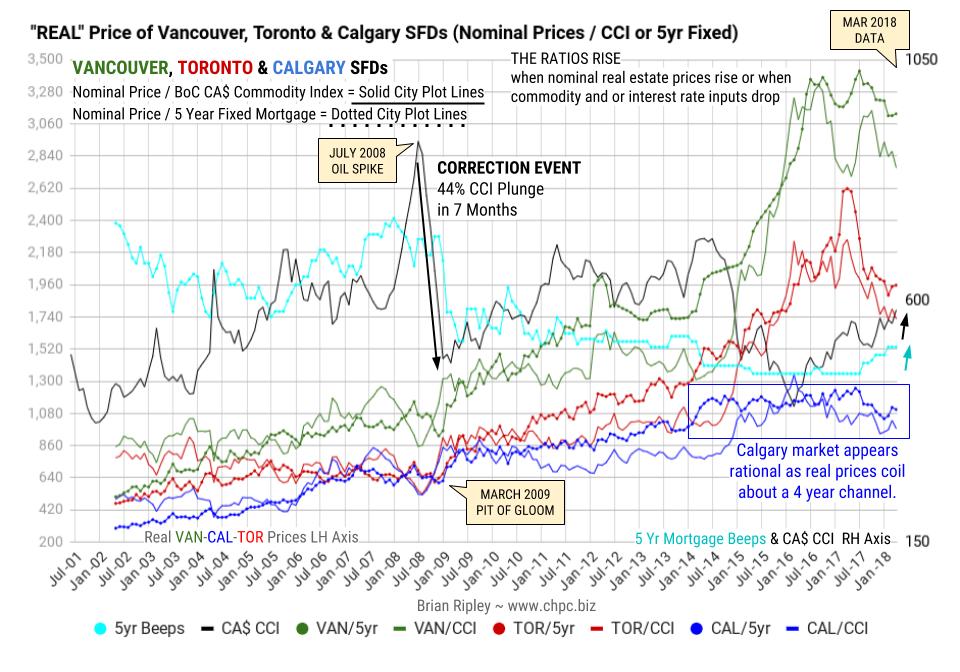
The chart above shows the “real price” of Vancouver, Toronto & Calgary SFDs when looked at from the point of view of the BoC Canadian Commodity Index (CCI) and Borrowing Costs (retail 5yr Mortgage) which are the main input costs apart from operating expenses and tax.
REAL PRICE of HOUSING of Vancouver, Toronto and Calgary Single Family Detached and the Bank of Canada $CAD Commodity Index & 5 Year Fixed Mortgage
In March 2018 commodity prices are still rising and have added to the recent mortgage rate rise in keeping real prices on a downtrend. In Calgary, although prices look rational, the pending seasonal slowdown in the energy sector should limit the nominal purchasing power of weak hands in Alberta but will lift real prices as the cost of energy drops.
There should be no more surprise BoC rate cuts if the federal government mandate plan is to use their fiscal powers, but as we know, the government can surprise us at any time, eg: the new Mortgage Stress Test, the CMHC credit tightening and offloading of risk onto the retail lenders; the threat of new chilling tax and CRA penalties and of course policy flip flops by the federal government like its reversal on electoral reform.
The last 9 years of ZIRP & NIRP monetary policy combined with CMHC’s out-of-control insurance scheme (also add in the BC Gov’t Sub Prime Cash give-away) has been a terrible social experiment in the service of political power and it has replaced affordable housing with indentured mania. Is there a better way?
In a commodity crash, producers lose pricing power as international competitors drop finished prices neutralizing any gains for Canadian exporters from a withering CAD/USD while the +/- 70% of Canadian employees working in the consumer and service sectors look for ways to leverage their deflating earnings at the supermarket and or job fair.
The other major cost input, the retail 5 year fixed mortgage rate (aqua dotted plot line) and last July it moved up off its outstanding record low of 4.64% to 4.84%. This month the Bank of Canada rate remains at 5.14% although street vendors are still pushing sub 3% short term mortgages while the stress test weeds out the weak hands.
The end is in site for fire sale mortgage rates as the major banks push their rates up which forces the real cost of housing (dotted city plot lines) relative to those rates to turn down.
Calgarians are wary of the Trumpster who vows to unleash energy supply 2.0. And when credit is a lifestyle employer as it continues to be in Canada, appraisers will eventually be in demand again.

Other markets that have already been thrashed, like Edmonton and Calgary, appear to be ready to take off now according to Ozzie Jurock in the interview below. Home sales in the red hot markets of Vancouver and Toronto (Toronto home sales tumbled 39.5 percent in March from the previous year) have succumbed in part to persistent attempts by Governments through tax and regulation to solve the housng shortage. (Note, the audio is rough in a few spots). There are some statistics below – R. Zurrer for Money Talks
Toronto home sales tumbled 39.5 percent in March from the previous year, while Vancouver sales fell 29.7 percent, according to data from the Toronto Real Estate Board (TREB) and the Real Estate Board of Greater Vancouver (REBGV).
Together, the Vancouver and Toronto regions account for about half of house sales by volume in Canada.
Sales of detached homes in Vancouver fell 37 percent, while condo sales were down 26.7 percent, as demand cooled and fewer homes were listed, REBGV said.
In Toronto, sales of detached homes plunged 46.3 percent and condo sales dropped 32.7 percent, as many would-be buyers put their plans on hold, TREB said.
The average selling price in the Toronto area was C$784,558($613,799), down 14.3 percent from C$915,126 in March 2017, though up 2.1 percent from February 2018.
The average selling price for a detached home, the most expensive segment of the market, plunged 17.1 percent, while the average condo price rose 6.1 percent.
In Vancouver, the average selling price for a detached home slid 6.2 percent, while the average selling price in the red hot condo segment was up 22.8 percent.
Demand for expensive detached homes has been cool in both cities as tax measures, along with stricter lending requirements and higher mortgage rates, have weighed.
At the same time, demand in the cheaper condo segment has remained strong, as buyers scramble to gain a foothold amid rapidly escalating prices and limited supply.
New listings fell 12.4 percent in Toronto and 6.6 percent in Vancouver.
“Even with lower demand, upward pressure on prices will continue as long as the supply of homes for sale remains low,” said REBGV president Phil Moore in a statement.
The Bank of Canada has raised interest rates three times since last July and another hike is expected later this year, and stricter lending rules took effect on Jan. 1.
The benchmark price, preferred by analysts because it smoothes out the composition of sales, was up 1.5 percent year-over-year in Toronto, and up 16.1 percent in Vancouver.
($1 = 1.2782 Canadian dollars)
Real estate guru Ozzie Jurock is back from his round-the-world adventures. He dives right into the implications of Canada’s new speculation tax, prices and Hot Properties
….related from Michael: Government Desperation for Cash & How It Will Affect You


-
I know Mike is a very solid investor and respect his opinions very much. So if he says pay attention to this or that - I will.
~ Dale G.
-
I've started managing my own investments so view Michael's site as a one-stop shop from which to get information and perspectives.
~ Dave E.
-
Michael offers easy reading, honest, common sense information that anyone can use in a practical manner.
~ der_al.
-
A sane voice in a scrambled investment world.
~ Ed R.
Inside Edge Pro Contributors

Greg Weldon

Josef Schachter

Tyler Bollhorn

Ryan Irvine

Paul Beattie

Martin Straith

Patrick Ceresna

Mark Leibovit

James Thorne

Victor Adair