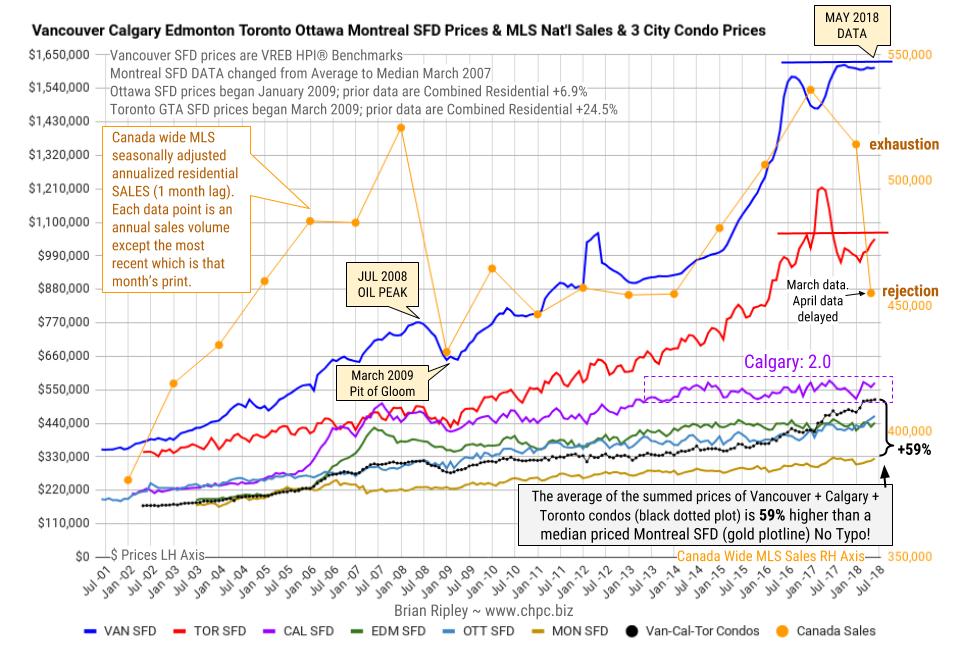
The chart above shows the average detached housing prices for Vancouver*, Calgary, Edmonton, Toronto*, Ottawa* and Montréal* (the six Canadian cities with over a million people each) as well as the average of the sum of Vancouver, Calgary and Toronto condo (apartment) prices on the left axis. On the right axis is the seasonally adjusted annualized rate (SAAR) of MLS® Residential Sales across Canada (one month lag).
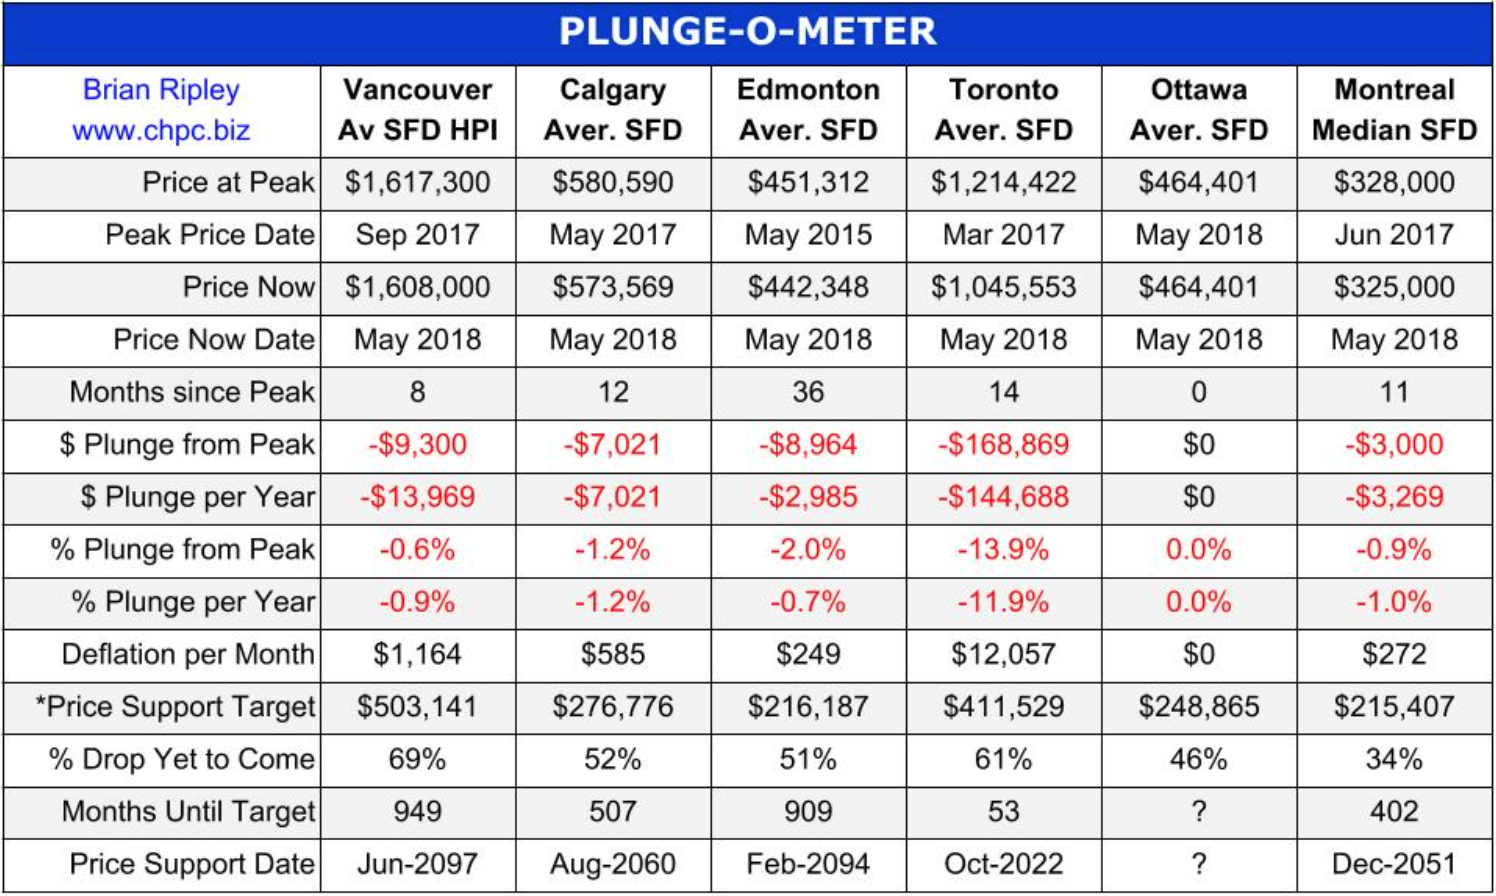
In May 2018 Toronto metro SFD prices remain under resistance and 14 months since the March 2017 spike and peak price, they have lost $168,869 or 14% (Plunge-O-Meter). Vancouver prices are still defying gravity but also at resistance. FOMO and speculative pricing is still on in the strata sector in some neighborhoods.
Anyone owning a detached house in the scorching hot Vancouver market is sitting on an unredeemed lottery ticket while the Bank of Canada interest rate up-moves and stress testing at street level are thinning the crowd even more.
|
In Calgary prices are labouring under the new Energy Sector 2.0 as the oil majors head for blacker fields; big money is fleeing Canada and has been for nearly 20 years, but on the street, Calgary buyers are buying the price dips.
|
It remains interesting to note that the combined average sum price of a Vancouver, Calgary & Toronto condo is currently 59% (no typo) more expensive than a median priced Montreal SFD. Montreal has more listing inventory available for sale than any of the other 5 biggest metros in Canada and the lowest monthly absorption rate based on total listings and sales.
CMHC is not so sure. In November 2015 CMHC had a private audience in New York City and brought along a stress test of $35/bbl oil and its potential effect on Canada. I covered the bullet points here and here. The Department of Finance is also worried:
The age-related deceleration in economic growth in Canada will take place amidst other powerful, slow-moving global forces. As in Canada, the world population is aging and productivity growth (Canadian Productivity Chart bottom of this page) has slowed across OECD countries. These structural forces are paving the way to slower global growth for the next number of years. Slower nominal GDP growth will thus reduce the growth rate of government revenues, thereby limiting the capacity of governments to continue to maintain the growth rates of public expenditure at levels as high as in the past. At the same time, population aging is also expected to put upward pressure on public expenditure, notably for age-related programs such as elderly benefits. Department of Finance Canada December 2016