
Personal Finance
It’s happening on cue: Over the last few days, some of the world’s most volatile nations are provoking the Trump administration big-time. Consider what’s happened …
Test #1. North Korea test-launched a new ballistic missile into the East Sea. The U.N. Security Council and Japanese Prime Minister Abe strongly condemned the act. President Trump says the U.S. has Japan’s back — but we both know that’s not going to deter North Korea’s military ambitions. It failed to stop the previous four launches.
What we know: North Korea is making great strides in advancing their nuclear arsenal, with a new mobile launching system and the use of solid (nuclear) fuel. The ultimate goal: Attacking the U.S. and its allies. This new arsenal is harder to detect and increases its range — both providing a greater threat to national security.
Test #2. Russia spy ship spotted cruising along the Eastern U.S. seaboard. The ship is armed with surface-to-air missiles and is used to intercept communications.
Test #3. Four Russian jets fly within 200 yards of U.S. Navy destroyer USS Porter in the Black Sea. Interestingly, the Russian jets had transponders off and unable to acknowledge multiple radio calls from the American warship.
Test #4. There were reports this week that Russia deployed a new type of nuclear cruise missile that’s in direct conflict with the 1987 Intermediate-Range Nuclear Forces Treaty with the U.S.
 Just Coincidence?
It’s interesting how all these events are developing like a carefully orchestrated mission – in line with my war cycle forecasts.
Perhaps that’s why U.S. Defense Chief “Mad dog” Mattis prodded NATO member countries to pony up more capital into the defense fund. In fact, he’s looked for 2% of their GDP.
Officials from Germany and the U.K. agree, seeing the writing on the wall: It’s going to cost more to defend Western values in a challenging global environment.
But that’s exactly what I’ve been warning about since debuting forecasts of my war cycle research in December 2013. I said back then that the world would experience an environment of rising domestic and international unrest until at least 2020.
And that’s coming true in spades.
This geo-political hotbed could cause all kinds of economic and financial repercussions that could strip you of your wealth in the months and years ahead OR present once-in-a-lifetime opportunities to protect you and yours.
But it all depends on the quality of your guidance — and your ability to think for yourself, especially in times like these.
I know which way I’m headed … and which way I’m taking my subscribers and members.
Do you?
Best wishes, Larry @ https://edelsonwave.com

 Canadians pay some of the highest mutual fund fees in the world
- The opportunity cost of investment fees impact your portfolio
- Small fee reductions can mean big portfolio growth
Cage match: how do your mutual funds perform?
Let’s look at two different funds invested in the same securities, returning an average of 6% per year before management fees. For the purposes of these calculations, we will be using the mutual fund fee calculator from GetSmarterAboutMoney.ca.
If you start with a portfolio of $100,000 and contribute $10,000 a year, how much does the higher fee fund cost you over 25 years?
|
Fund #1 |
Fund #2 |
|
|
Initial investment |
$100,000 |
$100,000 |
|
Annual investment |
$10,000 |
$10,000 |
|
Average return before management fee |
6% |
6% |
|
Management fee |
2.42% per year |
0.77% per year |
|
Average return after management fee |
3.58% per year |
5.23% per year |
|
Total after 25 years |
$624,603.50 |
$840,363.04 |
Investing in the fund with the lower fee means your portfolio is almost a quarter of a million dollars larger than it would be if it was invested with the fund with a larger fee. The same amount invested; the difference in returns is an incredible $215,759.54.

Most readers of this column own (or plan to own) physical precious metals – gold and silver, perhaps even some platinum or palladium. They may also own mining stocks.
But which category is “best”? It’s like asking, “What’s the most efficient exercise?” or “What’s the best fishing lure?” Truth be known, it’s really about what you wish to accomplish! Here is my considered opinion…
Precious Metals Offer Insurance First – Profit Second
One should strongly consider holding physical precious metals for “investment first, profit potential second.”
The primary function of “metals in hand” is to help offset the possible loss of purchasing power that inflation or a changing business/regulatory climate might visit on a person’s other asset classes, such as the broad stock market, real estate, collectibles, and certainly, bonds.
“The One-Ring” – Gold and Silver
 This last category appears to be ending a literal 30-year bull market, during which time interest rates declined (and bonds rose) to levels not seen in many decades.
(A change in the secular trend, to rising interest rates, would have severe ramifications for the value of bonds, whether or not they are held to maturity.)
A side advantage, common in India but not discussed in this country, is that gold and silver can be easily be “pawned” when a person might not have other options for a loan. Just like any item left in the pawn shop owner’s care, precious metals can be redeemed when the loan has been paid off.
Indians have a much more nuanced – and relaxed – view about metals’ ownership. Outlookindia.com takes the pulse about how its citizens deal with the idea of buying gold and silver, noting, “If you bought gold today and its price falls tomorrow, you don’t say, oh, wish I had not bought gold, I lost money. You just look at your gold and say, I have got 200 grams of gold. That’s it.”
Mining Stocks Are Speculations
Mining stocks are an entirely different “investment animal.” You’re buying shares in companies who explore for and/or produce precious and base metals. Miners have many inherent risks to overcome, which the metal held in your hand, by virtue of having being refined, has already put behind it.
A miner’s profit can be adversely affected by all sorts of variables – operational factors like oil prices, the cost of labor, local community support or lack thereof, government regulations, and even nationalization (theft) of a company’s assets – which often takes place without compensation to the owners, let alone shareholders. A tailings dam collapse or accidental worker deaths can also affect the share price. Over the years, several such companies have seen theirs drop from multiple dollars each, to a fraction of that… or to zero.
 Some companies bill themselves as “pure silver producers.” The “purest” of these usually produce a fair amount of base metals – lead, copper and zinc – which are added to the profit mix to yield “equivalent silver ounces.” Even the best known examples may list 30-40% of their annual production in this non-silver category. A geologic fact is that silver veins tend to “pinch and swell,” causing ore head grades, and hence the company’s share price, to unexpectedly rise or fall.
A big argument for holding mining stocks is that because of their increased risk profile, they can be expected to gain at a greater percentage rate – perhaps several times as much – as do gold and silver. For a number of miners in 2016, that was certainly the case. Yet several of the best ones on the board also declined over 50% during last fall’s inevitable correction to the strong uptrend… which you may have noticed was not the case with the price of the metals they produced.
For much of the last 20 years, during which time, precious metals rose by multiples of their early bull market price, mining stocks as a group actually underperformed. So what’s the point of taking on additional risk and doing considerably more work, just to find that you could have made a single metals’ buy-and-hold decision – which performed better with less downside?
You should also answer these fundamental questions before deciding whether or not to include miners and metals in your investment mix. What are your financial goals? How much risk are you willing to take? How much time can you spend on the “care and maintenance” of your “garden” of stocks?
They can’t simply be purchased and placed in a drawer somewhere. Here are just a few of real-life, high-to-low ranges, stated in U.S. dollars, of share prices for several well-run, profitable miners during the cyclical bear market lasting from mid-2011 to late-2015 – $19 down to $7; $10.30 to $0.28; $43 to $5.38; $13 to $1; $36 fell to $3.30.
And did I mention that scores of other companies either reverse-split 20 (or 100):1… or simply went bankrupt?
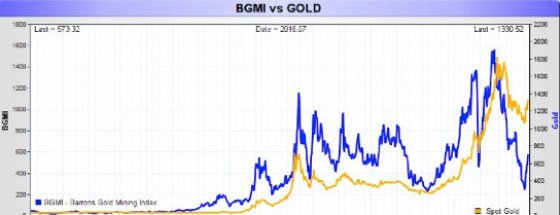
BGMI index vs. Gold
Why I Hold Mining Stocks and Why, Perhaps, You Should Not
Trading the mining sector is quite literally a job. I write reports, take mining tours, read hundreds of articles and evaluations on scores of companies – and trade mining stocks. But that’s my choice. It’s great when shares are rising to the sky, as was the case this past January to August. But it was NOT great when the bottom fell out into December.
I am willing to put up with these swings for the possibility of a few home runs, while often settling for base hits, along with the occasional “strike-out.” Do you have the temperament, are you willing to put in the research, can you handle the risk, do you want to give up a lot of the time you could spend doing something else?
Perhaps you can answer “yes” to these questions. If not, or the questions aren’t relevant to what you’re trying to accomplish, then you should seriously consider keeping decision-making about the metals, relevant to your needs and goals.
David Smith is Senior Analyst for TheMorganReport.com and a regular contributor to MoneyMetals.com. For the past 15 years he has investigated precious metals’ mines and exploration sites in Argentina, Chile, Mexico, Bolivia, China, Canada, and the U.S. He shares his resource sector observations with readers, the media, and North American investment conference attendees.
….related: Gold and Reflation
After many false promises and one false start, it is becoming evident that 2017 will be the year the Federal Reserve finally begins down the road towards interest rate normalization. Therefore, it is likely that Ms. Yellen will cause bond yields to rise this year on the short-end of the yield curve. In addition, soaring debt and deficits, along with the lack of central bank bond-buying, should send long-term rates much higher as well.
Wall Street soothsayers, who viewed every Fed rate cut as a buying opportunity for stocks, are now busily assuring investors that the potential dramatic and protracted move higher in bond yields will be bullish for stocks as well.
Their theory holds that the price of stocks and bonds are negatively correlated, as one moves up the other moves down. Hence, the nirvana of a safely balanced portfolio is achieved by simply owning a fairly even distribution of both. Therefore, according to Wall Street, the end of the thirty-five-year bull market in bonds will be a welcomed event for equities. This myth has a name, and it’s known as “the great rotation from bonds into stocks.”
The concept suggests that the investible market works like a balanced fund; as money moves out of bonds, it moves into stocks. And of course, you could cherry pick cycles over the past few decades that would provide support for this opinion. For instance, the biggest rise in interest rates (fall in price) was from February 1978 to November 1980. During this time the yield on the Ten-Year Treasury rose from 8.04% to 12.80%, while stock market averages enjoyed a healthy gain.
But when you take a step further back and look at the correlation between stock prices and bond yields since Nixon broke the gold window in 1971, you quickly realize that there is no such positive relationship. In fact, most of the time stock prices and bond yields move in the opposite direction. As bond yields increased (prices down) during the stagflation of the 70’s, stock prices went lower or simply stagnated. Then, after Fed Chair Paul Volcker vanquished inflation in the early ’80s, bond yields fell (prices increased) and stock prices went along for the ride.
This relationship makes perfect sense. An unstable economic environment of rising inflation and rising borrowing costs causes equities to suffer. Conversely, a healthy economic environment of steady growth and low inflation is beneficial for stocks.
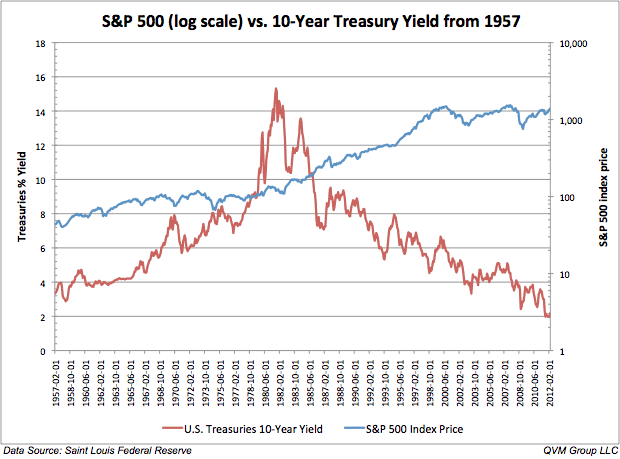
Focusing more closely on the period where the U.S. went completely off the gold standard we can easily see the flaw in the “great rotation theory.” Throughout the 1970’s bond prices plummeted as yields soared. But during that same ten-year period, for the most part, stock prices simply stagnated. In March of 1971, the S&P 500 was trading at 100, and the 10-Year yield was 5.53%. By the end of the decade, the yield on the Benchmark yield had soared to 12.64%, but the S&P 500 was still trading near 100. After losing nearly 40% of its value by 1974, the market managed to climb back to par by March 1980. Where did investors rotate their money during the 1970’s? The “great rotation theory” would suggest all that money should have flowed into stocks. But, as money gushed out of bonds it went into commodities and cash.
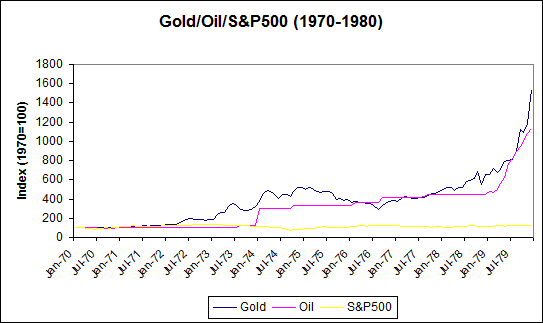
During the high inflation/low growth decade of the 1970’s, investors sought protection in gold and oil. Attesting that as money flowed out of bonds, it didn’t compulsively move into stocks.
Therefore, a better way to think about the long-term relationship between stocks and bonds is that the bull market in bond prices helped to foster the bull market in the major stock averages. Or, that on average the stock market does better in a period of falling bond yields. Yet, Wall Street chooses to make the opposite argument to allay investors’ fears as interest rates begin this huge secular move higher.
Escalating bond yields will finally break the 35-year trajectory of falling interest rates that has led to the decades-long bull market in the major stock market averages. At what yield this line officially breaks is up for debate. Bond King Bill Gross has indicated that 2.6% on the Ten-Year Treasury will end the bull market in bonds. DoubleLine Capital’s Jeff Gundlach argues that 3% is the level to watch. But both believe that 2017 will mark the end of the secular bull market in bonds; with Gundlach going out on a limb assuring it is “almost for sure” that the 10-Year is going to take out 3% this year.
This time around bond yields will initially rise for three reasons: the first because the credit quality of the government has been severely damaged as a result of the unprecedented amount of borrowing undertaken following the Great Recession, the second due to the fiscal profligacy proposed by President Trump, and third because our central bank has spring loaded interest rates by artificially holding them at record lows for the past eight years.
And that sets us up for the real surge in bond yields — yes, we haven’t seen anything yet.
Rising borrowing costs should send our debt-saturated economy into a recession, which by the way is already way overdue. That recession, coupled with the massive fiscal and monetary response to it from President Trump — think massive deficit spending and helicopter money — should engender the second phase of soaring rates that will result from spiking inflation and soaring debt levels. This unprecedented period of turmoil will once again prove that rising bond yields are seldom good for stocks, especially in real terms. And the bursting of this historic bond bubble certainly won’t be the exception.

And like that, it happened. Despite the polls, despite what anyone believed was possible, including many of his own supporters, billionaire developer Donald J. Trump was sworn in as the 45th President of the United States.
Whether you agree with him not, he’s now leader of the world’s largest economy and commander of history’s most powerful military force.
This is something that could only happen in the U.S.
President Trump and now-former President Barack Obama couldn’t be more different in their backgrounds, visions and leadership styles—more so than any other two men whose administrations happen to adjoin the other’s.
 |
And yet the transition went remarkably smoothly and orderly.
I don’t believe there’s ever been such a meaningful and potentially consequential transfer of power in U.S. history, with the incoming president all but promising to undo every last policy of his predecessor, line by line. That Obama peacefully and cordially handed over the executive office to a man who led the charge in questioning his legitimacy for a number of years is a testament to the strength and durability of our democratic process.
It’s a process that’s key to America’s exceptionalism.
Although I don’t always agree with Trump, it saddens me to see so much negativity about him in the media and protests in the streets. Now that he’s president, the time has come to unite behind him and root for his success. If he succeeds, America succeeds. If he fails—as many seem to hope for—America fails.
Take Warren Buffett. He backed Hillary Clinton throughout the primaries and general election. And yet on the eve of Trump’s inauguration, he said he supported the new president and his cabinet “overwhelmingly,” adding that he’s confident America “will work fine under Donald Trump.”
I think what Buffett recognizes is that the vast majority of people who voted for Trump did so for the right reasons. Throughout his campaign, Trump’s promise to bring back American jobs and secure the nation’s borders resonated with everyday folks who have begun to feel overlooked. Entrepreneurs, small business owners and those working in the financial industry found hope and encouragement in his pledge to lower corporate taxes and roll back regulations. (Just today, Trump told a room full of CEOs that he promised to cut regulations “by 75 percent, maybe more.”) I believe most Americans, regardless of political ideology, want these things—which is why we saw such a large number of people who previously voted for Obama give Trump their vote this time.
As I often say, government policy is a precursor to change, and we’re likely about to see some sweeping changes. But as investors, it’s as important as ever that we don’t panic or get distracted by the noise. Instead, continue to focus on the fundamentals and keep your eyes on the long-term prize.
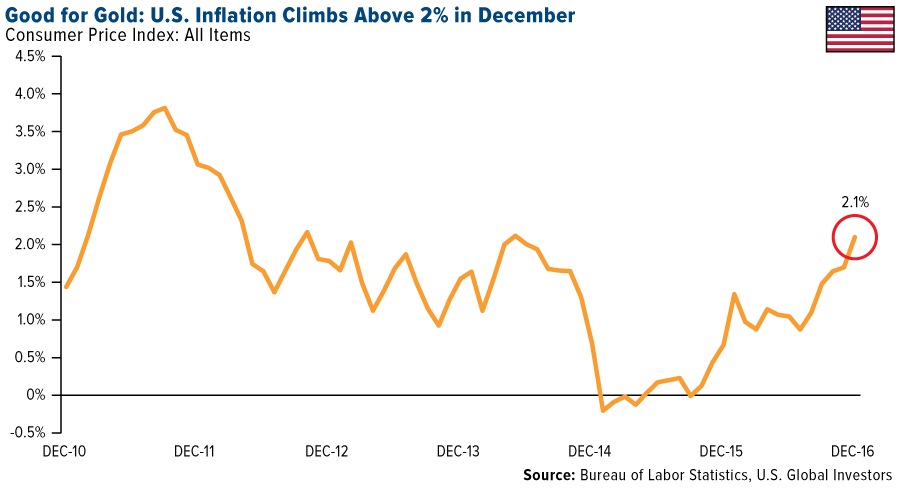
Inflation Plays Catch-Up
Inflation, as measured by the consumer price index (CPI), got a strong jolt in December, rising 2.1 percent year-over-year, its fastest pace in at least two-and-a-half years. Higher gasoline prices—which rose more than 8 percent in December—and health care costs were the main culprits, with medical bills surging the most in nine years.
Although they might hurt your pocketbook, pricier goods and services have historically been constructive for gold, as I’ve explained many times before. In August 2011, when gold hit its all-time high of $1,900 an ounce, inflation was running at 3.8 percent and the government was paying you an average 0.23 percent on the 2-year T-Note. That means investors were earning a negative 3.5 percent return, which helped boost gold’s “safe haven” status.
I expect CPI to continue to climb throughout this year and next, supported by additional interest rate hikes—two or three in 2017 alone—and President Trump’s protectionist policies.
The metal’s investment case could be strengthened even more now that Trump has officially been sworn in. His personal shortcomings and public office inexperience might raise more than a few “unknown unknowns” for some investors, prompting them to seek an alternative to stocks and bonds. Scotiabank hinted at this in a recent note, saying it expects gold holdings “to increase as investors look to diversify their portfolios in what seems likely to be a challenging year for investors.”
On Inauguration Day, gold rose a little under 1 percent to close at $1,210.
Whether you support the new president’s policies or not, it’s still prudent to maintain a 10 percent weighting in gold, with 5 percent in gold stocks, the other 5 percent in coins and bullion.
Another Gold Rally in the Works?
Look at the chart below. It’s indexed at 100 on the day the Federal Reserve raised rates in 2015 and 2016 (December 16 and 14, respectively). Although past performance doesn’t guarantee future results, gold prices so far this year appear to be tracking last year’s performance pretty closely, suggesting further upside potential.
In the first half of 2016, gold rallied more than 31 percent, from a low of $1,046 in December 2015 to a high of $1,375 in July. With mid-December 2016 as our starting point, a similar 31 percent move this year would add close to $360 to the price of gold, taking it to above $1,520 an ounce.
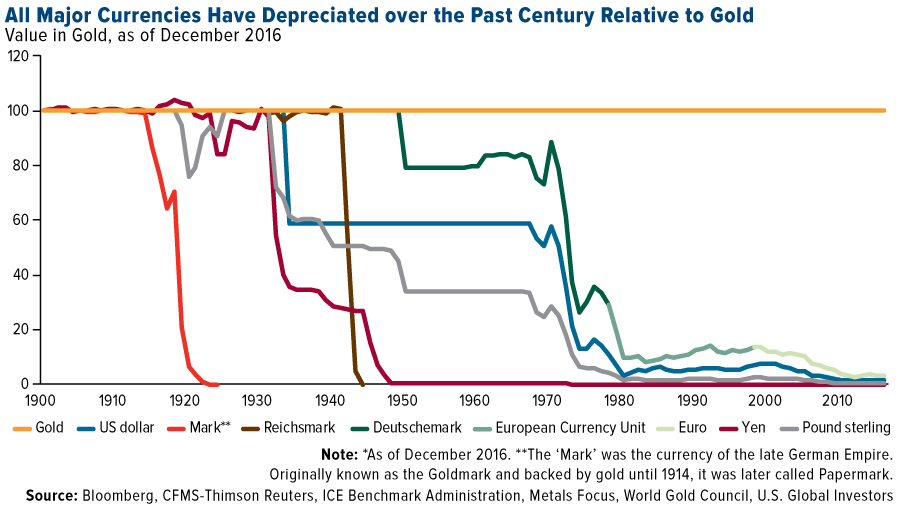
Gold Has a 100-Year History of Outperforming All Major Currencies
In its 2017 outlook, the influential World Gold Council (WGC) listed six major trends that will likely support gold demand throughout the year, including heightened geopolitical risks (Brexit, Trump, the global rise of populism), a potential stock market correction, rising inflation expectations and long-term Asian growth.
The group also calls out currency depreciation. Over the past 100 years, gold has strongly outperformed all major currencies. Whereas global gold supply grows at an annual average of only 2 percent, there’s no limit to how much fiat money can be printed.
Inflation and currency depreciation are among the Fear Trade’s triggers that I often write and speak about.
Spending Watchdog: U.S. Is on an “Unsustainable Fiscal Path”
This point about currency depreciation is especially relevant in light of an alarming new report from the U.S. Government Accountability Office (GAO), the nation’s watchdog. According to the report, the federal government’s spending is “unsustainable,” and if no action is taken to rectify the problem, the debt-to-GDP ratio will soon exceed its historical high of 106 percent, set in 1946.
To be clear, that means our nation’s debt will be larger than its economy.
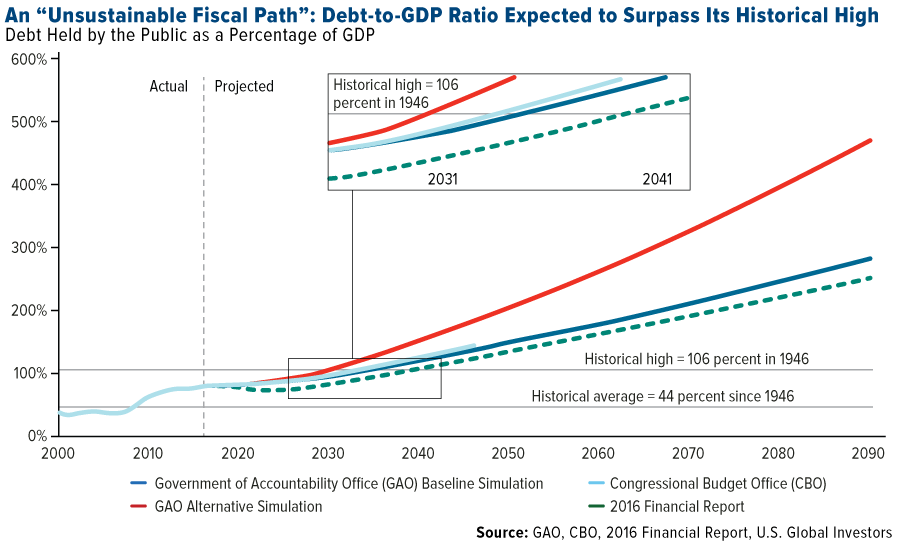
The federal deficit increased to $587 billion in 2016, after six years of declining deficits. Spending increases were driven by entitlement programs such as Medicare and Medicaid, which surged 4.9 percent and 5.3 percent, respectively, during the year.
Whether Trump can change any of this, we’ll just have to wait and see. He seems interested in lowering costs and bringing some fiscal sanity to the government, as demonstrated by his criticism of Boeing over the perceived cost of Air Force One. At the same time, massive tax cuts, coupled with a $1 trillion infrastructure package, will likely drive up deficit spending even more.
All the more reason to have a portion of your portfolio invested in gold and gold stocks.
In the meantime, I wish President Trump all the best!
All opinions expressed and data provided are subject to change without notice. Some of these opinions may not be appropriate to every investor. By clicking the link(s) above, you will be directed to a third-party website(s). U.S. Global Investors does not endorse all information supplied by this/these website(s) and is not responsible for its/their content.
The Consumer Price Index (CPI) is one of the most widely recognized price measures for tracking the price of a market basket of goods and services purchased by individuals. The weights of components are based on consumer spending patterns.
Holdings may change daily. Holdings are reported as of the most recent quarter-end. The following securities mentioned in the article were held by one or more accounts managed by U.S. Global Investors as of 12/31/2016: The Boeing Co.

-
I know Mike is a very solid investor and respect his opinions very much. So if he says pay attention to this or that - I will.
~ Dale G.
-
I've started managing my own investments so view Michael's site as a one-stop shop from which to get information and perspectives.
~ Dave E.
-
Michael offers easy reading, honest, common sense information that anyone can use in a practical manner.
~ der_al.
-
A sane voice in a scrambled investment world.
~ Ed R.
Inside Edge Pro Contributors

Greg Weldon

Josef Schachter

Tyler Bollhorn

Ryan Irvine

Paul Beattie

Martin Straith

Patrick Ceresna

Mark Leibovit

James Thorne

Victor Adair